
Picking a suitable stock for investment is an art. Long-term investors prefer to invest in undervalued stocks to create wealth in the long run. But is it worth investing in undervalued stocks, given the considerable time and research it takes to find one?
In this blog, we will explore the most promising undervalued stocks in India and the significant advantages of investing in them.
Meaning of Undervalued Stocks
Undervalued stocks are those stocks that are currently priced lower than their true, fair, or intrinsic value based on several reasons like panic selling, bad news, market mood, etc. This usually occurs when the prevailing market price of any share does not represent its actual earnings, assets, and growth opportunity.
List of Top 10 Undervalued Stocks in India
- Bank of Baroda
- Power Finance Corporation Limited
- Punjab National Bank
- Coal India Limited
- REC Limited
- Oil & Natural Gas Corporation Limited
- Tata Motors Limited
- Bharat Petroleum Corporation Limited
- State Bank of India
- Vedanta Limited
Note: The above list is in ascending order based on their PE ratio. These can be considered as fundamentally strong but undervalued stocks as of 25 March 2025.
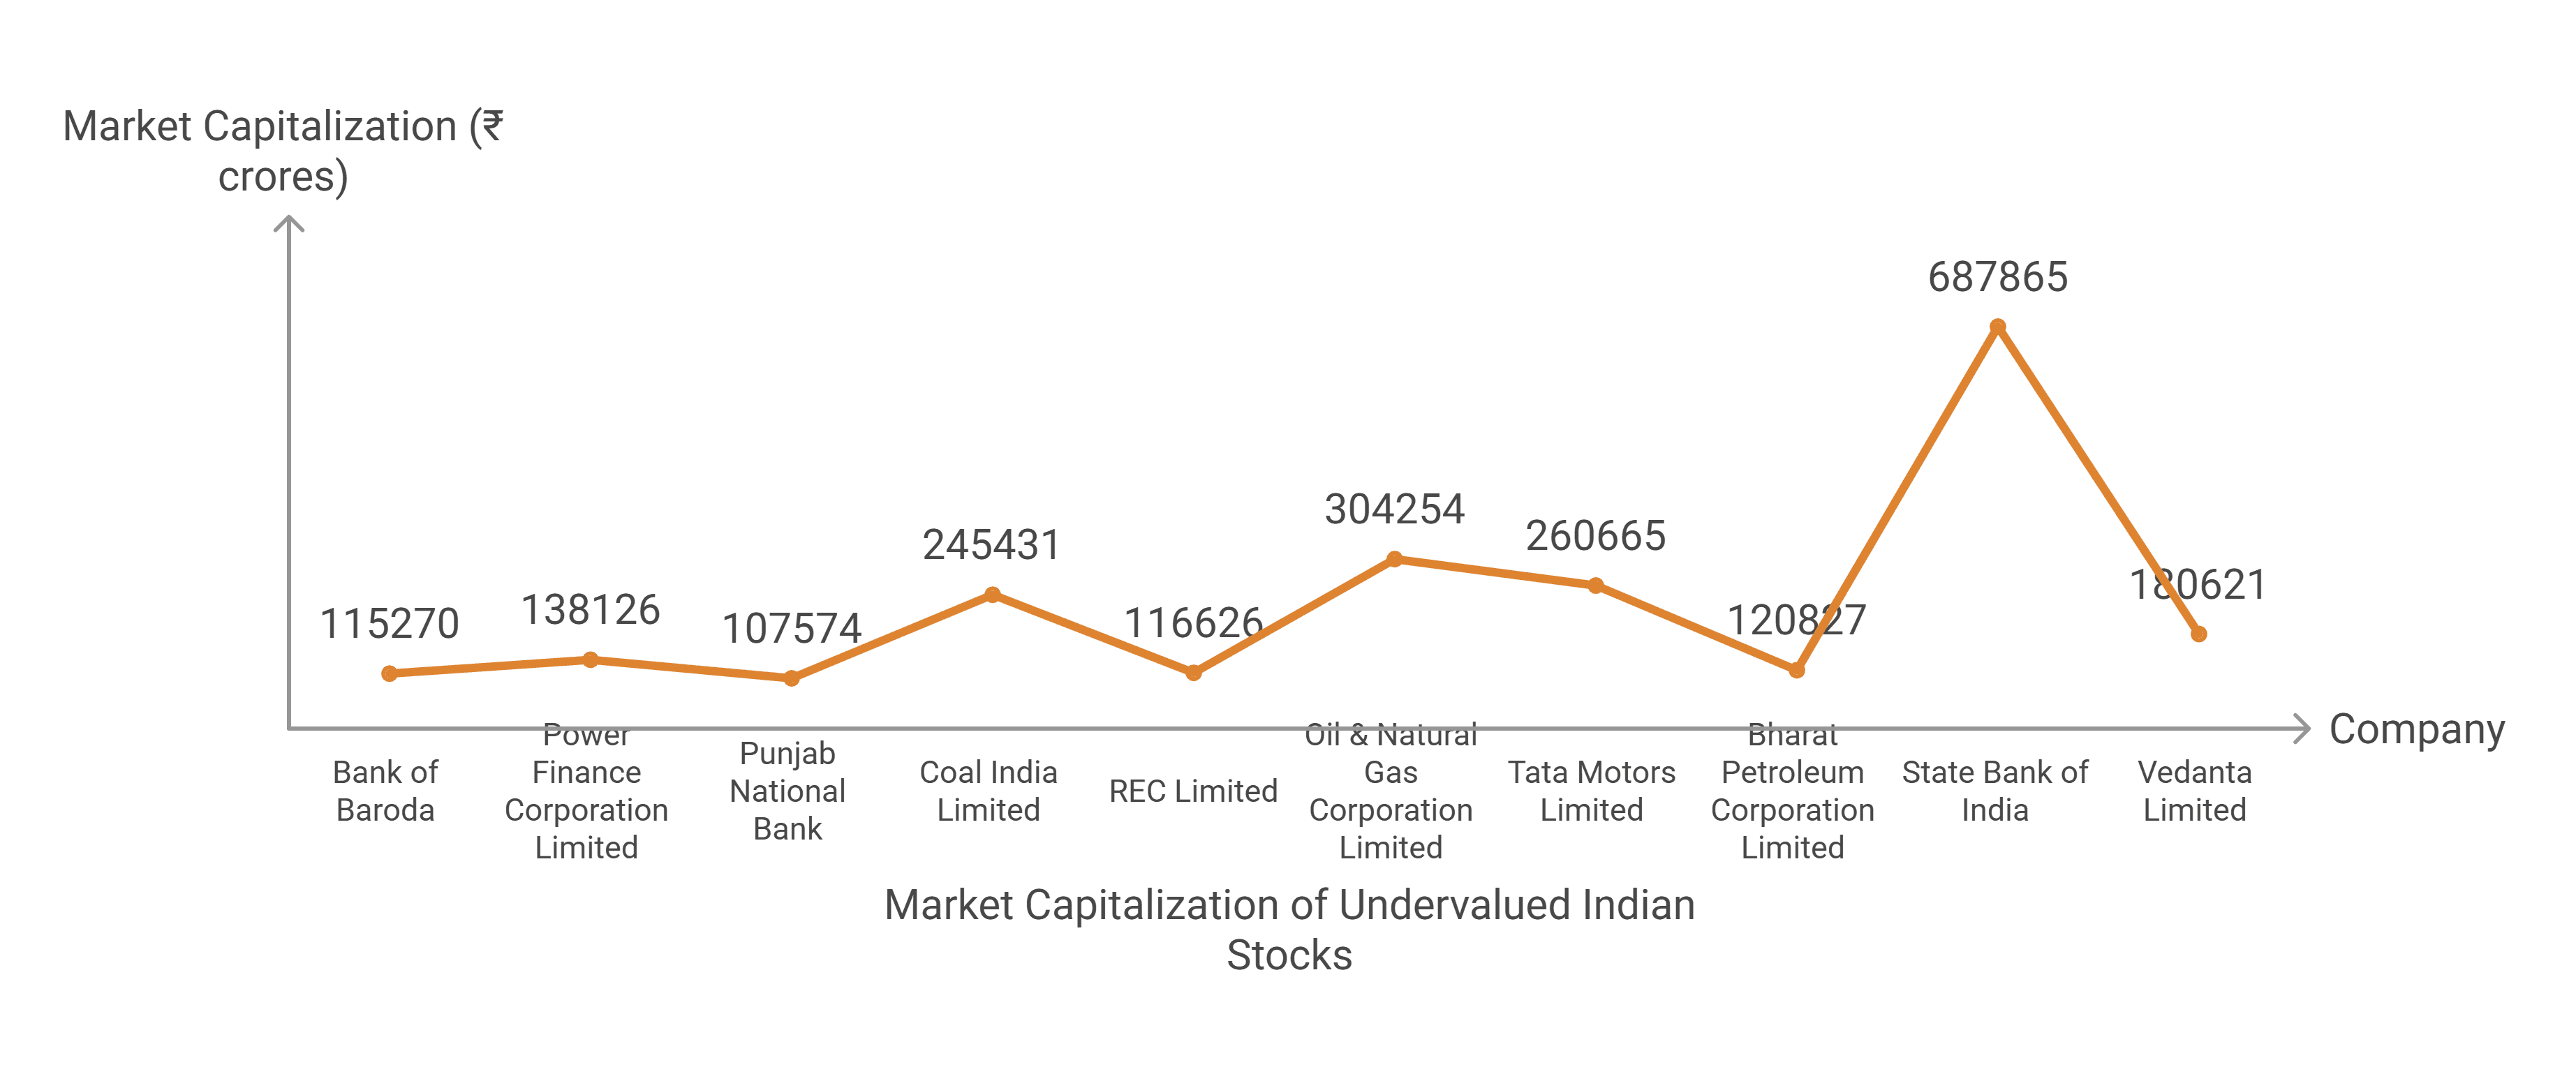
Market Information of Most Undervalued Stocks in India
| Company | Current Market Price (₹) | Market Capitalization (in ₹ crores) | 52 Week High (₹) | 52 Week Low (₹) | P/E Ratio |
|---|---|---|---|---|---|
| Bank of Baroda | 296 | 1,53,355 | 313 | 191 | 5.65 |
| Power Finance Corporation Limited | 359 | 1,18,376 | 444 | 330 | 6.18 |
| Punjab National Bank | 120 | 1,38,099 | 135 | 85.5 | 6.31 |
| Coal India Limited | 419 | 2,58,002 | 442 | 349 | 7.19 |
| REC Limited | 361 | 95,047 | 468 | 331 | 7.43 |
| Oil & Natural Gas Corporation Limited | 246 | 3,08,921 | 266 | 205 | 7.75 |
| Tata Motors Limited | 449 | 1,65,374 | 456 | 306 | 8.11 |
| Bharat Petroleum Corporation Limited | 349 | 1,51,544 | 388 | 234 | 8.60 |
| State Bank of India | 1,029 | 9,50,290 | 1,056 | 680 | 8.66 |
| Vedanta Limited | 684 | 2,67,686 | 699 | 362 | 15.2 |
Read Also: How to find and identify undervalued stocks
Best Undervalued Stocks in India – An Overview
The top 10 most undervalued stocks in India are:
1. Bank of Baroda
The bank was established in 1908 by the Baroda ruler, Maharaja Sayajirao Gaekwad. He established the bank to support the growth of the local economy. Later, in 1969, the Indian government nationalized the bank and other commercial banks. After combining with Dena Bank and Vijaya Bank in 2019, the Bank of Baroda became the third-largest public sector bank in India to improve its operational efficacy in terms of assets and customers. The bank’s headquarters is situated in Vadodara, Gujarat.
Know the Returns:
| 1Y Return (%) | 3Y Return (%) | 5Y Return (%) |
|---|---|---|
| 30.15% | 64.09% | 296.92% |
2. Power Finance Corporation Limited
Power Finance Corporation Limited, or PFC, is one of the leading PSUs in India and was established in 1986. The company provides funding for initiatives related to transmission and distribution as well as power generation. The business also expresses interest in renewable energy projects and works to support the execution of several government programs. The company’s headquarters is situated in New Delhi.
Know the Returns:
| 1Y Return (%) | 3Y Return (%) | 5Y Return (%) |
|---|---|---|
| -14.37% | 197.07% | 285.82% |
3. Punjab National Bank
The bank was founded in Lahore, Pakistan, in 1894 by Indian freedom hero Lala Lajpat Rai. It was established in the capital and is recognized as the country’s first bank. After obtaining independence, the bank moved its headquarters to New Delhi. Later, in 1969, it was nationalized along with thirteen other banks. In 2003, it acquired Nedungadi Bank, and in 2020, it amalgamated with the United Bank of India and Oriental Bank of Commerce.
Know the Returns:
| 1Y Return (%) | 3Y Return (%) | 5Y Return (%) |
|---|---|---|
| 22.73% | 109.85% | 243.26% |
4. Coal India Limited
Founded in 1975, Coal India is the largest coal mining enterprise in the world, with its headquarters located in Kolkata, West Bengal. In 2011, the company received the “Maharatna” status from the Indian government. In 2010, the company went public on the stock exchange and now operates several coal mines. Coal India Limited is responsible for over 82% of India’s total coal production as of 2024.
Know the Returns:
| 1Y Return (%) | 3Y Return (%) | 5Y Return (%) |
|---|---|---|
| 10.74% | 82.95% | 82.95% |
5. REC Limited
REC, or Rural Electrification Corporation Limited, was incorporated in 1969 to construct rural electrification infrastructure. The company came out with its IPO in 2008 and became a listed company. Later, in 2010, it was given the status of “Navratna” by the Government of India. PFC, or Power Finance Corporation Limited, bought a majority stake in it, and it became a subsidiary company of PFC. The company’s corporate office is situated in New Delhi.
Know the Returns:
| 1Y Return (%) | 3Y Return (%) | 5Y Return (%) |
|---|---|---|
| -21.55% | 190.12% | 240.14% |
6. Oil & Natural Gas Corporation Limited
One of India’s largest producers of natural gas and oil, ONGC Ltd was founded in 1956 as a result of a suggestion by the Planning Commission Committee. The company discovered significant oil reserves, notably those in Gujarat’s Ankleshwar and Assam. The headquarters of the company is situated in New Delhi.
Know the Returns:
| 1Y Return (%) | 3Y Return (%) | 5Y Return (%) |
|---|---|---|
| -6.54% | 61.12% | 164.15% |
7. Tata Motors Limited
The Tata Engineering and Locomotive Company, or TELCO for short, was the original name of Tata Motors Limited when it was founded in 1945. After establishing a joint venture with the German company Daimler Benz, the company began producing trucks. It was a smart strategic move for the corporation to purchase the luxury British automaker Jaguar Land Rover in 2008. The Tata Nexon EV has established a reputation for itself in the EV sector since its launch. The company’s headquarters are in Mumbai.
Know the Returns:
| 1Y Return (%) | 3Y Return (%) | 5Y Return (%) |
|---|---|---|
| -53.57% | -15.27% | 16.15% |
8. Bharat Petroleum Corporation Limited
BPCL Ltd was founded in 1952 as a joint venture between the Indian government and Burmah Shell, and after the government of India acquired Burmah Shell in 1976, it became a fully owned government corporation. The Ministry of Petroleum and Natural Gas of the Indian government oversees the exploration, refinement, distribution, marketing, and retailing of petroleum and petroleum-related products. The company’s headquarters are located in Mumbai.
Know the Returns:
| 1Y Return (%) | 3Y Return (%) | 5Y Return (%) |
|---|---|---|
| 23.57% | 101.56% | 74.85% |
9. State Bank of India
With the biggest market share, SBI is the biggest public sector bank in India and a giant in the country’s banking industry. With its headquarters located in Mumbai, SBI has a long history spanning more than 200 years. The first joint stock bank in British India, the Bank of Calcutta, was founded in 1806. Throughout British India, three distinct presidential banks – the Bank of Bengal, the Bank of Bombay, and the Bank of Madras. The Imperial Bank of India was created in 1921 by the merger of the three Presidency Banks. The Indian government nationalized the Imperial Bank of India in 1955 and changed its name to the State Bank of India.
Know the Returns:
| 1Y Return (%) | 3Y Return (%) | 5Y Return (%) |
|---|---|---|
| 37.12% | 71.83% | 261.48% |
10. Vedanta Limited
Vedanta is an Indian company that was founded in 1976 and operates in the mining, oil, and gas sectors. Initially called Sterlite Industries Limited, the company’s main activity was manufacturing telecom cables and other products. They purchased a copper mine in Australia and began producing copper in the early 1990s. In 2001, the company went public on the New York Stock Exchange. By purchasing Cairn India, Vedanta Limited increased the scope of its oil and gas holdings.
Know the Returns:
| 1Y Return (%) | 3Y Return (%) | 5Y Return (%) |
|---|---|---|
| 51.92% | 107.03% | 312.99% |
Key Performance Indicators (KPIs)
| Company | Operating Margin (%) | Net Profit Margin (%) | ROE (%) | ROCE (%) |
|---|---|---|---|---|
| Bank of Baroda | 25.61 | 15.55 | 15.67 | 2.38 |
| Power Finance Corporation Limited | 100.49 | 29.04 | 19.53 | 67.44 |
| Punjab National Bank | 15.46 | 7.63 | 8.92 | 1.60 |
| Coal India Limited | 34.57 | 25.95 | 45.21 | 27.89 |
| REC Limited | 100.84 | 29.77 | 20.56 | 68.62 |
| Oil & Natural Gas Corporation Limited | 14.59 | 9.24 | 14.60 | 15.43 |
| Tata Motors Limited | 8.72 | 7.10 | 36.97 | 19.39 |
| Bharat Petroleum Corporation Limited | 8.82 | 5.75 | 35.51 | 32.53 |
| State Bank of India | 20.34 | 15.51 | 17.31 | 1.63 |
| Vedanta Limited | 18.80 | 5.24 | 13.79 | 24.09 |
Read Also: 10 Best Copper Stocks in India
Benefits of Investing in Undervalued Stocks
The following are the main advantages of investing in undervalued stocks in India:
- High Returns: As these stocks trade below their actual intrinsic value, they have the potential to generate high returns as their share prices converge with their true value. Therefore, investing in undervalued stocks provides an opportunity to earn profit.
- Cheap Buying: As the stocks are undervalued, there is no risk of overpaying when purchasing them. Hence, it provides a margin of safety and reduces the risk associated with investing.
- Less Volatile: Undervalued stocks are already trading at a discount; therefore, they are not affected by market fluctuations much.
- Dividends: Even though the stocks are undervalued, the underlying business continues to earn stable profits and pay regular dividends, which can be a passive source of income for investors.
- Patience: Investing in undervalued stocks requires lots of patience and discipline as the prices increase over a while.
Disadvantages of Investing in Undervalued Stocks
The various disadvantages to investing in undervalued stocks are mentioned below:
- False Signals: It is not necessary that every undervalued stock can recover and regain its value. There might be some cases when the stock might look undervalued, but it might be due to the inefficient business model, poor financial performance, etc. If these are the reasons behind undervaluation, then it might never regain its original value.
- Short-Term Gains: Traders looking for short-term gains should avoid undervalued stocks as these stocks tend to perform in the long run.
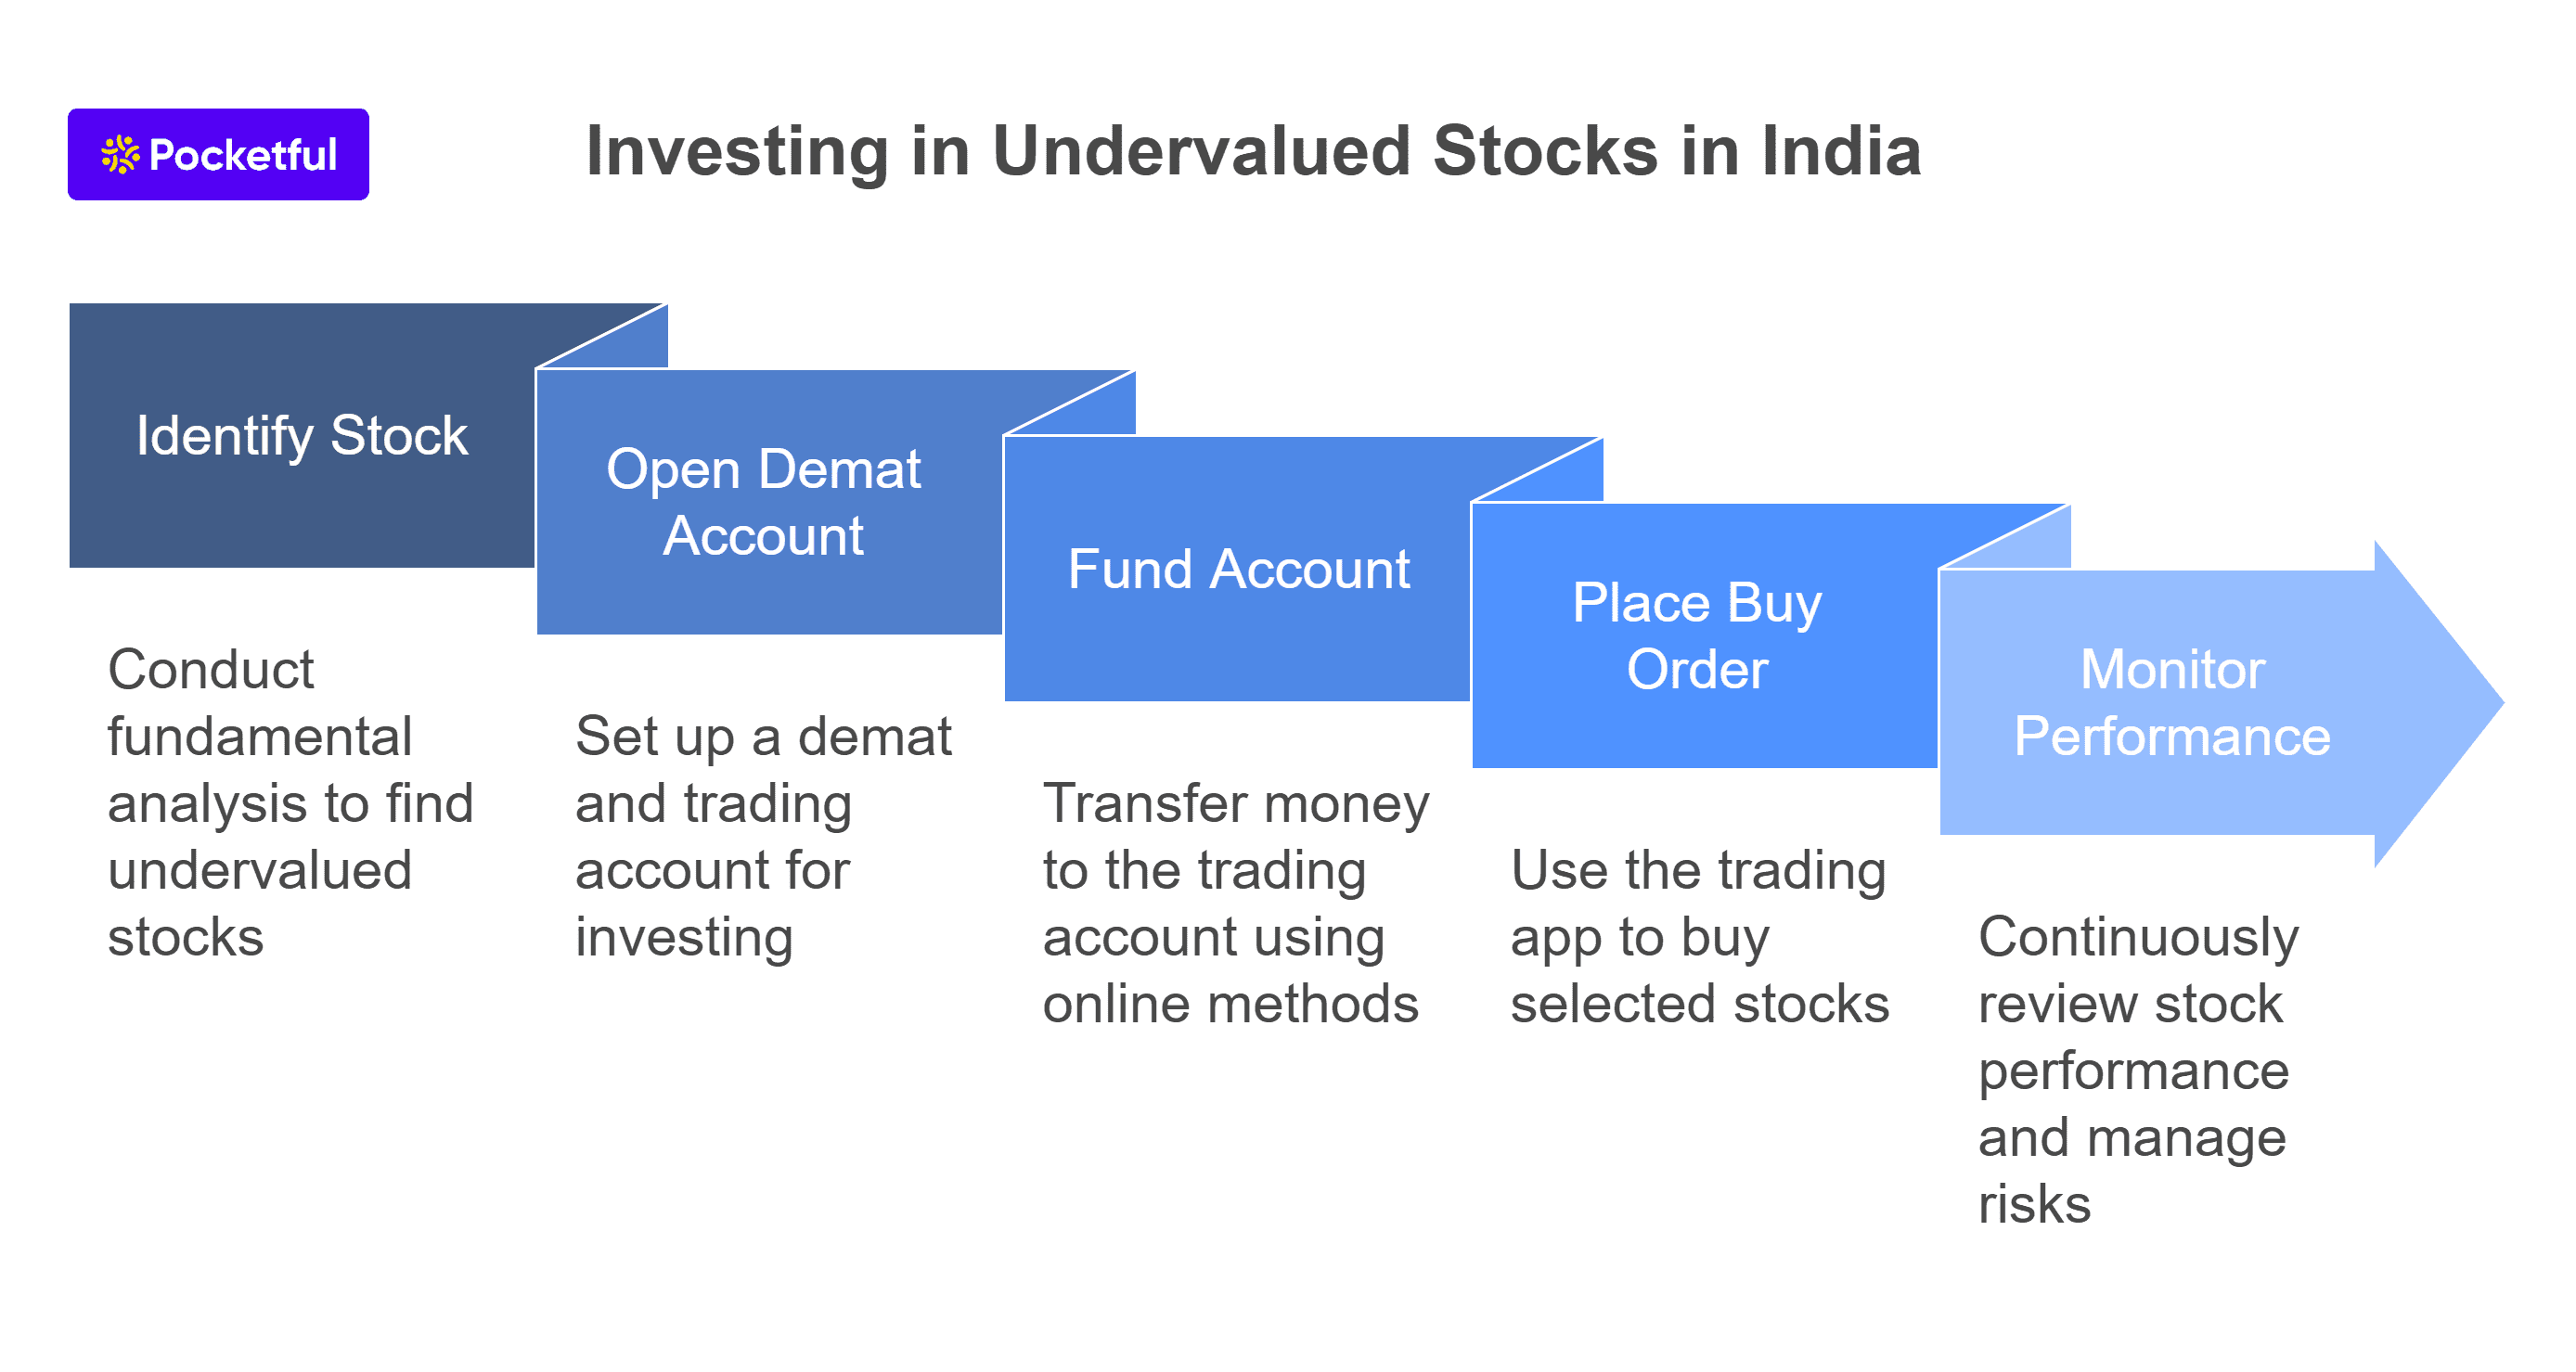
How to Invest in Undervalued Stocks in India?
To invest in undervalued stocks in India, one can follow the below-mentioned steps:
- Identify the Stock: The first step is to identify the undervalued stock. Fundamental analysis helps an investor in identifying undervalued stock.
- Demat Account: To invest in undervalued stock, one is required to have a demat and trading account. Pocketful also offers you an opportunity to open a free demat account so that you can easily invest in undervalued stocks using their advanced trading platform.
- Funding: Once the Demat account is opened successfully, you can easily transfer funds to your trading account to purchase the stock. Nowadays, there are various online options through which one can transfer funds, such as UPI, RTGS, and NEFT.
- Investing: You can place a buy order for the selected undervalued stock. The order can be placed using the trading application provided by your broker.
- Reviewing: As the stock is purchased, an investor is required to continuously monitor its performance to realize the profit accordingly. It is advisable to place a proper stop-loss to reduce the potential loss.
Read Also: NEFT vs RTGS vs UPI vs IMPS: A Comparative Study
Conclusion
On a concluding note, investing in undervalued stocks can help an investor in creating wealth in the long run. However, finding such an opportunity is rare, and not every undervalued stock has growth potential. Therefore, investors are required to conduct a thorough fundamental analysis. Along with this, it is necessary to consult your investment advisor before making any investment decision.
| S.NO. | Check Out These Interesting Posts You Might Enjoy! |
|---|---|
| 1 | List Of Best Healthcare Stocks in India |
| 2 | List of Best Telecom Stocks in India |
| 3 | List Of Best Footwear Stocks in India |
| 4 | List Of Best Logistics Stocks in India |
| 5 | List of Best Liquor Stocks in India |
Frequently Asked Questions (FAQs)
What are undervalued stocks?
When the stock price of any company is trading below its actual or intrinsic value, it is known as an undervalued stock.
Why do the stock prices fall below their intrinsic values?
The stock prices fall below their intrinsic value because of negative investor sentiments, economic downturns, poor performance, or any negative news.
How to identify the undervalued stocks?
Undervalued stocks can be identified using various fundamental tools such as PE (Price to Earning), PB (Price to Book Value) Ratio, Discounted Cash Flow Analysis, etc.
What is the meaning of “ValueTrap”?
A value trap is a condition when a stock is undervalued not because of any event but remains cheap due to poor fundamentals, such as excessive debt, decreasing profits, revenue, inefficient management, etc. These stocks generally do not recover and trap the investors.
What are some undervalued stocks?
Some undervalued large-cap stocks are SBI, Punjab National Bank, Tata Motors, etc.