Blog

  • What is Averaging Up in Stock Trading?

    What is Averaging Up in Stock Trading?

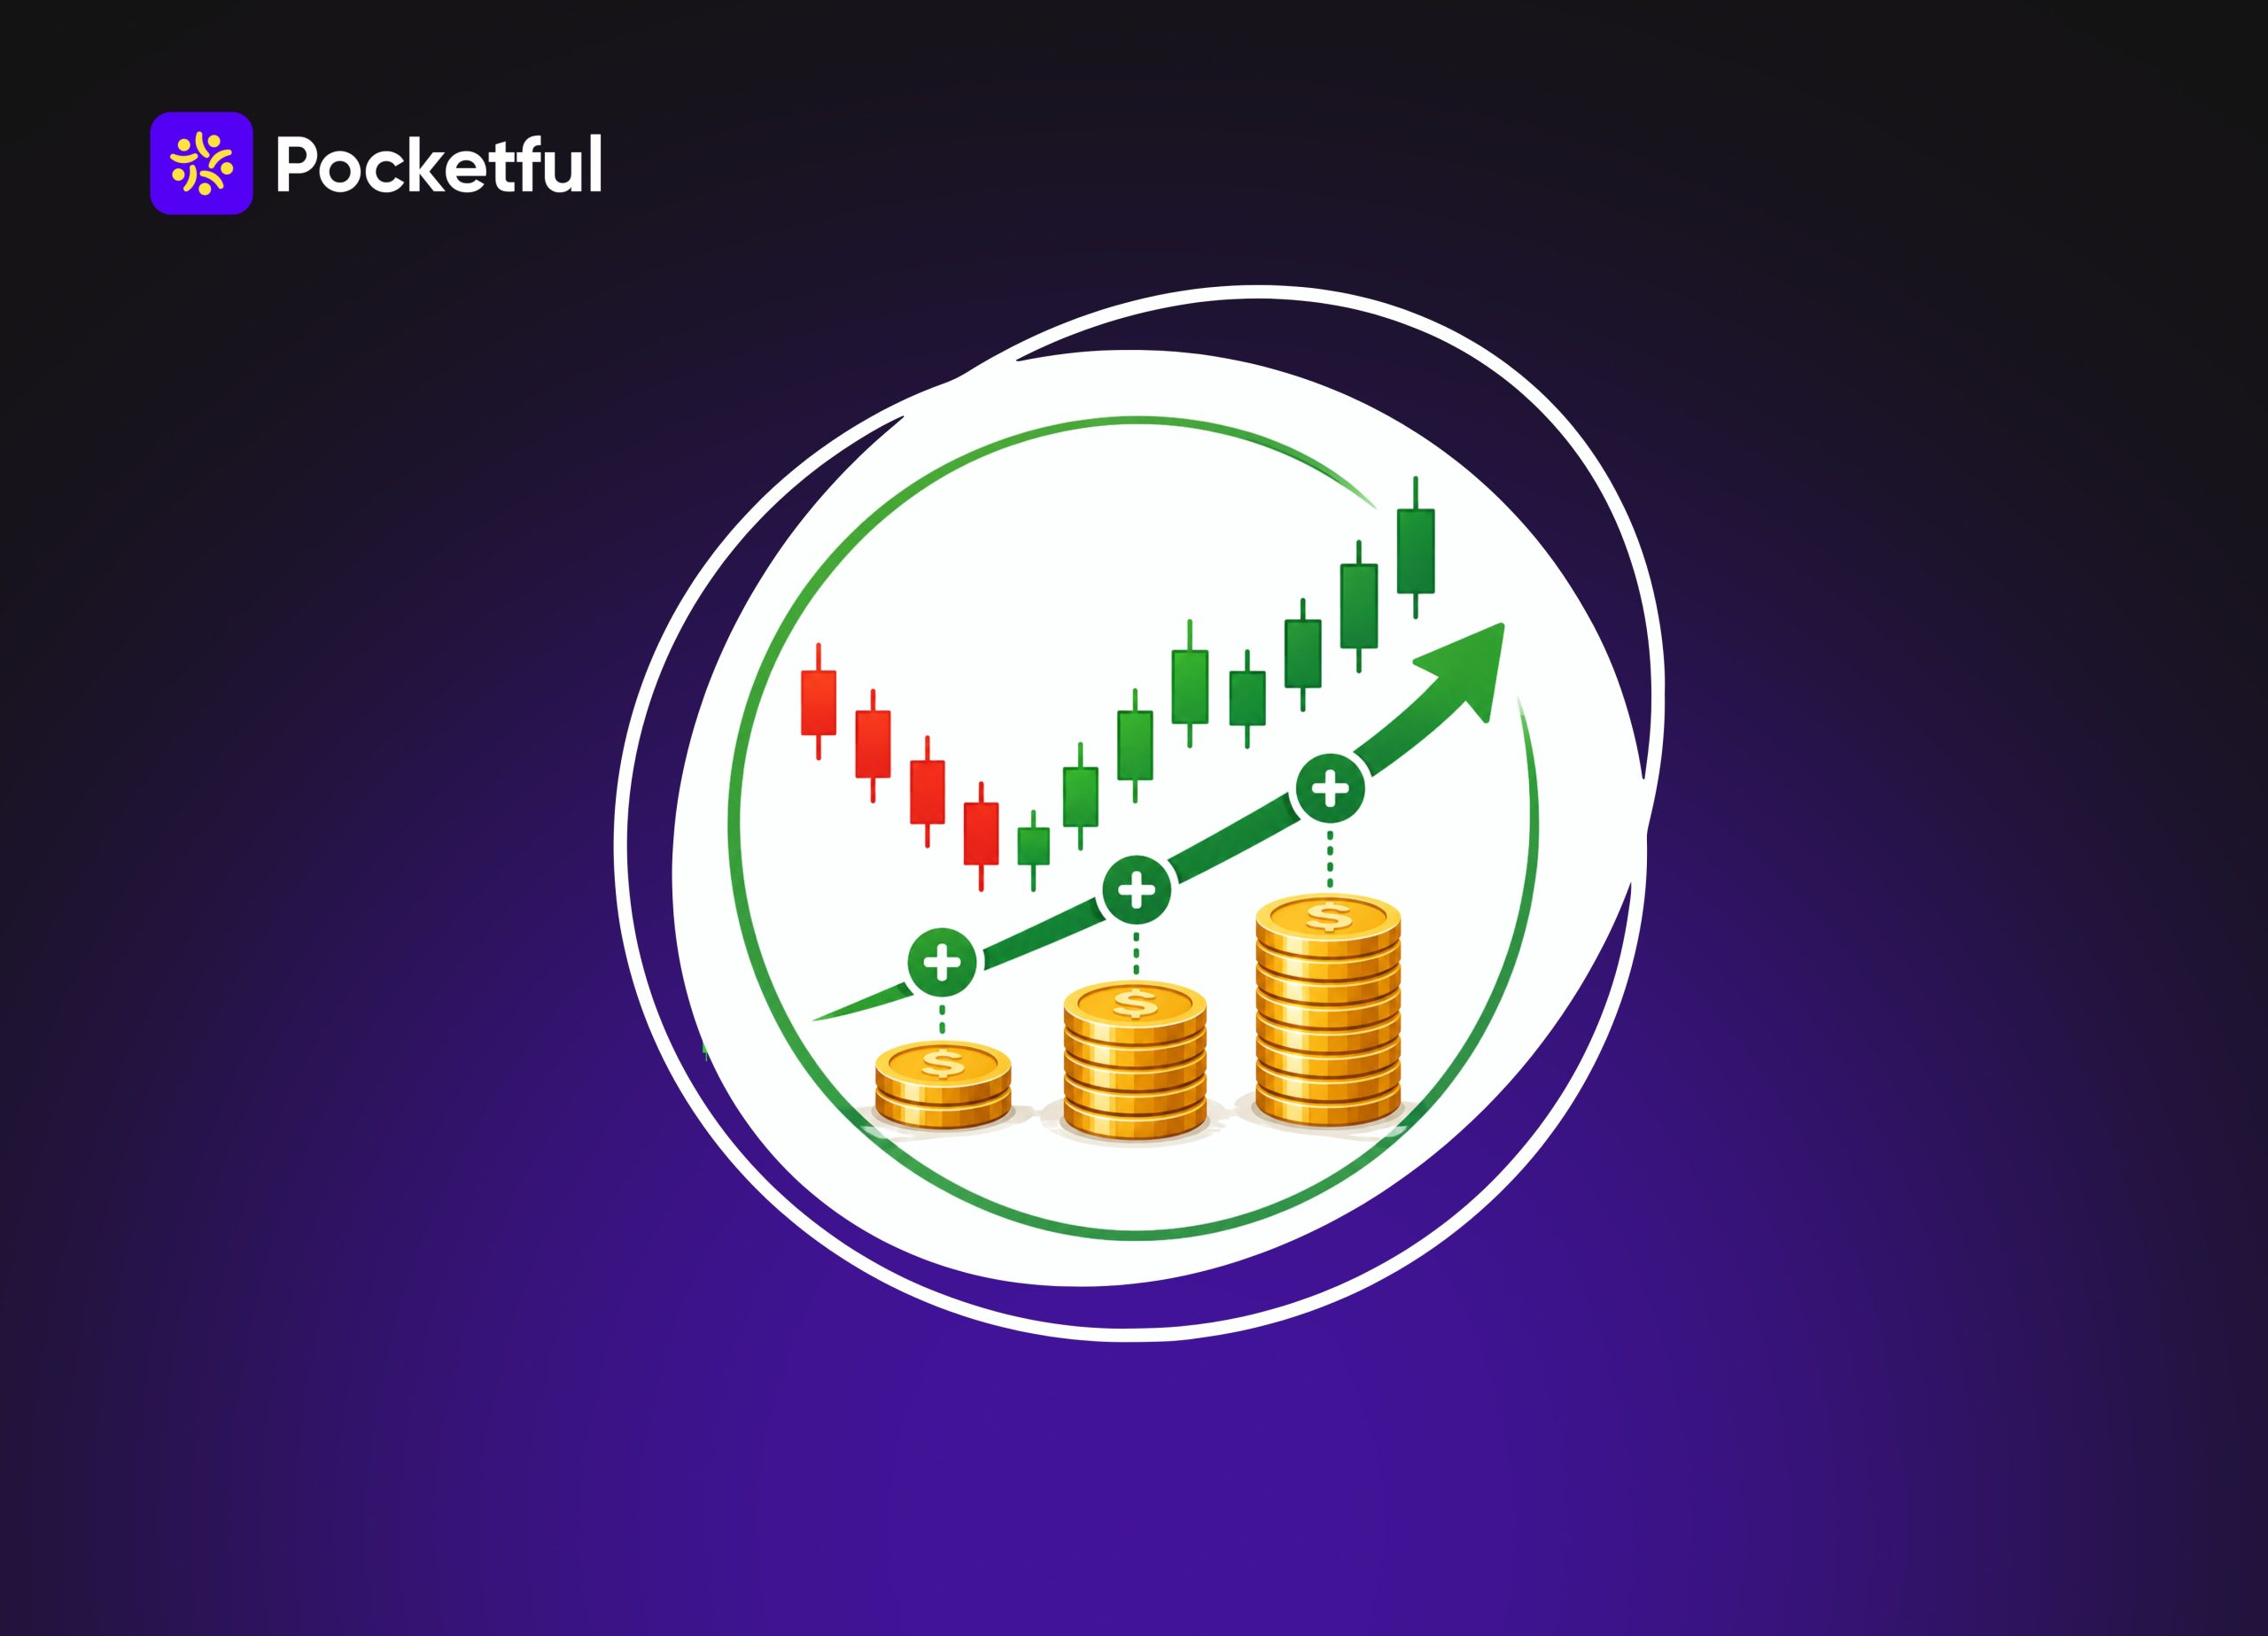
    You invest in a stock with the expectation that its price will go up in the future, but at some point you thought that you had purchased a smaller quantity, but the stock has immense growth potential. Then you decide to average it up, but it can significantly increase the average buy price. This is known as “Averaging Up in Stocks”.

    In today’s blog post, we will give you an overview of averaging up in stock trading, along with its key benefits and limitations.

    What is Averaging Up in Stocks?

    Averaging up in stocks refers to an investment strategy in which an investor purchases more shares even if the price has increased from their initial purchase price. Due to this, the investor’s initial purchase price goes up. The primary reason for averaging up is that the investor has strong confidence that the price may rise in the future; there can be various reasons for this, such as a company’s earnings, market growth, etc.

    Key Features of Averaging Up in Stocks

    The key features of averaging up in stocks are as follows:

    • Purchasing at a Higher Price: The shares in averaging up are purchased at a higher price when compared with the current purchase price.
    • Increases Price: Averaging up will eventually increase the cost of purchasing by increasing the purchase price.
    • Requires Risk Management: As investors are continuously increasing their position, a sudden fall in stock prices can affect the position of the investor in a significantly negative manner.
    • Requires Regular Monitoring: While averaging up, investors are required to regularly review the performance of stocks. If the fundamentals of the stock change, averaging will no longer make any sense.

      Example of Averaging Up in Stocks

      Suppose you hold 100 shares of ABC Limited for INR 100 each, and your current investment value will be INR 10,000.
      You have a strong conviction about the future growth prospects of the company. Then you decided to add more shares to your portfolio. But the current stock price is INR 120 per share. 

      You have purchased an additional 100 shares at this price. Now your investment will look like.

      PurchaseQuantityPrice per shareInvestment Amount
      First 10010010000
      Second10012012000
      Total20022000

      Now, let’s calculate the average price per share:

      Average Price = Total Purchase Amount / Total Quantity

      22000 / 200 = 110 INR per share.

      Benefits of Averaging Up in Stocks

      The key benefits of averaging up in stocks are as follows:

      • Increase Return: If the stocks continue their upward movement, the additional purchases made by the investor through averaging up can increase the return of the portfolio.
      • Participate in Further Growth: Generally, investors avoid buying a stock that has risen because they feel the opportunity is missed. If a stock has growth potential, investors can slowly increase their holding instead of waiting for a correction.
      • Investment Discipline: There can be a pre-defined strategy that will lead to averaging up, such as a fixed amount of investment after every defined frequency, etc.
      • Long-Term Growth Strategy: Averaging up is suitable for long-term investing. If the company continues to increase its revenue, profit, and other metrics, investors are still likely to pay a higher price for such stock.
      • No Need to Time the Market: Investors are always stressed about market movements and timing the market. They always find the perfect exit point, which is very difficult for an investor. But consistent averaging up allows them to avoid market timing. 

        Risk of Averaging Up in Stocks

        The key risks of averaging up in stocks are as follows:

        • Overvalued Price: A continuous rally in a stock can make it expensive compared to its intrinsic value. In this case, if the investor continuously averages it up, they might end up buying that stock at an inflated price.
        • Trend Reversal: If a stock has been consistently performing well, there can be a chance of a sudden trend reversal because of weak earnings, news, etc. If an investor has consistently averaged up their position, it can result in a huge loss.
        • Concentration Risk: Consistently adding stocks at a higher level can make a stock a significant part of your portfolio. If the company faces any problem, this can lead to a large loss.
        • Emotional Decision: Investors might feel tempted to buy more of a stock at a higher price because of emotional fear of missing further upside gains. This fear of missing out will lead to speculative rallies.
        • Changes in Fundamentals: The financial performance of a company can change suddenly due to factors like interest rates, the economic cycle, sector performance, etc. 

        Read Also: What is Moving Averages?

          When to Average Up in Stocks

          There are certain situations when one can average up in stocks, as follows:

          • Fundamentally Strong Company: In case a company continues to consistently report revenue growth, increasing profits, cash flow, etc.
          • Earnings are Supporting Price: A stock should be averaged up when the rise in price is supported by the earnings of the company. If the earnings are growing, the valuation consistently remains reasonable.
          • Predefined Buying Plan: Averaging up is suggested if you have a pre-defined buying plan based on the results posted by the company every quarter.
          • Position Size: Before adding more shares in your portfolio at a higher price, one is advised to adjust the position size, and it must not go above the risk appetite and should not be highly concentrated.

            Mistakes to Avoid While Averaging Up

            The key mistakes that an investor should avoid while averaging up stocks are as follows:

            • Rising Stock Price: A rising stock price does not mean that it is a good stock to buy; before averaging up, one must understand why the stock is moving up.
            • Valuation Concern: Ignoring the valuation of the companies and averaging them up is the key mistake that most of the buyers make. Buying stocks at extensively higher prices may lead to little room for growth.
            • Over Positioning: Continuously purchasing one stock can make it a large part of your portfolio. And if a company faces any unexpected problem, the investor may face a huge loss.
            • No Stop-Loss: If an investor does not follow an exit strategy, they might hold a stock even if it falls below a certain level.

              Conclusion

              On a concluding note, averaging up is a smart way to increase your position in a stock that has high growth potential in the long-run. Through averaging up, an investor adds more shares of a company that is performing well when the company is performing well in fundamentals, growth prospects, etc. However, before averaging up any stock, investors should look for a company’s valuation, performance, market conditions, etc. But it is advisable to consult your investment advisor before averaging up the stock. Invest in stocks with Pocketful and enjoy zero brokerage on delivery trades, helping you invest without worrying about brokerage costs on every purchase. Whether you are building your portfolio or averaging up on stocks you believe in, Pocketful helps you invest more efficiently. 

              S.NO.Check Out These Interesting Posts You Might Enjoy!
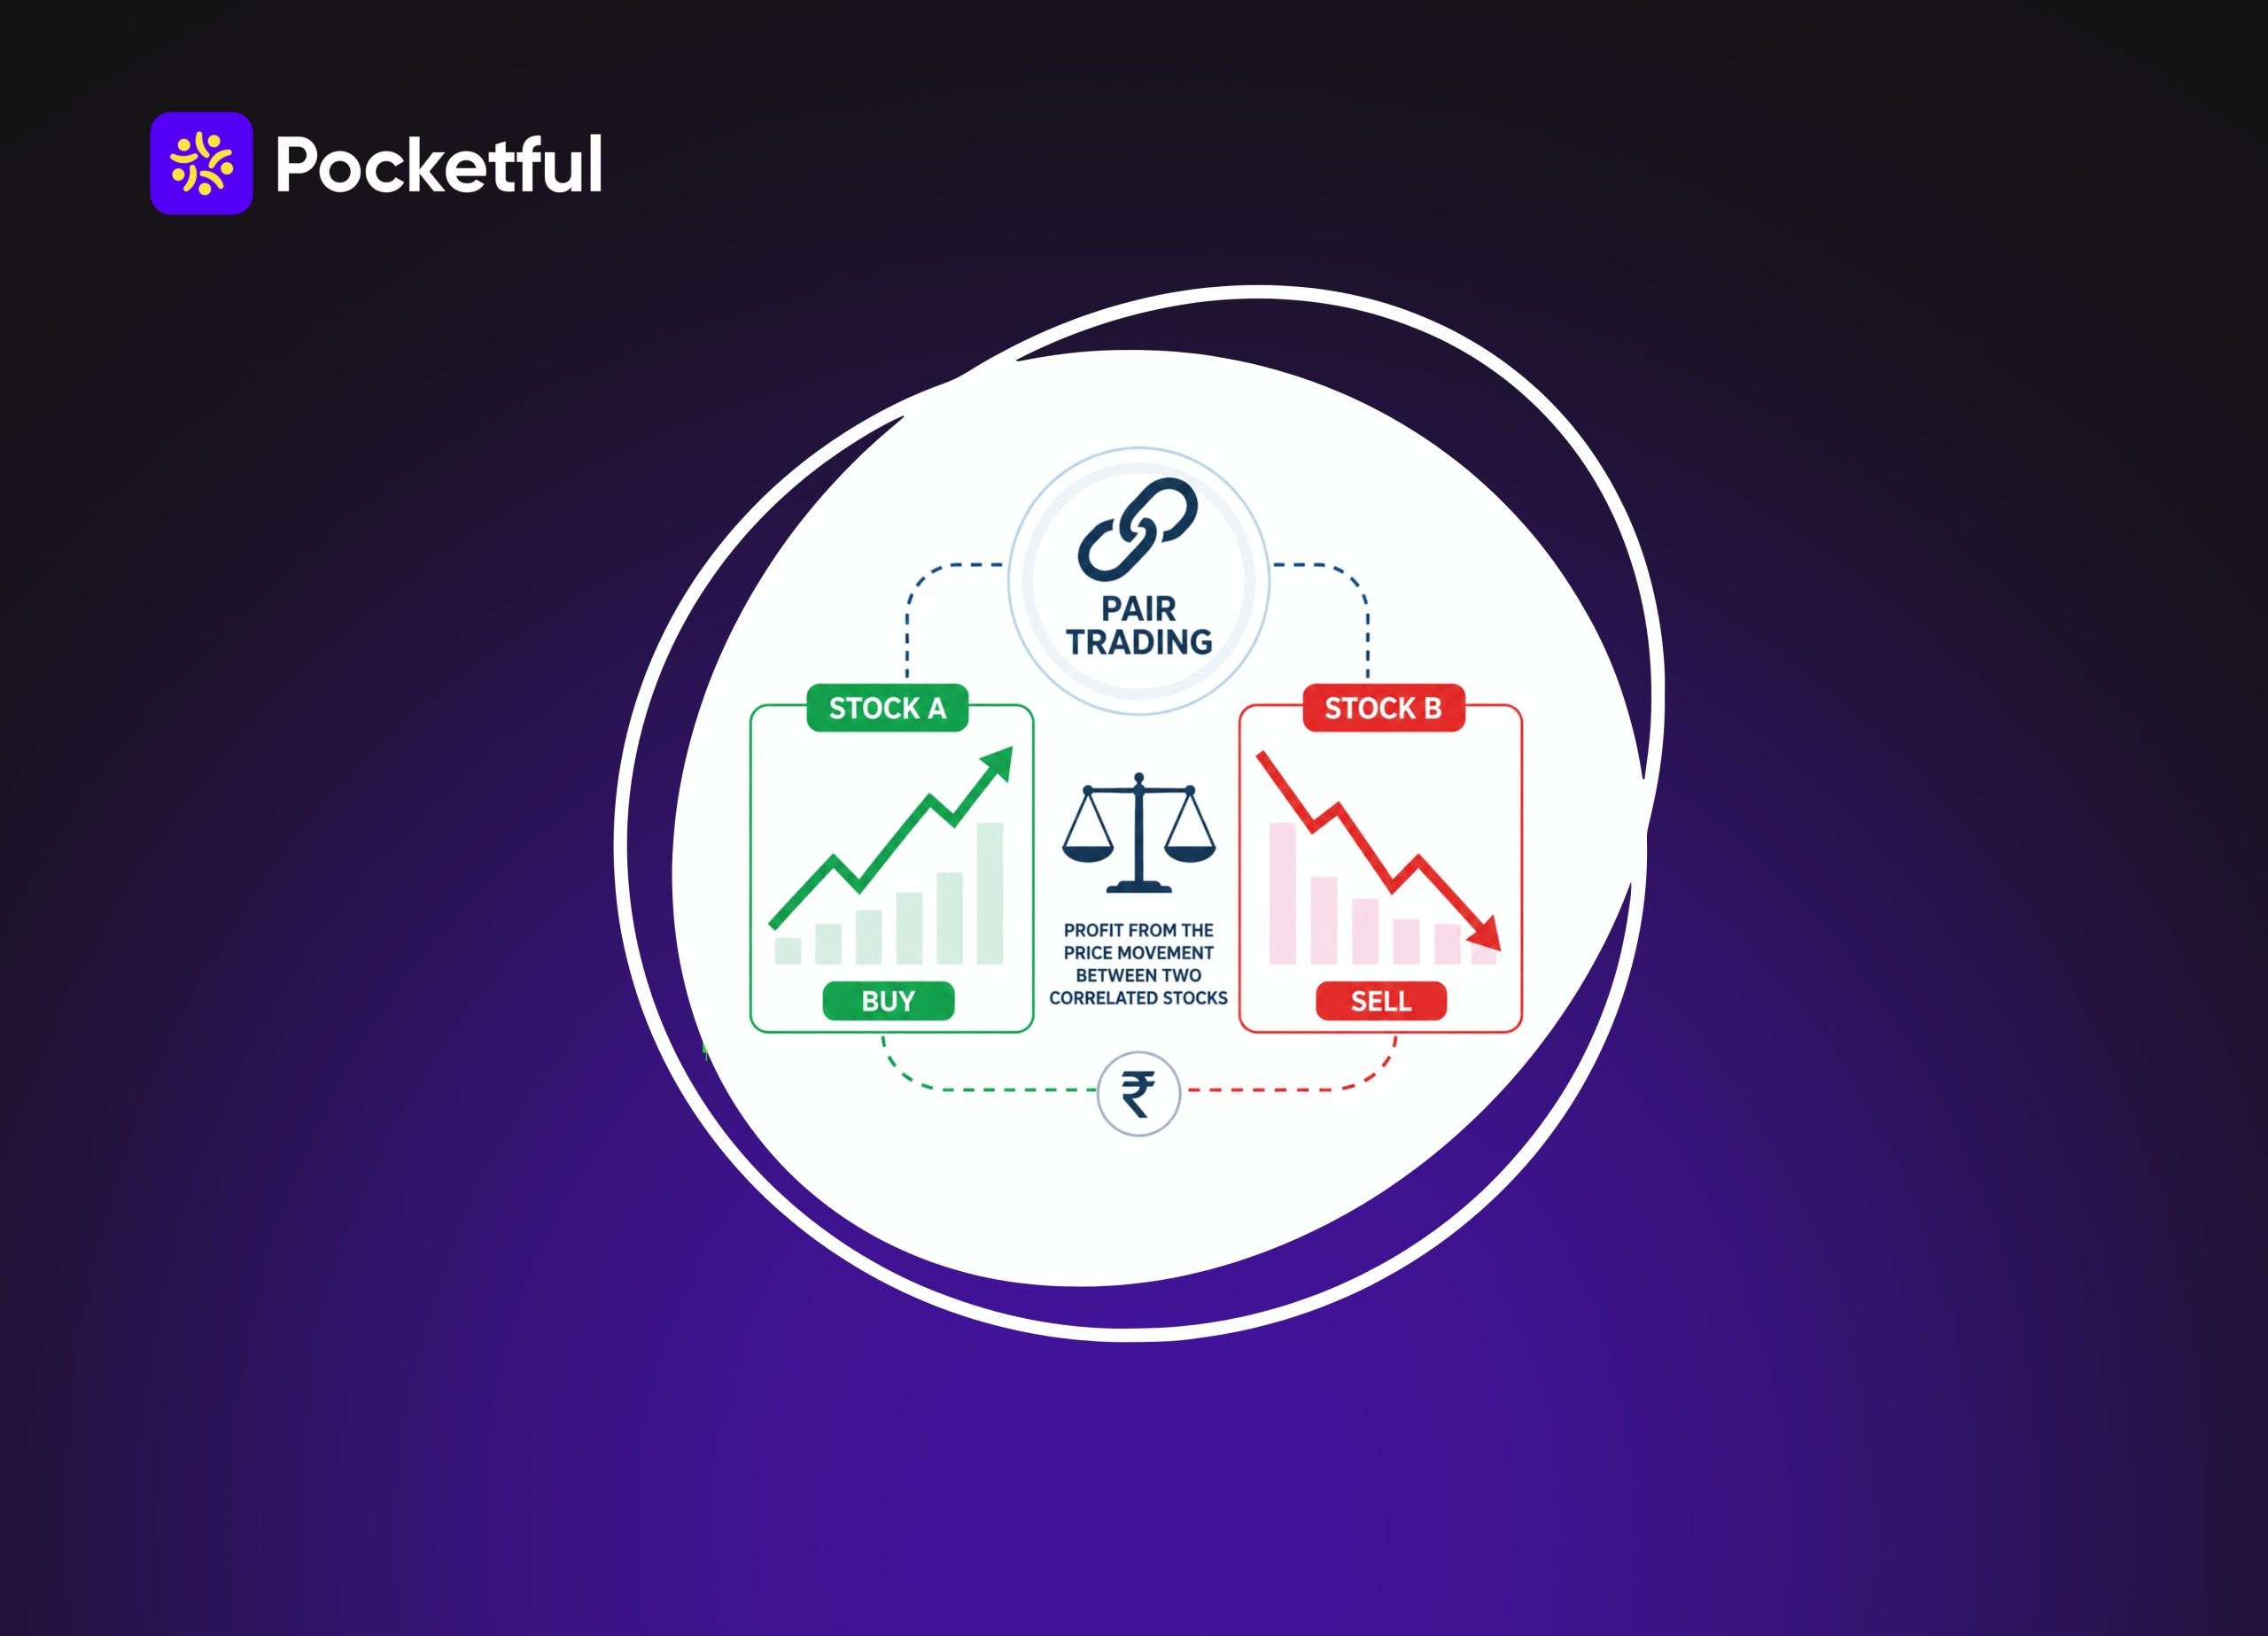
              1What is Pair Trading?
              2Kelly Criterion for Stock Trading
              3What is Quoted Price in Commodity Trading?
              4What is Speculative Trading in Stock Market?
              51 Minute Scalping Strategy: Best Setup & Indicators

              Frequently Asked Questions (FAQs)

              1. What does averaging up in stocks mean?

                Averaging up in stocks means purchasing additional shares of a company at a higher price than your previous purchase price. It increases the average buying price and purchase cost.

              2. When should you consider averaging up the stock?

                One should consider averaging up the stock only when the company has stable profits, its performance remains strong, and it has a favourable valuation, etc.

              3. What are the common mistakes that an investor makes while averaging up?

                Common mistakes an investor makes when averaging up a stock include ignoring valuation, making a purchase out of fear of missing out, and overlooking financial performance.

              4. What will happen to my profit if I average up the stocks of my portfolio?

                Whenever you consider averaging up the stocks of your portfolio and buy more shares at a higher price, your purchase cost will increase. This eventually changes your existing profit percentage; however, if the stock continues to rise, the additional shares can increase your total profit in rupee terms.

              5. What is the difference between averaging up and averaging down in stocks?

                In averaging down, you purchase an additional quantity of shares when the prices of shares fall below your average purchase price. Whereas, in averaging up, you buy additional shares at a higher price than your earlier purchase.

          1. Roles and Functions of an Authorised Person

            Roles and Functions of an Authorised Person

            The financial markets offer vast opportunities for long-term wealth creation. Navigating this dynamic space requires reliable support and clear guidance. Many investors look for local experts to simplify the trading process and provide accessible services. 

            The gap between large broking houses and everyday retail investors are bridged by specialized intermediaries. A crucial role in expanding financial inclusion across the country are played by these professionals. Smooth transactions is ensured by them. Individuals are helped so informed investment choices can be made with absolute confidence and ease. 

            Who is authorised person

            To participate in the financial markets, individuals cannot execute trades directly on a national exchange. They must route their investments through a registered stockbroker. However, major broking firms cannot maintain physical branches in every neighborhood. Therefore, they appoint local intermediaries to act on their behalf and serve regional clients.

            Understanding the definition is simple when looking at an authorised person in stock market. This entity is an individual or business approved by a stock exchange to provide trading services locally. They operate strictly under the brand name of the appointing stockbroker.

            Previously, these financial intermediaries were widely known as sub brokers. In 2018, the regulatory authorities officially discontinued the sub broker category. Today, the industry exclusively uses the updated term for these registered partners.

            These intermediaries provide an accessible entry point for beginners. They do not charge clients directly for their assistance. Instead, they earn a shared commission from the brokerage fees collected by the main stockbroker.

            Eligibility and Registration of authorised person

            Becoming a registered intermediary requires meeting specific criteria set by the exchanges. An applicant must be a citizen of India and at least 18 years old. The basic educational requirement is passing the 10th standard. Having a basic understanding of the financial markets is also highly recommended.

            Additionally, applicants must have a clean legal record with no history of financial fraud. Certain brokers also require the applicant to hold a valid certification. The NISM Series VIII for Equity Derivatives is often mandatory for specific trading segments. These rules ensure that only capable individuals handle investor portfolios.

            Roles of an authorized person

            The duties of an authorized person cover various aspects of the trading ecosystem. Their responsibilities can be categorized from three different perspectives.

            Perspective of the Stock Exchange

            Even though these individuals are not direct exchange members, they contribute heavily to market growth. The exchange relies on them to maintain a secure trading environment.

            • Expanding Market Reach: The primary function regarding the exchange is to maximize the volume of deals in a specific local area. By bringing in more retail participants, they increase overall market liquidity.
            • Operating Under Franchise: They obtain a franchise from a registered stockbroker to offer services. This setup allows them to use official trading platforms securely.
            • Maintaining Market Integrity: They act as important gatekeepers for the financial system. Their role involves preventing investors from submitting incorrect or fraudulent documents.
            • Promoting Investor Awareness: They organize local seminars to educate the public. This directly supports the exchange’s goal of creating a financially literate population.

            Perspective of the Stockbroker

            Stockbrokers depend heavily on these local partners to scale their operations. The relationship is a mutually beneficial partnership built on trust and shared technology.

            • Business Development: The most important role is to expand the client base for the stockbroker. They find new investors interested in financial markets and connect them to the broker.
            • Assisting with Documentation: They help the broker by managing necessary paperwork and compliance. This includes indexing documents and replacing files marked as incomplete.
            • Client Retention: Finding new clients is only one part of the business. These partners ensure existing clients remain active by helping them reinvest their funds.
            • Ensuring Compliance: They strictly follow the internal policies of the broker. They ensure all local operations meet the regulatory guidelines set by the authorities.

            Perspective of the Client

            For a retail investor, this local partner is often the friendly face of the stock market. They provide personalized support that large corporate brokers might not offer directly.

            • Facilitating Investments: They assist clients in opening demat and trading accounts quickly. They guide investors through the complex Know Your Customer verification process.
            • Offering Market Suggestions: They share valuable market news, research reports, and trading insights. This helps investors understand market trends and make confident choices.
            • Providing Operational Support: Many beginners struggle with modern trading applications. The local partner teaches clients how to use digital platforms and resolves technical issues.
            • Relationship Management: They maintain continuous contact with their clients. They send newsletters, explain new investment products, and provide after sales service.

            Read Also: Stock Broker vs Sub-Broker: Key Differences

            Regulatory Guidelines and Restrictions

            Operating as a financial intermediary requires strict adherence to regulatory rules. The authorities have established clear boundaries to protect retail investors. This creates a safe ecosystem for wealth generation.

            Intermediaries are strictly prohibited from receiving or paying any money in their own name. All financial transactions must occur directly between the client’s bank account and the stockbroker. This rule prevents the mismanagement of investor funds.

            Furthermore, they cannot issue official documents like contract notes or statements. Only the registered stockbroker has the authority to issue these legal documents. The local partner must also prominently display the broker’s registration details at their office.

            Conclusion

            The structured partnership between brokers and local intermediaries is a cornerstone of the financial ecosystem. This model ensures that individuals from all regions receive adequate attention and professional support. By acting as a dependable bridge, these professionals empower retail participants to navigate the markets safely. They simplify complex procedures and offer timely guidance to the public. Ultimately, this collaborative approach supports the robust and inclusive growth of the broader capital markets. Become an Authorised Person with Pocketful and unlock greater earning potential with the right support and tools to grow your business. 

            S.NO.Check Out These Interesting Posts You Might Enjoy!
            1Authorised person agreement describing rights and benefits
            2Can an Authorised Person Trade for Himself?
            3Remisier vs Authorized Person (AP): Key Differences
            4SEBI Rules for Authorised Person Registration
            5Authorised Person Vs Franchise: What’s the Difference?
            6How to Become a Sub Broker in India

            Frequently Asked Questions (FAQs)

            1. What is the meaning of an authorised person?

              They are individuals or entities appointed by registered stockbrokers to provide clients with safe access to official trading platforms.

            2. What are the benefits of authorised person services?

              They provide personalized support, local guidance, and physical help with account opening, making investing much simpler for beginners.

            3. How to use their services for investing?

              Investors can approach them to quickly open a trading account, learn how to use trading applications, and receive regular market updates.

            4. Can they collect cash directly from investors?

              No. Financial regulations strictly mandate that all funds and securities must go directly into the official stockbroker’s bank account.

            5. Are these professionals regulated by authorities?

              Yes. They operate under the strict rules of the stock exchange and are constantly monitored by their appointing stockbroker

          2. What Is an After Market Order (AMO)? Meaning, Timing & How It Works

            What Is an After Market Order (AMO)? Meaning, Timing & How It Works

            Markets shut at a fixed time every day, but decisions to buy or sell a stock don’t stop just because the exchange closed. An after market order lets you place that decision anyway, queued and ready to fire the moment trading resumes. This guide covers exactly what an AMO is, how the timing and execution actually work, and the specific status messages you’ll see along the way.

            What Is an After Market Order?

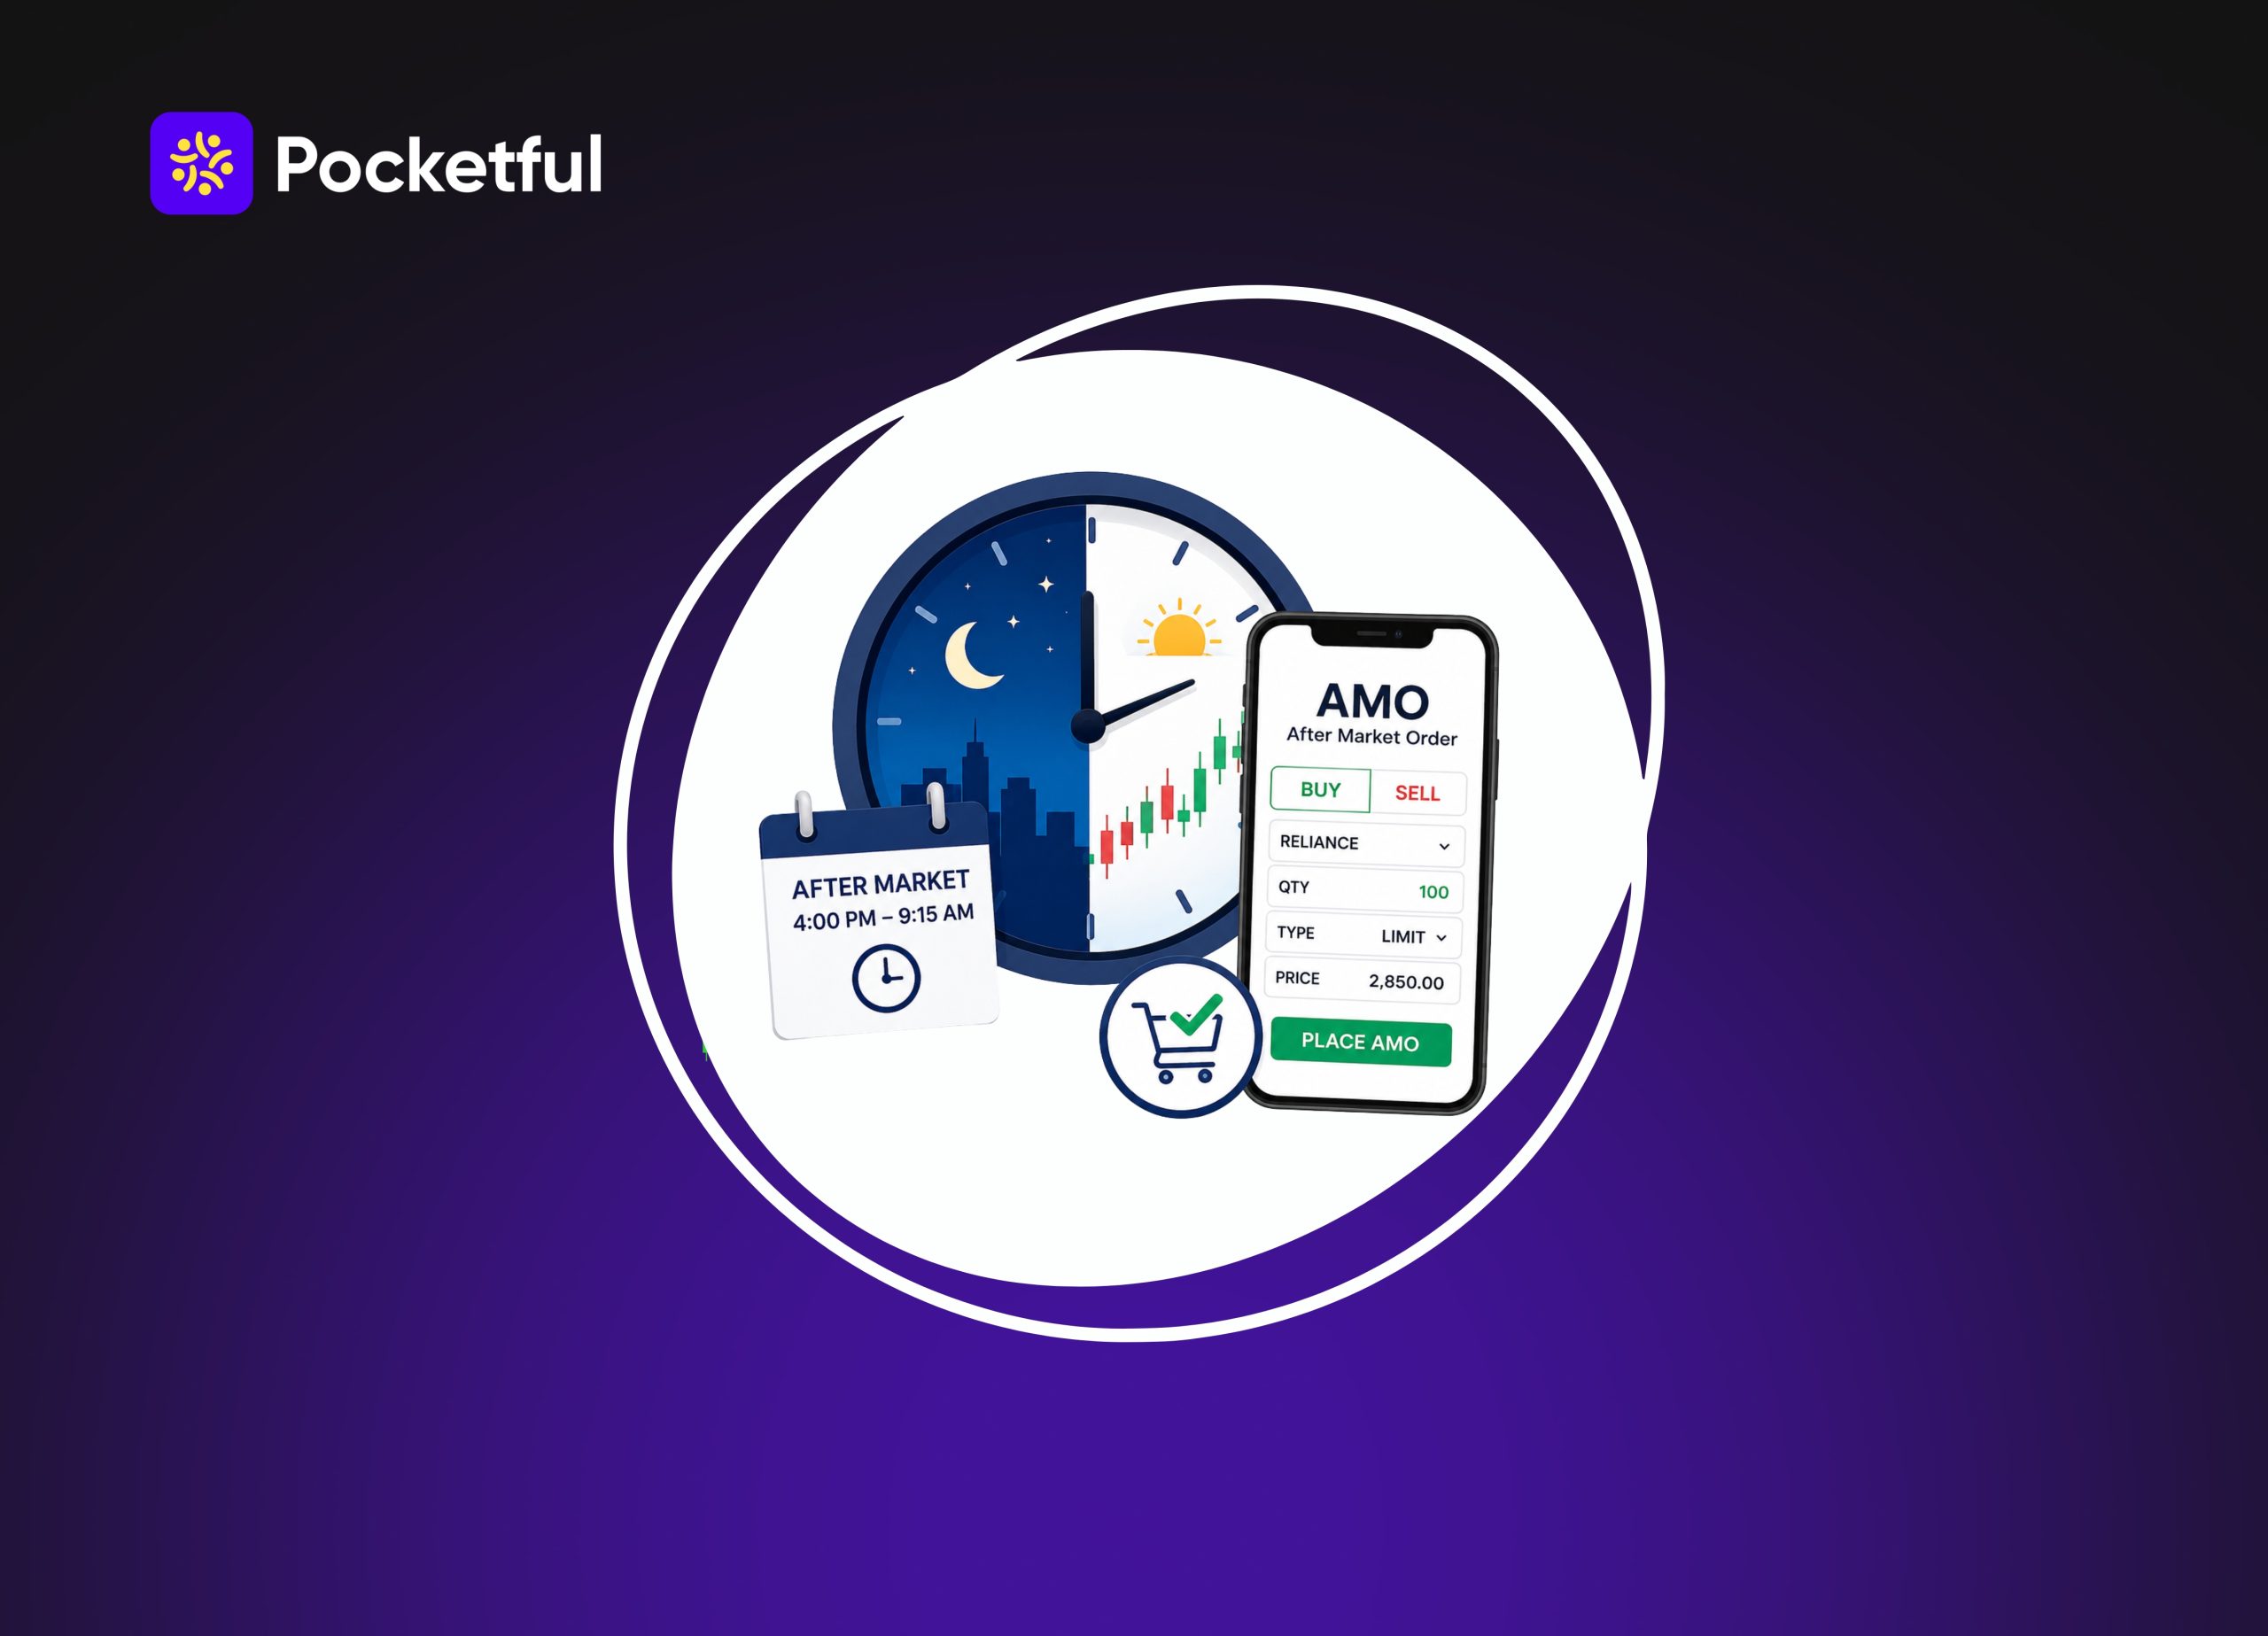
            AMO full form stands for After Market Order, an order placed once regular trading hours have ended, held by your broker, and executed either during the next pre-open session or once the market opens the following trading day.

            After market order functionality exists specifically for people who can’t watch the market in real time but still want to act on a decision made after hours, over the weekend, or during a trading holiday.

            AMO order means that an order for after-market execution is being placed and worked upon. Understanding that distinction upfront avoids the most common confusion beginners run into with this feature.

            How Does an AMO Actually Work?

            An After Market Order follows a simple process:

            1. Place the AMO: Enter your buy or sell order after regular market hours.
            2. Broker holds the order: The broker keeps your AMO in its system until orders can be sent to the exchange.
            3. Order reaches the exchange: The AMO is submitted to the exchange during the broker’s specified processing window on the next trading day.
            4. Order gets executed: A market order executes at the available market price. A limit order executes only if your specified price is available.
            5. Check the order status: If the conditions are not met, the order may remain pending or be cancelled based on its validity and exchange rules.

            Understanding the “AMO Req Received” Status

            After placing an order, most trading apps show a status message confirming what happened to it. AMO req received meaning, in plain terms, is simply confirmation that your broker’s system has successfully logged your after-market order and it’s now sitting in queue, waiting for the next trading session to begin.

            Seeing AMO req received does not mean your order has executed. It only confirms the order was accepted into the queue. The actual execution, or a rejection if something’s wrong with the order, happens separately once the pre-open or regular session starts. If you don’t see any status update after this stage by the time the market opens, that’s usually a sign to check your order book directly rather than assuming everything went through.

            AMO Timings by Segment

            Timings vary depending on which exchange and segment you’re placing an order in.

            SegmentAMO Window
            Equity (NSE & BSE)3:45 PM to 8:58 AM next day
            F&O3:45 PM to 9:10 AM next day
            Currency5:00 PM(or 3:45 PM to 8:59 AM next day depending on broker)
            MCX (Commodity)Available during regular market hours

            The pre-open session itself runs from 9:00 AM to 9:07 AM. Orders that match a price within that window execute there. Anything unmatched carries into the 9:15 AM market open.

            A Simple Example

            Say you decide at 4:00 PM, after the market has closed, that you want to buy 100 shares of a company at ₹50 per share. You place a limit AMO at that price. The order sits with your broker overnight. The next morning, if a matching price of ₹50 appears during the 9:00 to 9:07 AM pre-open window, your order executes right there. If it doesn’t match during that window, it carries forward and executes at the 9:15 AM open instead, at whatever price becomes available.

            Read Also: What is Overnight Trading?

            Benefits of Using AMO

            If you are a trader in the market, then here are a few things that you should know about using the AMO in terms of the benefits. 

            • Trade Without Watching the Market Live: You can place an order in the evening, over a weekend, or on a holiday, without needing to be online the moment the market opens.
            • Modify Orders After Placing Them: An AMO isn’t locked in the moment you submit it. You can typically revise the price or quantity any time before it executes.
            • Works Across Multiple Segments: Equity, F&O, currency, and commodities all support AMO placement, so it’s not limited to plain stock purchases.
            • Available Even on Non-Trading Days: You can queue an AMO on a weekend or a market holiday, and it simply waits until the next actual trading session to process.

            Limitations and Risks of AMO

            While using AMO is pretty simple, there are certain limitations that you should know of. The following are the risks to take care of:

            • Liquidity Can Be Thin at Execution: Lower trading volume during the pre-open window can make it harder to get your full order filled exactly as placed.
            • Overnight News Can Move the Price: A significant announcement after you place your AMO can shift the stock’s price sharply by the time your order actually executes, sometimes to a level you wouldn’t have chosen in real time.
            • Certain Order Types Aren’t Supported: Bracket, cover, and stop-loss orders cannot be placed as an AMO, limiting your options compared to trading during live market hours.
            • Rejection Risk Is Higher Than Regular Orders: Volatility and thinner liquidity outside normal hours raise the chance of an order failing to execute as intended.

            Common Reasons AMO Orders Get Rejected

            • Insufficient Funds or Securities: Your account needs enough margin to buy, or enough shares available to sell, at the time the order is actually processed, not just when you placed it.
            • Price Outside the Allowed Range: If the opening price doesn’t reach your specified limit, or falls outside a broker-imposed range for AMO orders, the order won’t execute.
            • Market Orders Disallowed on Certain Instruments: Brokers or exchanges sometimes block market-type AMOs on illiquid stocks or index options to prevent extreme price swings.
            • Stock Under Surveillance or F&O Ban: Orders on stocks currently under exchange surveillance, or in an F&O ban period, can get rejected outright.
            • Technical or Timing Errors: Placing an AMO during a scheduled system maintenance window, entering a quantity that doesn’t match the lot size, or hitting a broker-specific restriction can all cause rejection.

            AMO vs Other Order Types

            Order TypeKey Difference From AMO
            Regular Market OrderPlaced and executed during live market hours, with typically better liquidity
            Good Till Triggered (GTT)Stays valid for up to a year and can be placed anytime, but only executes during market hours, unlike an AMO which is valid for a single session
            One-Cancels-Other (OCO)Involves two linked legs where one cancels the other on trigger, a structure not available within an AMO

            Who Should Use an AMO

            AMOs suit investors and traders who can’t monitor the market constantly during live hours but still want their orders ready the moment trading resumes. They’re less useful for intraday traders or scalpers, who need to react to price movement in real time rather than queuing a decision made the night before.

            Best Practices Before Placing an AMO

            While there are no key guidelines of the right things, following some simple steps can ensure that you end up in proper usage of AMO.

            • Check Price Charts and News Beforehand: Review recent price action and any pending news that could affect the stock overnight before setting your price.
            • Set a Realistic Limit Price: A limit set too far from the likely opening price may simply never execute, while one too close to the current price increases the odds of a fill you’re comfortable with.
            • Confirm Execution the Next Morning: Check your order book once the market opens to confirm whether your AMO actually executed, rather than assuming it went through automatically.

            Read Also: Pre-Open Market Session in India

            Final Thoughts

            An after market order is a genuinely useful tool once you understand its mechanics: it queues your decision, not your execution, and the price you get depends on what happens during the next pre-open or market-open session, not the moment you placed the order. 

            Know your segment’s specific timing window, stick to limit and market order types since that’s all AMO supports, and always confirm execution status the next morning rather than assuming it went through. Pocketful supports AMO placement across equity and F&O with the same app you use for live trading, so queuing an order after hours takes no extra steps.

            S.NO.Check Out These Interesting Posts You Might Enjoy!
            120 Things to Know Before the Stock Market Opens
            2What Is the Turtle Trading Strategy?
            35 points to be considered before buying or selling any stocks
            4What Is Day Trading and How to Start With It?
            5What is a good rule for investing in stocks?

            Frequently Asked Questions (FAQs)

            1. What does AMO full form stand for?

              AMO stands for After Market Order. It is an order placed after regular trading hours that gets executed during the next pre-open session or market open.

            2. What does “AMO Req Received” mean after I place an order?

              It confirms your broker has accepted your after-market order into its queue. It does not mean the order has executed yet, execution happens separately once the next trading session begins.

            3. Can I place a stop-loss order as an AMO? 

              No. Only limit and market order types are supported for AMO placement. Bracket, cover, and stop-loss orders cannot be queued as after market orders.

            4. What happens if my AMO price isn’t matched during pre-open? 

              It carries forward automatically and gets executed during the regular market open at 9:15 AM, at whatever price is available then, unless it fails to match your limit price entirely.

            5. Can I modify or cancel an AMO after placing it? 

              Yes, most brokers allow you to modify the price or quantity, or cancel the order entirely, any time before it actually executes the next trading session.

          3. What is Market Sentiment – How to Analyse It?

            What is Market Sentiment – How to Analyse It?

            Ever look at a stock that takes a nose dive after an announcement that should have sent it soaring? Or barely even flinches when bad news comes out? Odds are it’s not the market acting crazy, it’s market sentiment running the show, and a lot of the time it’s what’s really driving the price action, even if the balance sheet looks pretty solid. Here’s what it’s all about, and how you can get a read on it, rather than just winging it.

            Market Sentiment Meaning

            So, what does market sentiment really mean? Well, it’s just the overall vibe of the investors who are watching a particular stock, sector, or the market as a whole. Are they feeling optimistic and keen on buying? Or on edge and ready to bail? Their emotions can end up playing a far bigger role in buying and selling than most people are willing to admit. Getting the market sentiment meaning right from the start makes everything else in this guide easier to follow.

            I like to think of it as the market’s mood ring. Optimism pulls in buyers. Fear pushes people toward the exits. And when you scale that across millions of traders acting more or less at once, you get the swings we see on the ticker every day.

            Here’s the part that trips people up, sentiment and reality often don’t line up. A firm can beat earnings estimates and still watch its share price fall, purely because traders had priced in something even rosier. That gap between what’s true and what people believe is why sentiment gets studied at all.

            What Is Market Sentiment, Beyond the Definition?

            Ask ten traders what market sentiment is, and get some version of “vibes,” which isn’t wrong, honestly. If you’re still wondering what market sentiment is in practical terms, it’s a blend of psychology, headlines, and plain old herd instinct.

            Broadly, sentiment sits in one of three zones:

            • Bullish– the crowd expects prices to climb, and buying pressure takes over.
            • Bearish– the mood turns sour, and selling dominates. 
            • Neutral– nobody’s convinced either way, and volumes tend to dry up.  

            This is different from fundamental analysis, which digs into earnings, debt, and cash flow. Sentiment doesn’t care much about the spreadsheet, it cares about how people are reacting to it. Two analysts can stare at the same quarterly report and come away with opposite conclusions. That’s sentiment showing up in real time.

            Why It Matters More Than People Give It Credit For

            It’s tempting to assume prices move purely on facts. They don’t, not in the short run anyway. Emotion drives a huge chunk of daily trading.

            Take what happened in July 2026. India VIX, the volatility gauge that everyone calls the markets “fear index” jumped 30% in one day on 8 July after tensions rose around the Strait of Hormuz and crude oil prices went up. The Sensex fell 1,700 points that day. The Nifty dropped more than 500. And none of that had anything to do with a sudden change in company earnings, it was fear, plain and simple.

            A few weeks later, once tensions cooled off, VIX drifted back toward the 12,13 range and both indices clawed their losses back. That whiplash, in barely three weeks, tells you everything about why mood matters just as much as math when you’re managing money.

            Tools People Use for Stock Market Sentiment

            Reading stock market sentiment isn’t some mystical skill, there are concrete indicators, and most of them are free to check.

            1. India VIX

            VIX estimates how much volatility traders expect over the next month, calculated from Nifty options pricing. Rising VIX generally means fear is creeping in. Falling VIX suggests calmer nerves.

            Through July 2026 India VIX has mostly stayed between 12 and 14 far from its 52-week high of almost 29 that happened earlier in the year. That range shows a market that’s careful not scared.

            2. Put-Call Ratio

            This compares how many put options are being traded against calls.

            Above 1 usually leans bearish, traders are buying puts to hedge against a drop. Below 1 usually leans bullish, more people are betting on calls.

            Desks track this daily, particularly around index options, to get a read on short-term positioning.

            3. Advance-Decline Ratio

            There is nothing complicated here; it just looks at how many stocks went up compared to how many went down on a particular day. A good advance-decline number over a week or two shows that the rise (or fall) is wide, not a few big stocks moving the index.

            4. Fear and Greed Index

            This one blends several inputs- momentum, volatility, safe-haven demand into a single score from 0 to 100. Zero means extreme fear, 100 means extreme greed. It won’t tell you tomorrow’s closing price, but it’s a decent gut check on where the crowd’s head is at.

            5. FII and DII Flows

            Institutional money moves markets in a way retail trades rarely can. When foreign institutional investors keep pulling out, it usually signals global risk aversion. When domestic institutions step in and buy the dip, it often means local confidence is holding up even while overseas sentiment wobbles.

            Read Also: How to use technical analysis on charts

            How to Actually Analyse Market Sentiment

            None of this needs to be complicated. Here’s roughly how I’d build the habit of tracking it.

            Check VIX like you’d check the weather. Make it part of your morning scan, right alongside index levels. A sharp spike, like the one on 8 July, is usually an early warning that something’s rattling the market.

            Glance at options data. PCR and open interest at key strikes tell you where traders expect resistance and support to form. Heavy call writing tends to cap a level; heavy put writing tends to hold it up.

            Follow the news, not just the headlines. Central bank decisions, inflation prints, geopolitical flare-ups, these move sentiment fast. India’s June 2026 CPI came in at 4.38%, and the US Fed’s policy meetings through July kept traders on edge for weeks.

            Watch what institutions are doing. FII and DII numbers get published daily. One day’s figure doesn’t mean much on its own, but a pattern across a week or two usually does.

            Pay attention to search and social trends. A sudden surge in people googling “market crash” or talking about stock market sentiment on social media is often a lagging, but still useful, signal of rising anxiety among everyday investors.

            Common Sentiment Indicators, Side by Side

            IndicatorWhat It Tells YouBullish SignalBearish Signal
            India VIXExpected volatilityFallingRising
            Put-Call RatioOptions positioningBelow 1Above 1
            Advance-Decline RatioMarket breadthMore advancesMore declines
            FII/DII FlowsInstitutional convictionNet buyingNet selling
            Fear & Greed IndexComposite crowd moodAbove 50Below 50

            A Recent Case Worth Studying

            Here’s how stock market sentiment analysis actually played out over a few weeks, not in theory but in real numbers.

            On 3 July 2026, India VIX slipped below 12 for the first time since February, calm markets, easing Middle East tensions, low hedging demand. That calm didn’t survive the week. By 8 July, renewed friction between the US and Iran sent VIX spiking intraday to around 15, and both major indices fell sharply in a single session.

            Then, by late July, reports of a temporary ceasefire and softer crude prices brought VIX back down toward 12,13. The Sensex and Nifty both rebounded, with the Sensex gaining over 650 points in a single morning session on 29 July alone.

            Three weeks. Two full mood swings. Fundamentals barely budged the whole time, it was sentiment doing all the driving. This is exactly the kind of pattern that makes stock market sentiment analysis worth doing in the first place, rather than reacting to headlines after the fact.

            Sentiment Isn’t the Same as Fundamentals

            Lots of people get these two totally mixed up so it’s worth taking a moment to clear this up.

            Fundamentals: The Actual Worth

            When it comes to assessing a company’s value, folks often get caught up in two different things. There’s fundamental analysis. It’s a much more down to earth look at fundamentals whether that company is actually worth its current price. We’re talking about things like revenue growth, how much profit they’re making, how much debt they’re in, their projected earnings, and whether it all stacks up in terms of what the stock is selling for at the moment. That’s the simple fact of the matter,  is the company in good shape right now?

            But then there’s sentiment – and that’s a whole different animal. This is all about what people currently think of the company and their opinion of it. Think about it, when lots of people are feeling optimistic about a company, the price is likely to go up (and the opposite happens when people get bearish). So to illustrate, you might have a company with really solid fundamentals, but if investors are spooked, the price will still drop.

            We all know that market sentiment can be a powerful force, a single tweet or a news story can send stocks soaring or plummeting.

            It’s like a mass game of telephone, people get their information from who knows, where and then suddenly ‘this is what the market thinks’

            The thing is, that’s not what fundamentals say at all.

            They’re both working to their own rhythm. Fundamentals develop over the course of a quarter or even years. Sentiment can do a complete U-turn in the space of an afternoon, all it takes is a breaking news story or a false rumour to create a stir. Even a great company can get left behind for ages if the overall mood stays sour, and a mediocre company can shoot up in price purely due to all the hype around it.

            Experienced traders tend to take a more balanced approach, fundamentals help them decide what they’re looking to invest in, while sentiment helps them identify the right time to do so.

            Where This Falls Short

            Sentiment tracking isn’t a crystal ball, and treating it as one is a fast way to lose money.

            Signals can get noisy during low volume sessions or around holidays, when a handful of trades skew the data. Extreme fear sometimes marks a bottom, but not always, and calling that turn correctly is genuinely difficult even for professionals. It works best as a supplement to fundamental research, not a replacement for it. Short-term mood swings can run completely opposite to where the economy is actually heading long-term.

            Putting This Into Practice

            You don’t need to trade on sentiment alone to get value out of tracking it. A lot of long-term investors use it more as a sanity check than as a signal.

            If VIX is climbing fast alongside heavy selling, that might be a cue to review your holdings calmly rather than sell in a panic. If sentiment looks stretched with everyone euphoric and valuations high, it might be time to trim rather than chase.

            None of this is about calling every top and bottom. It’s about knowing the emotional weather your money is sitting in, so your own decisions stay a bit steadier than the crowd’s.

            Wrapping Up

            Short-term price moves owe a lot to market sentiment, sometimes more than they owe to a company’s actual numbers. Keeping an eye on India VIX, the put-call ratio, and institutional flows gives you a genuinely useful read on stock market sentiment analysis, without relying on hunches. Pair that with solid fundamental homework, and you’ll navigate the market’s mood swings with a lot more confidence than most. At the end of the day, understanding stock market sentiment isn’t about predicting every move; it’s about not being blindsided by one. Unlock stock insights with Pocketful. Download now and explore technical sentiment for any stock. 

            S.NO.Check Out These Interesting Posts You Might Enjoy!
            1Intraday Trading Rules and New SEBI Regulations
            2Breakout Trading: Definition, Pros, And Cons
            35 points to be considered before buying or selling any stocks
            4What Is Day Trading and How to Start With It?
            5What is a good rule for investing in stocks?

            Frequently Asked Questions (FAQs)

            1. What is market sentiment?

              Market sentiment is the general mood of investors towards a certain stock or market in total, being either bullish or bearish.

            2. What is the difference between market sentiment and market fundamentals?

              Fundamentals rely on quantitative indicators such as earnings, income and economic indices. Sentiment relies on psychological factors and investors’ feelings that can make prices go up or down regardless of the real figures.

            3. What indicators are most often used to measure the market sentiment?

              These may be the Volatility Index, put and call ratio, Fear & Greed Index, moving averages, and AAII Investor Sentiment Survey.

            4. Is it possible to predict price movements through market sentiment?

              No, with certainty, but it gives signals about the likely reversal. High levels of fear usually indicate that prices will go up soon, high levels of greed – that there will be a decline.

            5. How does news affect the market sentiment?

              News and announcements can shift sentiment rapidly, sometimes causing price reactions disproportionate to the actual financial impact of the news.

            6. How do traders use sentiment analysis in their strategy?

              Traders often use it as a contrarian indicator (betting against extreme sentiment) or to confirm trends alongside technical and fundamental analysis.

          4. Mutual Fund Churning: Meaning, Causes, Risks & How to Avoid

            Mutual Fund Churning: Meaning, Causes, Risks & How to Avoid

            Many investors frequently switch funds in hopes of better returns. While making changes when necessary can be appropriate, constant buying and selling without a solid reason can lead to “mutual fund churning,” which may adversely affect the investment strategy. In this blog, we will explore what churning is, how it happens, and how to avoid it. SEBI also advises aligning investments with one’s financial goals and risk appetite.

            What Is Mutual Fund Churning? 

            Mutual fund churning refers to the excessive or unjustified frequent buying, selling, or switching of mutual fund investments. This can manifest as an investor constantly moving money between different schemes. Meanwhile, the buying and selling of securities within a fund is measured by the Portfolio Turnover Ratio (PTR). According to SEBI, high portfolio turnover can lead to increased brokerage and other transaction costs.

            Understand Mutual Fund Churning Simply

            Suppose an investor invests in an equity mutual fund. A few months later, they switched to another fund solely because of its better recent returns. Then, when the next fund performs well, they switch again. If these changes occur repeatedly without a clear investment-related reason, it can be considered unnecessary churning.

            SituationGeneral changesPotential Churning
            Reason for changing the fundActual change in goal or strategySwitching based solely on recent returns.
            Decision-making processAfter careful reviewRepeatedly and in haste
            Portfolio activityAs neededExcessive transactions
            Investor focusLong-term investment planShort-term performance

            Types of Mutual Fund Churning 

            Mutual fund churning can occur primarily at two levels: the fund portfolio level and the investor level. While both involve a high volume of transactions, the nature of these transactions differs.

            1. Portfolio-Level Churning

            At this level, the fund manager buys and sells shares or other securities within the scheme’s portfolio. High portfolio turnover can be normal for certain funds due to their investment strategies; therefore, high trading activity alone does not necessarily imply improper practice.

            2. Investor-Level Churning

            This occurs when the investor frequently switches funds or redeems investments across different mutual fund schemes. When such changes are made without regard to investment goals, risk profiles, or other valid reasons, it can amount to unnecessary churning.

            3. Not Every Fund Change Constitutes Churning

            Modifying your portfolio is appropriate if your financial needs, goals, or risk appetite have changed. SEBI also advises investors to align their investments with their objectives and risk appetite, and to periodically review their financial goals.

            How Does Mutual Fund Churning Work? 

            Mutual fund churning occurs when an investor repeatedly switches funds without a valid reason. This process typically unfolds as follows

            Step 1: Investing in a Mutual Fund

            An investor puts money into a mutual fund with a specific goal in mind or in anticipation of better returns.

            Step 2: A Short-Term Trigger Occurs

            After some time, the fund’s performance appears to dip, the market falls, or another fund seems to offer better returns. This is where the idea of ​​switching arises.

            Step 3: The Fund is Redeemed or Switched

            The investor withdraws money from the current fund or switches it to invest in a different scheme. According to SEBI regulations, a ‘switch-out’ is treated as a redemption, while a ‘switch-in’ is treated as a purchase.

            Step 4: A New Fund is Selected

            Often, the new fund is chosen based on its recent performance or ranking, without verifying whether it is truly better suited to the investor’s investment goals.

            Step 5: The Process Repeats

            After a while, the new fund may fail to perform as expected, or a third fund might appear more attractive. Another switch occurs, and this cycle of repeated activity can turn into mutual fund churning.

            Read Also: Top Reasons Why Mutual Funds Are Going Down

            What Is Portfolio Turnover Ratio in Mutual Funds? 

            The Portfolio Turnover Ratio (PTR) indicates how frequently securities within a mutual fund’s portfolio are bought and sold over a specific period. It helps in understanding the fund’s trading activity. SEBI mandates the disclosure of PTR for equity-oriented schemes.

            Understanding the Portfolio Turnover Ratio in simple terms

            A high PTR generally implies significant buying and selling activity within the portfolio, whereas a low PTR may indicate relatively fewer changes. However, a fund cannot be judged as good or bad based solely on its PTR.

            Is a high PTR always bad?

            No. In some actively managed funds, the fund manager may make significant changes to the portfolio based on investment opportunities or shifting market conditions. On the other hand, trading in index funds is primarily driven by changes in the index or fund flows. Therefore, it is important to evaluate the PTR in the context of the fund’s strategy.

            Fund TypeHow to understand PTR
            Index FundGenerally, limited changes to the portfolio may occur, such as those resulting from index adjustments.
            Active Equity FundThe PTR can be higher due to stock selection.
            Long-Term Strategy FundIt is important to understand the fund’s strategy when the Portfolio Turnover Ratio (PTR) is very high.
            Debt FundChanges may occur due to maturity, interest rate, and credit strategy.
            Tactical FundIncreased trading could be part of the fund’s stated strategy.

            Mutual Fund Churning vs Normal Portfolio Rebalancing 

            Both involve changes to the investment portfolio; however, ‘mutual fund churning’ often entails changes made without a valid reason, whereas portfolio rebalancing is undertaken to maintain a defined investment strategy.

            BaseMutual Fund ChurningNormal Portfolio Rebalancing
            Main ObjectiveFrequent fund changes, often without apparent needRebalancing the portfolio according to the defined asset allocation.
            Basis of the decisionRecent returns, market noise, or emotional reactions.Investment goals, risk level, and asset allocation
            Method of changeFrequent and unplannedAs per need or scheduled review.
            When is it done?If another fund looks betterWhen the portfolio allocation changes from the prescribed limit
            Impact on investment strategyThe long-term plan may change repeatedly.It helps maintain the original investment plan.

            Why Does Mutual Fund Churning Happen? 

            There can be several reasons for mutual fund churning, but it often stems from frequently changing investment decisions without having complete information.

            • Impact of Fund Rankings: Investors might immediately switch to a fund that appears to be performing better based on new rankings, without realizing that rankings fluctuate over time.
            • Acting on Recommendations Without Verification: Sometimes, investors switch funds based on someone’s advice without considering whether the move is actually suitable for their portfolio.
            • Ease of Switching: Switching funds has become easy thanks to online platforms. However, this convenience can often lead to an excessive number of transactions.
            • Lack of Awareness Regarding Costs: Some investors fail to check factors like exit loads and tax implications before switching. Therefore, it is crucial to understand the total cost involved before making any changes.

            What Are the Effects of Mutual Fund Churning? 

            Frequent mutual fund churning can impact not only the volume of transactions but also the overall efficiency of the investment.

            • Additional Costs: Excessive buying and selling within the fund can drive up brokerage and other transaction costs, which may negatively affect returns.
            • Exit Load and Tax Impact: Some schemes may levy an exit load on redemptions made before a specified period. Additionally, switching funds may be treated as a redemption for tax purposes.
            • Impact on Compounding: Frequent withdrawals or changes in strategy prevent the investment from having sufficient time to grow over the long term.
            • Decisions made at the wrong time can be costly: Redeeming in haste can prevent an investor from benefiting from a market recovery or the fund’s future performance.

            Conclusion

            Changing mutual funds isn’t always wrong, but constantly switching solely based on seemingly better returns is not the right approach either. To avoid ‘mutual fund churning,’ investors should understand the reason behind any change before making it. The right decision is one that aligns with your investment goals and needs.

            S.NO.Check Out These Interesting Posts You Might Enjoy!
            1What is Trail Commission in Mutual Funds?
            2Best Silver Mutual Funds to invest in India
            3Best Brokers for Mutual Funds
            4Best Gold Investment Schemes in India
            5Best Money Market Mutual Funds in India

            Frequently Asked Questions (FAQs)

            1. What is Mutual Fund Churning?

              Mutual fund churning refers to the frequent buying, selling, or switching of mutual funds without a valid reason.

            2. Is switching mutual funds always bad?

              No; if your financial goals, risk profile, or the fund’s strategy have changed, switching might be the right move.

            3. What is Portfolio Turnover Ratio?

              It indicates how frequently the fund manager has bought and sold the securities within the portfolio over a specific period.

            4. Does a high Portfolio Turnover Ratio mean a bad fund?

              Not necessarily. Some actively managed funds may have a high PTR due to their specific investment strategy.

            5. Can Mutual Fund Churning affect returns?

              Yes; frequent transactions can increase costs and impact the investment plan.

          5. How to Reduce Risk in Options Trading: 10 Tips

            How to Reduce Risk in Options Trading: 10 Tips

            Options trading has become very popular among traders because of its profit potential. But there is another side of options trading that often gets ignored: loss. This is one of the trickiest parts of options trading because factors such as leverage, premium decay, volatility, etc. need to be evaluated before executing an option trade.

            In today’s blog post, we will give you an overview of the practical ways to reduce risks in options trading. 

            What is Option Trading?

            Option trading is a type of derivative trading in which a trader buys and sells option contracts based on underlying assets, including stocks, indices, commodities, etc. An option buyer gives them a right but not the obligation to buy or sell the underlying asset at a predetermined price, often known as the strike price, on or before a specific expiry date.

            Types of Options

            There are two types of options:

            1. Call Option: This option is generally used when a trader expects the price of the underlying asset to rise.
            2. Put Option: A put option is used when the trader expects the price of the underlying asset to fall.

            Moneyness of the Option

            There are three types of moneyness in options:

            • In-The-Money: This is an option that has an intrinsic value, and if anyone has to exercise the option at its strike price, it would have a positive value based on the current market price of the underlying asset.
            • At-The-Money: It refers to the option strike price which is the same as the current market price of the underlying asset. This option does not have any intrinsic value.
            • Out-of-the-Money: An out-of-the-money option does not have any intrinsic value; it is because the underlying asset has not moved enough in the expected direction. This option looks attractive to the new investor because of its low price but it carries high risk.

            Factors That Make Option Trading Risky

            The key factors that make option trading risky are as follows:

            1. Leverage: Leverage allows a trader to take large market exposure with a limited amount of capital. This can increase the return potential; however, it can also magnify the loss similarly.
            2. Time Decay: Options have a fixed expiry date, and as the date approaches, the time value of the option decreases, which is unfavourable for option traders.
            3. Volatility: Option prices are very sensitive to market volatility. Any significant fall in market volatility can reduce the option premium significantly and vice versa.
            4. Unlimited Loss: Options can also be sold by the traders, and they are known as option sellers. So when a trader sells any uncovered option, unfavourable movement can lead to significant loss.
            5. Overtrading: The weekly options encourage a trader to trade more frequently; this can lead to high brokerage charges and emotional trading.
            6. Risk Management: If a trader enters into an option trade without any proper risk management and position sizing, it can lead to higher losses than expected.

            How to Reduce Risks in Options Trading

            To reduce the risks in option trading, one can follow the steps mentioned below:

            1. Understand Option Trading: Before starting option trading, one is required to understand the key terminologies about the option market, such as strike price, premium, expiry, time value of money, etc.
            2. Small Trade: One of the easiest ways to control risk is to avoid putting too much capital into a single trade. It is advisable to start option trades with small positions.
            3. Use Stoploss: A stop-loss can help a trader protect their capital from unfavourable market conditions. The exit point is to decide the exit level beforehand instead of deciding it emotionally.
            4. Liquid Options: Liquidity is the key factor that one should consider before executing any trade. Liquid options allow one to execute a trade efficiently without making any delay. Also, it is advisable to avoid selecting an option simply because its premium looks cheaper.
            5. Avoid out-of-the-money options: The premiums of out-of-the-money options look cheaper and tempting; however, they require large movements in the underlying asset to be profitable.
            6. Time Decay: Options have an expiry date; their time value declines as the expiry approaches. This time value is known as theta or time decay. It is important for option buyers because if the underlying value of the asset moves in a favourable direction, there might be a slight or no movement in option premium.
            7. Implied Volatility: It is one of the key factors that an investor should consider before making any investment in an option trade. If the implied volatility increases, the option premiums become more expensive and vice versa.
            8. Hedging: One can also protect their loss in an option trade through various hedging strategies such as bull call spread, bear put spread, covered call, etc. However, it does not directly eliminate risk but only limits the loss.
            9. Avoid Emotional Trading: Options are highly volatile in nature, and it can lead to fear and greed. Emotional trades such as holding a losing position in the hope of recovering it can lead to significant loss.
            10. Avoid Unauthorised Tips: Various unregistered companies provide trading tips. They also promise huge returns from options trades along with guaranteed returns. One should avoid such tips and trade on their own. 

            Read Also: Risk Management In Trading: Meaning, Uses, and Strategies

            Who Can Trade in Options Trading

            Options trading is generally suitable for the following investors:

            1. Experienced Traders: Trading in options is generally suggested for traders who have vast experience of market movements. Along with this, option traders must have a better understanding of technical analysis along with risk management.
            2. Risk Management: Traders who do not trade on an emotional basis can consider option trading. They must be able to set position size, stop-losses, etc. before entering into a trade.
            3. Regular Monitoring: Option trading is suitable only for those investors who can regularly monitor their positions. Options nearing expiry can experience significant price movement.

            Conclusion

            On a concluding note, option trading is a great method to earn profit in the short run; however, not every trade ends in profit. Various factors that make options risky are leverage, time decay, volatility, etc. It is advisable to start with small positions and keep a strict stop-loss. There are various trading strategies that one should follow, such as a bull call spread, etc., allowing an investor to protect their position. At the end, it is advisable to take an option trade only after consulting your investment advisor and considering your risk profile.

            S.NO.Check Out These Interesting Posts You Might Enjoy!
            1Why Option Buyers Lose Money in Trading
            2Top Tips for Successful Margin Trading in India
            3Common Trading Mistakes Beginners Make (And How to Avoid Them)
            4Best Option Selling Strategy in India
            5Risk to Reward vs Accuracy: Which Matters More in Trading?

            Frequently Asked Questions (FAQs)

            1. Among options buying and options selling, which is less risky?

              When buying an option, the quantum of maximum loss is defined, which is equal to the premium paid at the time of buying it. While options selling is a type of uncovered selling, it can cause unlimited loss to a trader. However, option buying also carries certain risk, as the entire premium can be lost.

            2. What is position sizing in option trading?

              Position sizing means deciding the options contract you should take in a trade based on your trading capital and risk tolerance. It is important because option premiums can move very quickly. Through position sizing, one can stay in the trading game even when the trades go wrong.

            3. What is time decay in an options trade?

              Time decay refers to a gradual decrease in the value of an option as it approaches towards expiry date. In the world of option trading, it is known as “Theta”. As the trading day passes, the remaining time becomes shorter, and if the underlying asset does not move based on expectation, the option premium can lose its value.

            4. How to reduce risk while trading in options?

              There are various methods through which one can reduce risk in options, such as reducing their position size, keeping stop-losses, etc.

            5. What is hedging in options trading?

              Hedging is a method through which one can add another position to protect oneself from unfavourable market movements. This helps a trader limit their potential loss.

          6. What is Speculative Trading in Stock Market?

            What is Speculative Trading in Stock Market?

            Speculation in trading means buying or selling a financial asset to profit from expected price movements. Unlike investing, the focus is usually on short-term or medium-term changes in market prices.

            This is a strategy which offers you a great opportunity to make money, but also needs deep analysis. So, if you are wondering what is speculation in stock market, read this guide. Explore the answer and understand the details well.

            What Is Speculation in Stock Market?

            Speculation is the act of taking a market position based on an expected short-term price movement. The focus here is on understanding what might happen in the near future. In simple terms, speculation meaning is linked to predicting price movements. 

            A speculator buys or sells with one goal: profiting from where the price goes next, over hours, days, or weeks, using tools like leverage, options, and short selling to act on that view. 

            This is distinct from investing, where the decision rests on a company’s long-term earnings potential, and the position is expected to be held for years. Many people confuse this with hedging. So, now that you know what is speculative trading, let us find the difference.

            Speculation vs Hedging in the Stock Market

            Speculation and hedging often get treated as opposites, one reckless, the other responsible. That framing misses what actually happens in a market. A hedger is reducing risk they already have, a farmer locking in a future crop price, an exporter protecting against rupee depreciation, and an investor buying a put option to protect an existing stock holding. A speculator has no existing position to protect. They’re taking on new risks deliberately, betting on price direction with the expectation of profit.

            Here’s the part that surprises people: markets need both to function. A hedger needs someone willing to take the other side of their trade, and that’s almost always a speculator. Without speculators providing liquidity and absorbing that risk, hedging would be far more expensive and, in many markets, barely possible at all. Speculation isn’t the irresponsible cousin of hedging. It’s the mechanism that makes hedging work.

            FactorSpeculationHedging
            PurposeProfit from price movementProtect against existing risk
            Existing positionNot requiredUsually protecting one that exists
            Risk takenNew risk, deliberately assumedRisk reduction
            Who does itTraders, short-term participantsBusinesses, exporters, portfolio holders
            Market roleProvides liquidityTransfers risk to someone else

            Top 5 Traders Who Built Their Careers on Speculation

            If you are new to speculation trading in the stock market, then you must know about some of the top leaders in the field. Here are the ones that you should know of:

            1. Jesse Livermore

            Jesse Livermore was one of the earliest well-known stock market speculators. He traded mainly on price trends and market behaviour. He became particularly famous for short-selling stocks during the 1929 market crash, although his career also included major losses.

            2. George Soros

            George Soros became famous for betting. He did it against the British pound in 1992. He believed the UK could not maintain its position in the European Exchange Rate Mechanism. The trade reportedly earned his fund more than $1 billion.

            3. Paul Tudor Jones

            Paul Tudor Jones gained attention for anticipating the 1987 stock market crash. He positioned his portfolio to benefit from the decline. He used macroeconomic analysis, market trends, and careful risk management. All aimed to control potential losses.

            4. Ed Seykota

            Ed Seykota is known for using computer-based trend-following strategies. He used them in the 1970s. He used defined rules and focused on analysis for the trades. His approach showed how discipline and systematic decision-making. This is something that could be applied to speculative trading.

            5. Rakesh Jhunjhunwala

            Rakesh Jhunjhunwala is a well-known trader. He started investing with limited capital in the 1980s. He built substantial wealth over time. His approach included high-conviction market positions alongside long-term investments in selected Indian companies.

            What connects all five, despite very different styles, is that none of them were placing bets on hope. Each had a specific thesis, a way to test whether it was playing out, and a plan for what to do when it wasn’t.

            Types of Speculation Trading

            Understanding what is speculation is just the start. Speculators use several distinct approaches, each built around a different way of reading and acting on price movement. This is quite important to learn as well. These are:

            1. Day Trading

            Buying and selling within the same session to capture intraday price swings, with every position closed before the market shuts for the day.

            2. Swing Trading

            Holding positions for a few days to a few weeks, aiming to capture a medium-term price move rather than an intraday flicker.

            3. Options and Futures Trading

            Using derivative contracts to bet on price direction, with built-in leverage that magnifies both potential gains and potential losses relative to the capital deployed.

            4. Short Selling

            Borrowing shares, selling them at the current price, and buying them back later at a lower price, profiting from a decline rather than a rise.

            5. Margin Trading

            Borrowing funds from a broker to increase position size, scaling up both the potential return and the potential loss on a trade.

            6. Arbitrage

            Exploiting a price difference for the same asset across two markets, buying where it’s cheaper and selling where it’s priced higher, often within moments of each other.

            Managing Risk in Speculation Trading in the Stock Market

            A speculative position without a risk plan attached is closer to gambling than trading. A few disciplines separate the two.

            1. Set a Stop-Loss Before Entering

            Decide your exit point before you place the trade, not after it starts moving against you. A stop-loss set in the heat of a losing position tends to get moved further away rather than honoured.

            2. Size Positions Based on Total Capital

            Base your position size on a fixed percentage of your total trading capital, not on how confident you feel about a particular setup. Confidence is not a risk management tool.

            3. Track Your Risk-Reward Ratio on Every Trade

            Compare what you stand to lose against what you stand to gain before entering, and skip setups where the potential loss outweighs the potential gain, regardless of how strong your view feels.

            4. Diversify Across Uncorrelated Bets

            Avoid stacking multiple speculative positions that all depend on the same underlying event or trend, since one wrong call can otherwise wipe out several positions at once.

            5. Separate Speculative Capital From Long-Term Investments

            Keep the money you’re speculating with distinct from your long-term holdings, so a losing streak on one side never touches money earmarked for other goals.

            Things to Consider Before You Try Speculation Trading

            When you plan for speculation trading in the stock market, you must consider a few things. The key points that you should know are as follows:

            1. Your Actual Risk Appetite

            Set your plan well. Understand how much loss you can actually take and based on that plan the investment. Speculation should never involve money earmarked for essential expenses.

            2. How Much Time Can You Actually Commit

            Day trading and swing trading demand real-time attention during market hours. If you can’t watch positions closely, strategies requiring less constant monitoring, or simply avoiding speculation altogether, may suit you better.

            3. Whether You Understand the Instrument

            Options and futures carry mechanics, expiry, time decay, and margin calls, which a plain stock purchase doesn’t. Trade an instrument only once you understand exactly how it behaves, not after you’ve already taken a position in it.

            4. Your Plan for Losses, Not Just Wins

            Most people enter speculative trading plan for the upside and skip planning for a losing streak entirely. Decide in advance how many consecutive losses will make you step back and reassess, before you’re actually in that situation.

            Final Thoughts

            Speculation is a part of financial markets where traders take positions based on expected price movements. While this offers great opportunities, there are certain risks that you should be aware of. Knowing all these will help you to plan better and ensure that your trades end in a better position.

            So, if you are looking to explore the same, you need to have proper tools and a system in place. This is where you can open your trading account with Pocketful

            Frequently Asked Questions (FAQs)

            1. What is the main difference between speculation and hedging? 

              Hedging reduces risk on a position you already hold. The speculation involves taking on new risk deliberately in pursuit of profit. This is with no existing position being protected.

            2. Is speculation the same as gambling? 

              No. Speculation typically involves analysis, a specific market thesis, and defined risk management. But gambling relies on random chance. Poorly managed speculation can resemble gambling, but they aren’t the same by definition.

            3. What are the most common types of speculation in the stock market? 

              Day trading, swing trading, options and futures trading, short selling, margin trading, and arbitrage are the most common approaches. The choice is based on what you need and how much risk you can take.

            4. Can beginners try speculation trading safely? 

              Yes, with strict risk management. Beginners should start with small position sizes, use stop losses consistently, and avoid instruments like options or margin trading until they fully understand how they behave.

            5. Why do markets need speculators if hedging is the safer activity? 

              Speculators provide the liquidity that makes hedging possible in the first place, since someone needs to take the other side of a hedger’s trade. Without speculators, hedging would be considerably more expensive and harder to execute.

          7. Indian ADR Stocks: List of US-Listed Indian Companies & ADRs

            Indian ADR Stocks: List of US-Listed Indian Companies & ADRs

            The global financial market presents vast opportunities for domestic companies to reach international heights. Businesses scale across borders to get funding and attract global recognition. Investors looking beyond local boundaries often seek reliable instruments to diversify their portfolios and capture global economic growth.

            One highly effective mechanism bridges this geographical gap and connects domestic businesses with foreign capital. The framework creates a seamless investment channel for global participants. It provides an accessible route to participate in the success stories of prominent multinational corporations.

            What is an ADR?

            An American Depositary Receipt is a negotiable financial certificate issued by a United States bank. This certificate represents a specific number of shares in a foreign company. The instrument trades on major American stock exchanges exactly like regular domestic shares.

            It allows investors in the United States to purchase foreign equities without dealing with complex currency conversions. The managing bank buys the underlying foreign shares and holds them securely in a vault. Receipts are then issued against these stored shares for public trading.

            Financial professionals frequently monitor these instruments to understand broader market sentiment. Analysts use an indian adr live tracking system to observe price movements during United States market hours. This data helps predict potential reactions in the domestic market on the following trading day. Accessing a verified adr list becomes the crucial first step for anyone studying global equity trends..

            Full List of Indian ADR Stocks Listed in the US

            Currently, several prominent companies from India actively trade on United States exchanges. The table below presents adr stock list and core details of these international listings.

            CompanyTickerExchangeListed SinceADR RatioSector
            Infosys Ltd.INFYNYSE19991 ADS = 1 Equity ShareIT Services
            Wipro Ltd.WITNYSE20001 ADS = 1 Equity ShareIT Services
            ICICI Bank Ltd.IBNNYSE20001 ADS = 2 Equity SharesBanking
            HDFC Bank Ltd.HDBNYSE20011 ADS = 3 Equity SharesBanking
            Dr. Reddy’s LaboratoriesRDYNYSE20011 ADS = 1 Equity SharePharmaceuticals
            Yatra OnlineYTRANASDAQ2016Ordinary ShareOnline Travel

            Note: The data provided in the table is sourced from live market updates. 

            1. Infosys Ltd. (INFY)

            Infosys operates as a massive global leader in next generation digital services and consulting. The company is made history in 1999 as the first Indian business to list on the NASDAQ exchange. The firm eventually transferred its listing to the New York Stock Exchange to leverage broader market partnerships.

            2. Wipro Ltd. (WIT)

            Wipro represents another major pillar in the global information technology and consulting industry. The company officially listed its depositary receipts on the New York Stock Exchange in the year 2000. It offers extensive capabilities in artificial intelligence, cloud computing, and cyber security services.

            3. ICICI Bank Ltd. (IBN)

            ICICI Bank are recognized as one of the largest and most influential private sector banks in India. The institution has provided a vast array of banking products and specialized financial services. It caters to both corporate clients and retail customers through robust digital channels and physical branches.

            4. HDFC Bank Ltd. (HDB)

            HDFC Bank maintains a dominant leadership position in the private banking and retail credit sectors. The financial institution is widely praised for its exceptional asset quality and extensive branch network. It listed its depositary receipts in 2001 to attract substantial capital from international institutional investors.

            Global funds frequently choose this stock to participate in the expanding domestic credit market. The bank consistently demonstrates strong financial stability and impressive year over year growth metrics. The organization focuses deeply on expanding its reach into semi urban and rural domestic markets.

            5. Dr. Reddy’s Laboratories (RDY)

            A highly successful multinational pharmaceutical company is operated by Dr. Reddy’s Laboratories’ Essential funding for ongoing research and development initiatives are provided by the international listing. A critical role in the global healthcare supply chain is played by the company. Crucial medicines is delivered to multiple nations by them. 

            6. Yatra Online (YTRA)

            Yatra Online is an Indian online travel company offering services such as flight bookings, hotels, holiday packages, and other travel-related services. The company began trading on the NASDAQ under the ticker YTRA in 2016 and provides US-market investors with exposure to India’s growing online travel industry. 

            Read Also: How to Invest in US Stocks from India

            Which Indian ADRs Have Been Delisted?

            Several prominent companies have successfully removed their depositary receipts from United States markets over the years:

            • Tata Motors: The major automobile manufacturer voluntarily delisted its receipts from the New York Stock Exchange. The leadership took this step to simplify financial reporting structures and reduce heavy administrative burdens.
            • Vedanta: This decision helped the company consolidate its complex corporate structure and streamline overall operations.
            • MTNL: Mahanagar Telephone Nigam Limited previously maintained an international listing but eventually delisted. This occurred due to consistently low trading volumes and rapidly shifting dynamics in the telecommunications market.
            • Sterlite Industries: This industrial company merged with other corporate entities over a period of time. The structural changes eventually led to the removal of its international depositary receipts from active foreign trading.

            Can Indian Investors Buy ADR Stocks?

            Here is how domestic investors typically access these overseas assets:

            • The Liberalised Remittance Scheme: The Reserve Bank of India permits domestic residents to send up to USD 250,000 abroad every financial year. These designated funds can be used legally to buy shares on foreign exchanges.
            • International Brokerage Accounts: Investors must open a specific trading account that grants direct access to United States markets. These specialized accounts handle the necessary currency conversion and execute the purchase of the foreign equities.
            • Asset Tracking: After a successful purchase, a person simply holds the indian adr securely in their digital portfolio. They can easily monitor the adr share price through their brokerage dashboard to track daily financial performance.
            • Fractional Investing Capabilities: Many advanced digital platforms allow the purchase of partial shares today. This feature ensures that investors do not need large sums of upfront capital to start building a global equity portfolio.

            Conclusion

            Investing in domestic companies through international exchanges offers a highly practical way to diversify financial portfolios. The prominent presence of major corporations on global platforms highlights the core strength and long term potential of these businesses. Modern financial technology and supportive regulatory frameworks have made accessing these global markets incredibly simple.

            S.NO.Check Out These Interesting Posts You Might Enjoy!
            110 Most Undervalued Stocks in India
            2List of Best Monopoly Stocks in India
            3Top 10 Best Summer Stocks in India
            4List of Top 10 Blue Chip Stocks in India
            5List Of Best Logistics Stocks in India

            Frequently Asked Questions (FAQs)

            1. What is the meaning of an ADR?

              It stand for American Depositary Receipt, a negotiable financial certificate issued by a american bank that represents shares in a foreign company.

            2. What are the main benefits of these investments? 

              They provide an incredibly easy way to invest in global markets. Investors entirely avoid foreign currency conversions and complex cross border trading regulations.

            3. How do investors use these instruments? 

              Individuals purchase them through standard international brokerage accounts. They trade exactly like regular domestic shares during standard market hours on major exchanges.

            4. Do these specific investments pay regular dividends? 

              Yes, they do. The managing bank receives the corporate dividend in the foreign currency, converts the money to dollars, and pays the investors directly.

            5. Are there additional costs to use them? 

              Yes, minor costs exist. The banks that issue the certificates usually charge a very small fee to cover the administrative costs of holding the original shares securely.

          8. What is Pair Trading?

            What is Pair Trading?

            The stock market often feels like a roller coaster of unpredictable price swings. Navigating these constant changes requires smart and calculated methods. Many market participants look for ways to protect their investments from sudden economic downturns. They rely on specialized methods that focus on the relationship between different assets rather than the overall market direction. This approach offers a unique way to find balance and stability. Finding steady opportunities becomes much easier when market participants use historically proven data.

            What is Pair Trading

            Financial markets offer various ways to generate consistent returns. One highly effective method is pair trading. This is an automated and market-neutral strategy developed originally by researchers at Morgan Stanley. It focuses entirely on the price relationship between two highly correlated assets. When two related companies usually move together, their prices share a strong bond. Sometimes, temporary market events cause their prices to drift apart. This creates a unique opportunity for market participants.

            Market participants often consult a pair trading stock list before making any financial decisions. This list helps identify companies that have a proven history of moving in tandem. By relying on historical data, investors can find reliable opportunities quickly.

            Example of Pair Trading

            To understand this concept clearly, consider two major companies in the banking sector. Let us look at Axis Bank and ICICI Bank as real-world examples. These two private sector banks share very similar business backgrounds Because they operate in the exact same environment, their daily stock prices tend to move together. This strong historical relationship makes them excellent pair trading stocks for market participants. Suppose a sudden news event causes Axis Bank to drop in price significantly.

            At the exact same time, ICICI Bank remains stable or increases slightly in value. The historical price relationship between the two banks is temporarily broken. An informed investor knows this gap will likely close as the market digests the news.

            The investor will immediately buy shares of Axis Bank because it is temporarily cheap. Simultaneously, the investor will sell shares of ICICI Bank to balance the overall position. This dual action protects the investor from broader banking sector movements.

            How to Pick Right Stocks in Pair Trading

            Selecting the correct assets is the most critical step for success. Market participants rely heavily on mathematical data to make these choices. Here are the key points to consider when picking the right assets:

            • Focus on the same sector: Companies like two competing banks or two car manufacturers face similar economic forces.
            • Check the Past correlation: Ensure the two assets have a history of moving together over a long period. Experts suggest checking performance over periods ranging from six months to five years.
            • Calculate the correlation coefficient: Use statistical tools to measure the exact strength of the relationship. A perfect positive relationship scores a +1, but investors usually look for a score of at least 0.80.
            • Test for cointegration: Correlation just shows if prices move in the same direction. Cointegration is a deeper mathematical test that ensures the actual price gap between the two assets remains stable over time.
            • Avoid structural changes: Do not pick companies that have recently changed their core business models. Historical data becomes useless if a company fundamentally alters how it operates.

            To highlight the difference between the two most important statistical checks, review the comparison below. Understanding this distinction is vital for picking reliable assets.

            FeatureCorrelationCointegration
            Primary GoalChecks if two assets move in the same direction.Checks if the price gap between assets remains stable.
            MeasurementScored as a decimal between -1.0 and +1.0.Passed or failed based on advanced statistical tests.
            ImportanceHelps find initial pairs that look alike historically.Confirms that the price gap will eventually close.
            ReliabilityCan give false signals if both stocks rise independently.Highly reliable for predicting a return to the average price.

            Following these specific points ensures the selected assets have a genuinely strong bond. Proper selection heavily reduces the chance of unexpected financial surprises.

            Read Also: What is Quoted Price in Commodity Trading?

            How to Perform Pair Trade

            Here are the necessary steps to perform the trade accurately:

            • Establish selection criteria: Begin by choosing a specific market sector and a clear timeframe for the price analysis. This narrows down the thousands of available companies to a smaller, manageable group.
            • Build a potential list: Identify asset pairs that show a strong historical price relationship. Confirm that these pairs have a correlation coefficient of 0.80 or higher.
            • Conduct detailed analysis: This confirms that the current price difference is just a temporary market reaction.
            • Execute the dual positions: Wait for a clear price divergence to appear on the market charts. Open a long position on the undervalued asset and a short position on the overvalued asset at the exact same moment.
            • Manage the financial risk: Set up automated stop-loss orders in the trading system. A stop-loss will automatically close the trade if the prices continue to drift further apart beyond a safe limit.
            • Close the market trades: Wait patiently for the prices to return to their normal historical gap. Once the assets reunite in their typical pattern, close both trades to secure the final outcome.

            Advantage of Pair Trading

            There are several notable benefits to using this relative value approach. It provides a unique way to interact with financial assets safely.

            • Market independence: The strategy does not rely on predicting whether the overall stock market will rise or fall. It remains effective during unpredictable or volatile economic periods.
            • Time efficiency: Participants do not need to constantly study macroeconomic conditions. The focus remains entirely on the specific relationship between the two chosen assets.
            • Risk reduction: By holding both a long and a short position simultaneously, the portfolio is naturally balanced. The negative impact of sudden market crashes is heavily minimized.
            • High flexibility: The strategy can be adjusted easily for different market timeframes. It works well for both short-term market participants and longer-term analytical enthusiasts.

            Limitation of Pair Trading

            Despite its structural benefits, this strategy carries specific risks and challenges. Market participants must be aware of these hurdles before allocating capital.

            • Permanent divergence risk: There is always a risk that the price gap between the two assets never closes. This happens if unexpected fundamental changes occur within one of the companies.
            • High entry barrier: Finding pairs with strong and reliable correlations requires advanced research. It demands deep statistical knowledge and complex mathematical testing.
            • Increased trading costs: The strategy requires opening and closing two separate positions at once. This means brokerage fees and mandatory market taxes are effectively doubled.

            Read Also: Best Strategies to Trade from Charts

            Conclusion

            The financial markets offer countless ways to participate and grow capital. Focusing on relative asset value is a deeply fascinating method that removes much of the daily market noise. By analyzing how two related companies interact with each other, market participants can uncover hidden opportunities.

            These opportunities exist entirely independently of broader economic swings or global news events. While this method requires careful research and a solid understanding of market relationships, the educational journey is highly rewarding. Exploring these balanced methods can bring a fresh and structured perspective to any modern financial endeavor.

            S.NO.Check Out These Interesting Posts You Might Enjoy!
            1How To Use Directional Movement Index In Trading?
            2Kelly Criterion for Stock Trading
            3A Complete Guide to Commodity Trading Strategies for Traders
            4How to use MTF Optimally?
            51 Minute Scalping Strategy: Best Setup & Indicators

            Frequently Asked Questions (FAQs)

            1. What is the meaning of pair trading strategy? 

              It is a market-neutral technique involving buying one asset and selling a related asset simultaneously. The goal is to profit when their temporary price difference closes.

            2. What are the main benefits of pair trading? 

              The primary benefit is its complete independence from market direction. It performs well regardless of whether the overall market crashes or rallies unexpectedly.

            3. How do participants use pair trading? 

              Participants find two highly correlated assets and wait for their prices to drift apart. They take opposite positions and wait for prices to reunite.

            4. What is a correlation coefficient? 

              It is a statistical number between -1 and +1. It measures exactly how closely two different assets move together in the market.

            5. Can this strategy fail? 

              Yes. If the price gap between the chosen assets widens permanently instead of closing, financial losses will occur.

          9. Dividend Reinvestment Plan (DRIP): Meaning, Benefits & How It Works

            Dividend Reinvestment Plan (DRIP): Meaning, Benefits & How It Works

            A dividend reinvestment plan, or DRIP, is an automatic system that allows you to purchase additional shares or mutual funds from the dividends that you earn. The dividend is not cashed out here.

            The amount you earn as a dividend is reinvested so that it can grow over time for you. This is where you get the benefit of compounding as well. 

            The dividend under a dividend reinvestment plan is treated as an automatic investment plan that saves time and ensures your wealth grows over time. As an investor, knowing and understanding DRIP is very important. So, read this guide to know the details you need.

            What Is a Dividend Reinvestment Plan?

            A dividend reinvestment plan (DRIP) is an investment facility that automatically uses the dividends to earn additional units of stock. This is something that works on its own once you set the plan in motion. 

            You know that when a dividend is announced, investors get money in their accounts. But when you register in the DRIP, the same amount helps you to buy additional shares. Now these shares will grow with your existing shares and offer you compounding benefits. 

            This is in mutual funds as well. Here, the distributed amount can be reinvested to purchase additional units under the IDCW Reinvestment option.

            This allows your investment to grow and build wealth.

            Key Features of a Dividend Reinvestment Plan

            FeatureDescription
            Automatic reinvestmentDividends are used to purchase additional shares or units automatically.
            No manual investingInvestors do not need to reinvest every dividend themselves.
            CompoundingFuture dividends are earned on the increased investment.
            Long-term focusBest suited for investors with a longer investment horizon.
            Flexible availabilityOffered by companies, brokers, and mutual funds, depending on the product.

            Why Do Investors Choose Dividend Reinvestment?

            Dividend reinvestment allows investors to have steady growth of their investment without actually being involved a lot. The fund offers you better returns than the usual minimum value you get by placing money in your savings account. 

            Some common reasons include:

            • Building wealth through compounding
            • Increasing ownership without investing additional money
            • Maintaining investment discipline
            • Automating the investment process
            • Avoiding the need to manually purchase additional shares

            This is a great long-term strategy for investors who do not need funds or are rather saving for the future.

            How Does a Dividend Reinvestment Plan Work?

            The process behind a dividend reinvestment plan is fairly straightforward. Whenever a company or mutual fund declares a dividend, eligible investors receive the benefit based on the number of shares or units they own. Instead of receiving the amount in cash, the dividend is automatically used to purchase additional shares or units.

            Working of a Dividend Reinvestment Plan

            StepWhat Happens
            Dividend is declaredThe company or mutual fund announces a dividend.
            Record date is fixedEligible shareholders or unit holders are identified.
            Dividend amount is calculatedBased on the number of shares or units held.
            Dividend is reinvestedAdditional shares or units are purchased automatically.
            Portfolio growsFuture dividends are calculated on the increased holding.

            Example of a Dividend Reinvestment Plan

            Say you have 300 shares of Company A. Now, the company announces a dividend of ₹8 per share.

            Your total dividend works out to:

            300 × ₹8 = ₹2,400

            Now, say that the market price of the shares is ₹240. If you have DRIP active, you will get 10 additional shares.

            Your holding increases from 300 shares to 310 shares without making any fresh investment.

            So, now the next time the dividend is announced, you will get even more. You can invest this as well and create a chain of compounding that will grow for you.

            Types of Dividend Reinvestment Plans

            Although the concept remains the same, dividend reinvestment plans can differ depending on who offers them.

            1. Company-Sponsored Dividend Reinvestment Plans

            Some listed companies provide their own dividend reinvestment programme to shareholders.

            These plans generally allow investors to:

            • Automatically reinvest dividends.
            • Purchase additional shares directly.
            • Enroll voluntarily before participating.

            In certain global markets, companies may even offer shares at a discounted price under these programmes.

            2. Broker-Sponsored Dividend Reinvestment Plans

            Several brokerage platforms provide automatic dividend reinvestment as an account feature. This allows the broker to purchase on behalf of the client with the least intervention.

            This simplifies the investment process, especially for long-term investors who prefer automation over manually placing buy orders after every dividend payment.

            3. IDCW Reinvestment in Mutual Funds

            In mutual funds, dividend options are now known as Income Distribution cum Capital Withdrawal (IDCW).

            If you select the IDCW Reinvestment option:

            • The distributable amount is not credited to your bank account.
            • It is automatically invested in the same scheme.
            • Additional mutual fund units are allotted based on the applicable NAV.

            Although the terminology has changed, the underlying principle remains similar to a dividend reinvestment plan.

            4. Optional Dividend Reinvestment

            The choice to select between dividend cash-out and reinvestment is offered to investors. This is through companies and brokers alike. This flexibility allows the investors to decide what they want. This is very good for retirees, as this allows them to pay out when needed. 

            Factors That Influence Dividend Reinvestment

            Not every dividend payment results in the same number of additional shares or units. Several factors determine how much gets reinvested.

            Some of the key factors that you should know are as follows:

            • Dividend amount declared by the company
            • Current market price of the stock
            • Applicable NAV in mutual funds
            • Number of shares or units already held
            • Reinvestment option selected by the investor

            Common Misconceptions About Dividend Reinvestment

            Many new investors can get confuse on what the DRIP is all about. This is where you should get clarity on certain common myths as follows:

            MythReality
            Dividend reinvestment gives free shares.Shares are purchased using your own dividend amount.
            Reinvestment guarantees higher returns.Returns still depend on market performance.
            Dividends become tax-free if reinvested.Tax rules may still apply depending on prevailing regulations.
            Every company offers DRIPs.Availability varies across companies and brokers.
            Reinvestment removes investment risk.Market risk remains even after reinvestment.

            Who Should Choose a Dividend Reinvestment Plan?

            A dividend reinvestment plan may not be perfect for all investors. This means that you should understand your goals and needs well before you decide to go ahead with them. 

            Here are some aspects that can help you decide if the DRIP is good for you or not:

            Investor TypeIs a DRIP Suitable?Reason
            Long-term investorsYesHelps maximise compounding over time.
            Young investorsYesA longer investment horizon allows compounding to work effectively.
            Retirement corpus buildersYesSupports gradual wealth accumulation.
            Passive investorsYesAutomatic reinvestment requires minimal effort.
            Income-focused investorsNoCash dividends may better meet regular income needs.
            Short-term tradersNoLimited benefit over a short investment period.

            Before choosing a DRIP, consider what your priority is and what you need the money for. This will help you gain a better insight into which option is good for you. 

            Things to Consider Before Choosing a Dividend Reinvestment Plan

            While a dividend reinvestment plan is perfect for long-term investing, here are some factors that you should consider before you start to decide on:

            • Investment objective: Choose reinvestment if your primary goal is long-term capital appreciation rather than regular income.
            • Dividend history: Companies with a consistent record of paying dividends are good for DRIP. So, ensure you check the same.
            • Financial strength: Review the company’s fundamentals before relying on dividend income for reinvestment.
            • Tax implications: Reinvested dividends may still be taxable under the applicable tax laws.
            • Portfolio diversification: Avoid allowing one stock to become an excessively large portion of your portfolio through repeated reinvestment.
            • Liquidity needs: If you expect to need cash in the near future, receiving dividends directly may be a better option.

            Review your investments periodically to ensure your chosen dividend option continues to support your financial goals.

            How to Invest Through Pocketful

            Investing in dividend-paying stocks and mutual funds through Pocketful is simple. You will need to follow the steps below:

            1. Download the Pocketful app or sign up on the website.
            2. Open a free demat and trading account.
            3. Complete your KYC verification.
            4. Add funds to your trading account.
            5. Research dividend-paying stocks or mutual funds using Pocketful’s tools.
            6. Place your buy order and start building your portfolio.
            7. Track your investments regularly.
            8. Make changes as needed and ensure that you align with your goals.

            Conclusion

            A dividend reinvestment plan is a practical option for investors who want to grow their wealth through the power of compounding. This process is automatic, which means the investor intervention needed is very low.

            But when you decide to start with DRIP, you must ensure that you are well aware of your goals and also the dividend value that you wish to reinvest. To select such companies, you need the right information. Pocketful provides a easy platform to research, invest, and manage your portfolio with ease. 

            S.NO.Check Out These Interesting Posts You Might Enjoy!
            1Best Long-Term Mutual Funds to Invest in India
            210+ Best Investment Plan for Monthly Income in India
            3Best Gilt Mutual Funds in India
            4Best Precious Metal Mutual Funds to Invest in India
            5Best SWP for Monthly Income in India

            Frequently Asked Questions (FAQs)

            1. What is a dividend reinvestment plan?

              A dividend reinvestment plan automatically uses dividends to purchase additional shares or mutual fund units. This helps with compounding.

            2. Is a dividend reinvestment plan better than receiving cash dividends?

              It depends on your financial goals. Reinvestment is generally suitable for long-term wealth creation, while cash dividends may be preferable if you need regular income.

            3. Is the dividend taxable under a dividend reinvestment plan?

              Yes. Reinvested dividends are taxed according to the rules, even when they are not cashed out. Check with an expert before planning ahead.

            4. Can I switch from dividend reinvestment to cash payouts?

              In many cases, yes. The availability of this option depends on the company, broker, or mutual fund offering the dividend facility.

            5. Who should opt for a dividend reinvestment plan?

              Long-term investors who want to benefit from compounding and do not require immediate dividend income are generally the most suitable candidates for a dividend reinvestment plan.

          10. Open Free Demat Account

            Join Pocketful Now

            You have successfully subscribed to the newsletter

            There was an error while trying to send your request. Please try again.

            Pocketful blog will use the information you provide on this form to be in touch with you and to provide updates and marketing.