Blog

  • Importance Of Algo Trading In Futures And Options For Traders

    Importance Of Algo Trading In Futures And Options For Traders

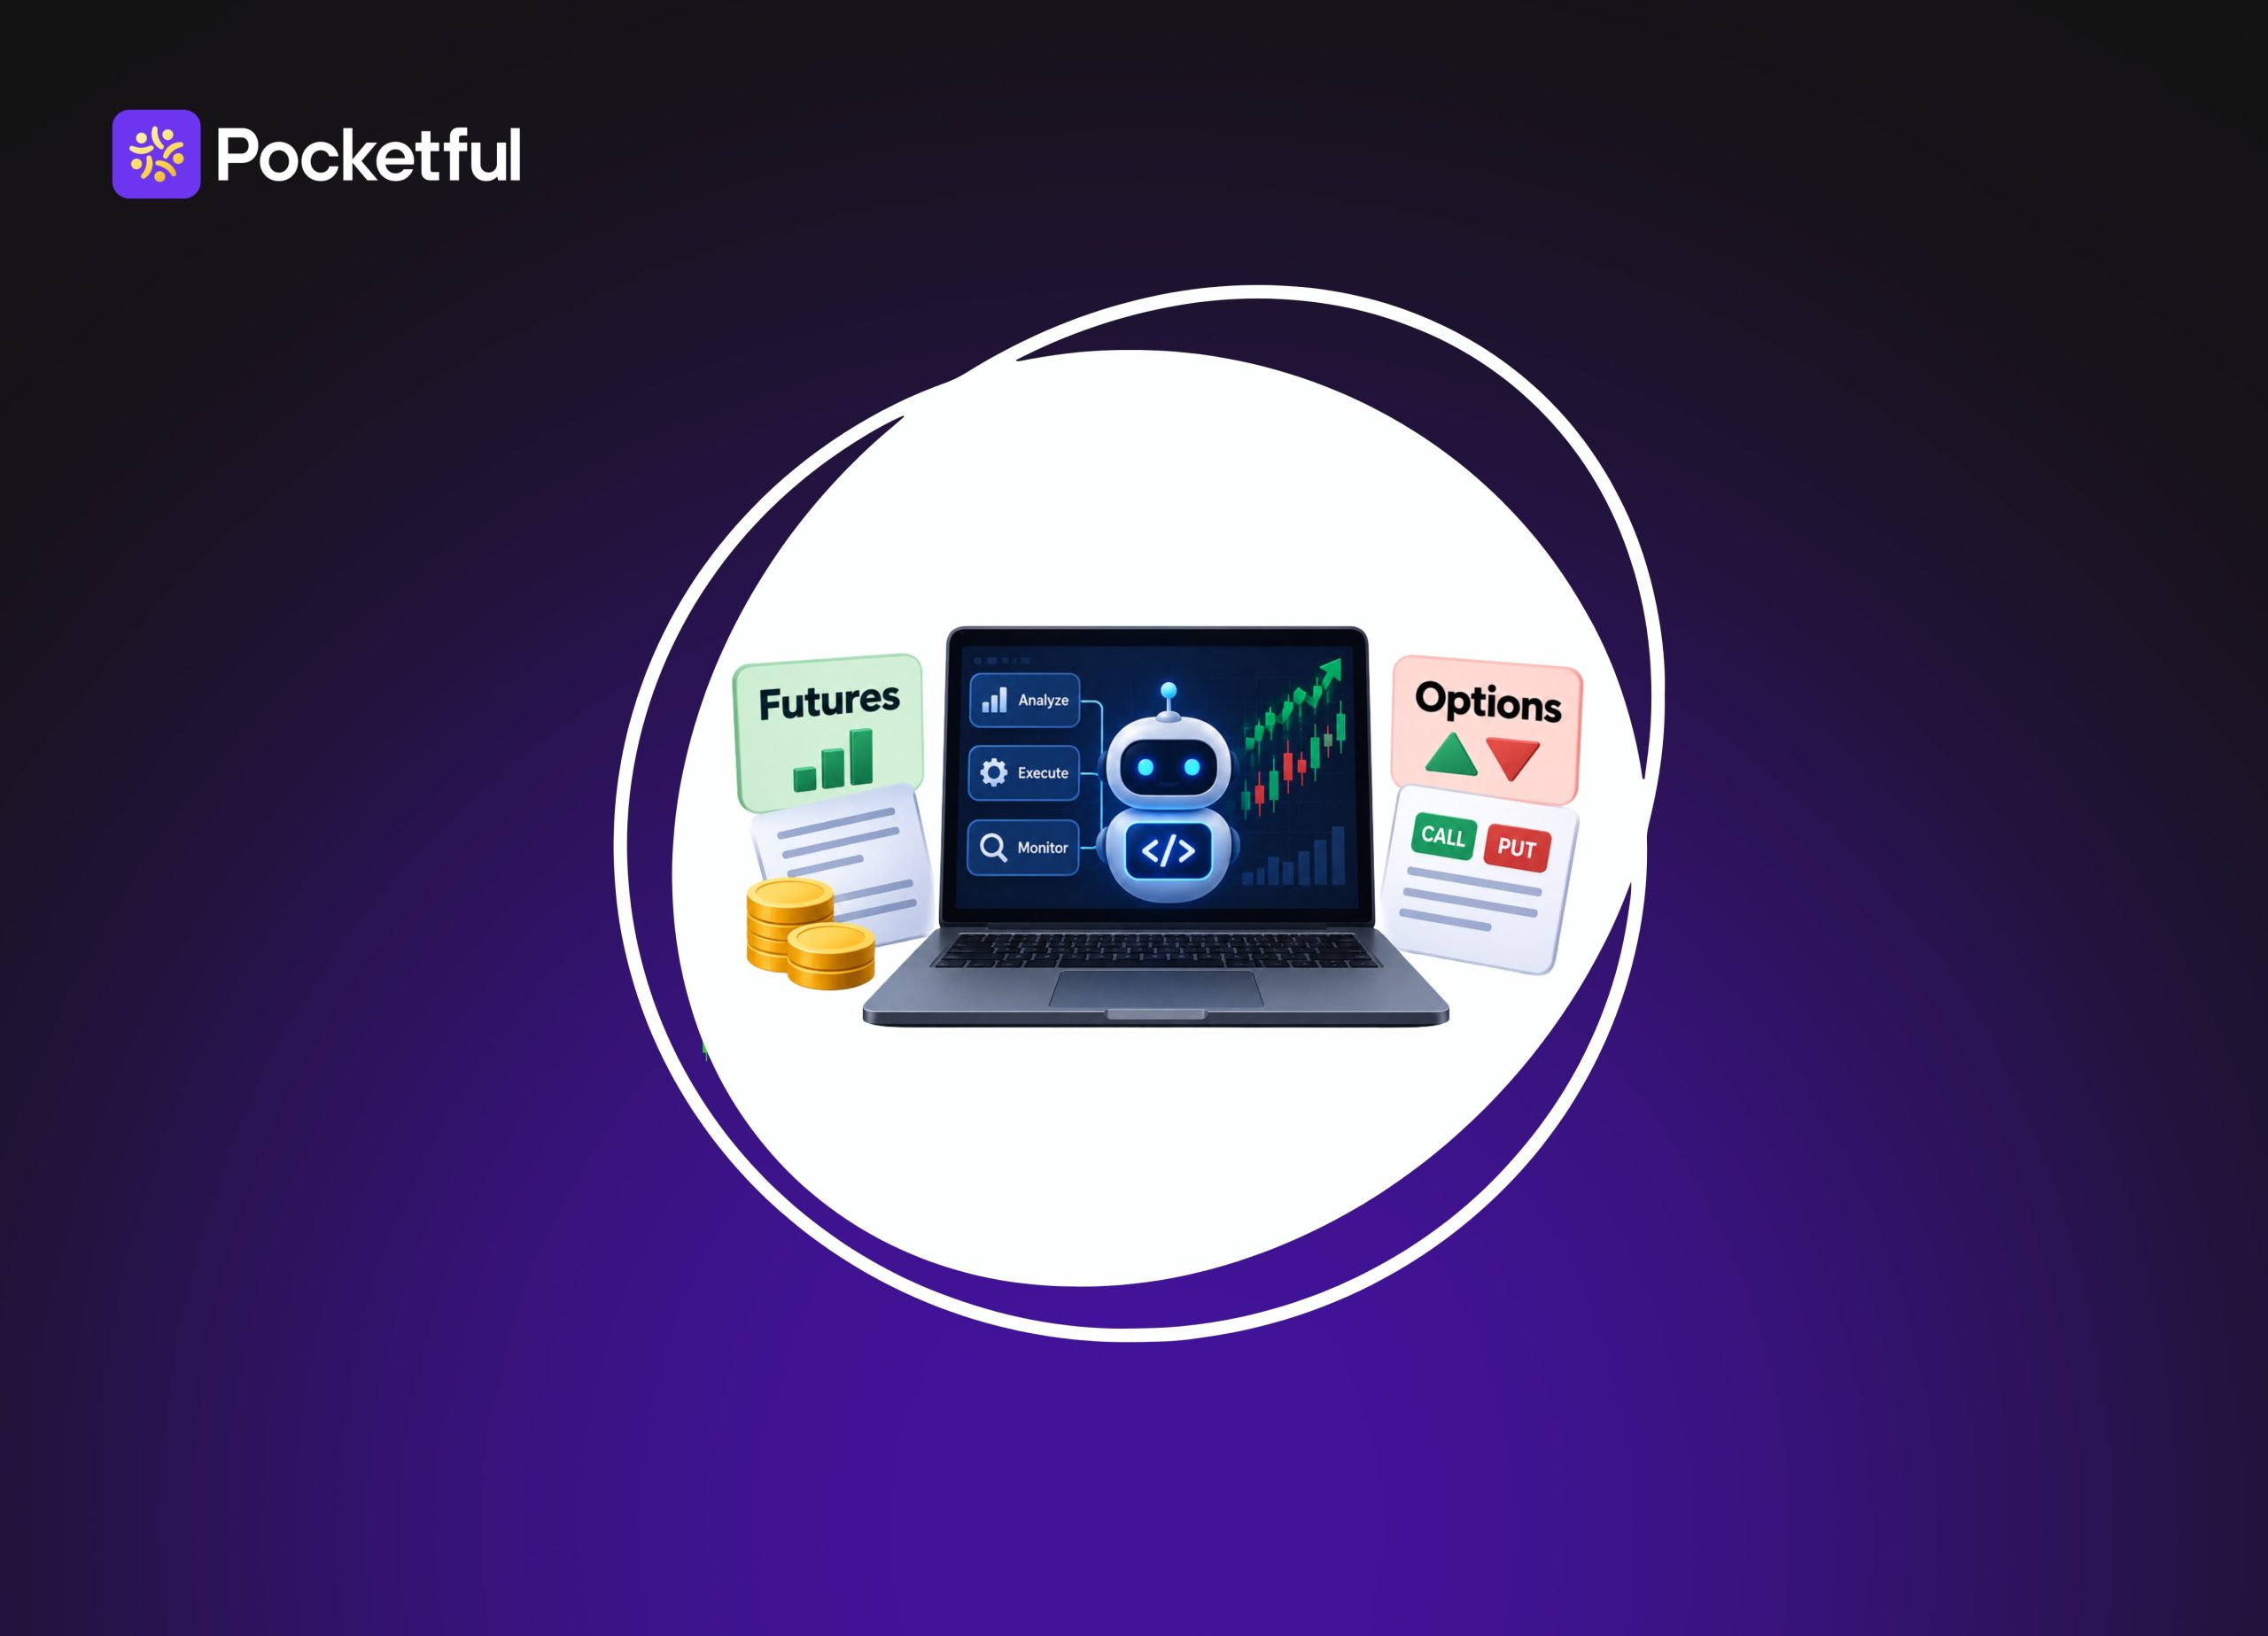
    In case you have identified a trading opportunity in the futures and options segment, but by the time you confirm the trend, check the price, confirm the signal, and place the order, the market has already moved in the expected direction. This may lead to a loss of opportunity, as F&O prices are highly volatile. In this case, Algo Trading comes in.

    In today’s blog post, we will give you an overview of algo trading their importance with an example. 

    What is Algo Trading?

    Algorithmic trading, also known as Algo Trading, is a method of buying and selling financial instruments like equities, commodities, and derivatives using a predefined computer program that executes predefined trading rules, rather than manually watching the market. Traders are also not required to decide when to place buy and sell orders through algorithmic trading. This is determined by the system based on factors such as price movement, technical indicators, and trading volume.

    Why is Algo Trading Important for Futures and Options?

    The key importance of algo trading for futures and options is as follows:

    1. Faster Execution: Algo trading setups can monitor the market continuously, and the system can place orders as the predefined conditions are met. This significantly reduces the delay in execution of orders.
    2. Emotional Trading: Algo trading executes trades on a predefined set of rules and regulations. This reduces the impact of greed, fear, and hesitation in trading decisions.
    3. Complex Strategies: Option trading involves the use of complex strategies, and managing them manually can be challenging. Algo trading helps in the execution of complex trading strategies in an efficient manner.
    4. Backtesting: Using algo trading tools, one can backtest their trading strategies against the historical data. This reduces the overall risk and helps in analysing how the strategies performed in different market conditions.
    5. No Need for Constant Monitoring: Traders are required to regularly monitor the market and its movements, which takes time. An algorithm can continuously track the market and take appropriate action whenever required.
    6. High-Frequency Trading: There are various futures and options strategies that are dependent on quick market movements, but it is difficult in case of manual execution. Algo trading follows an automated system and can send orders much faster than a human system.
    7. Consistent: Algo trading works on a specific set of rules and applies the same rules without any changes that may be possible in case of emotional trading. Therefore, this consistency is useful for futures and options trading. 
    8. Analysis of Various Parameters: Trading in futures and options requires analysis of various factors such as price, volume, open interest, etc., which may not be possible for an individual investor to track. But an algo trading strategy can monitor all these factors and execute trades efficiently.

    How Does Algo Trading Work in Futures and Options?

    Algo trading works in the following manner in futures and options: 

    1. Define the Strategy: The first step towards algo trading in futures and options is to define the trading strategy based on a predefined set of rules and regulations. The algo uses these rules as instructions.
    2. Conversion of Strategy: After the strategies are defined, the rules are converted into code that can be read by computers. The algo is programmed in a manner to identify the rules based on market conditions and execute the trades.
    3. Integration: The next step is to integrate the algo into the trading platform. This can be done through the API. This connection allows the algorithm to receive the market data and execute predefined strategies accordingly.
    4. Monitoring of Data: Once the system is activated, the algorithm continuously monitors the market data based on the parameters.
    5. Initiating Trading Signal: When the conditions defined by the traders are met, the algo generates a trading signal depending on the buy or sell conditions.
    6. Executing Trade: As soon as the conditions are satisfied, the system automatically places the buy or sell order in the system. This automated execution is important while trading in futures and options, as prices move very quickly.
    7. Monitoring: The algo trading system does not stop after the order is placed. It continuously monitors the open position and exits the trade when the stop-loss is triggered, or the target is achieved.

    Read Also: Benefits of Algo Trading in India

    Example of Algo Trading in Futures and Options

    Let’s understand how algo trading works in futures and options through an example:

    Suppose a trader, Mr A, has a predefined strategy in which he wishes to buy Nifty Futures when it crosses 24000. He wants to place a stop-loss of 23900 and set the target as 24200. He does not want to take another trade if this trade ends in a loss. 

    He defines this in the strategy and integrates it with his trading setup. Now, the algo trading strategy is working. The system continuously monitors the market and Nifty price. As soon as the Nifty crosses 24000, the system instantly places a buy order into the exchange. Once the order is executed, it automatically places the stop-loss at 23900 and the target at 24200. And after a few hours, when Nifty moves to 24200, the algorithm automatically exits the position.

    In this trade, Mr A is not required to monitor the market; the algo works on his behalf and executes a profitable trade.

    Risks of Algo Trading in Futures and Options

    The risks of algo trading in futures and options are as follows:

    • Technical Errors: There can be various technical errors that can cause orders to be placed in the system. These errors include API failures, server issues, etc.
    • Programming Errors: If there is any error in the logic of the algorithm, it can lead to incorrect orders, wrong quantities, etc.
    • Volatility: The prices of futures and options contracts move very rapidly, especially when news comes out or during periods of economic uncertainty.
    • Leverage Positions: Various futures and options contracts involve leverage, which can increase both profit and loss. If the market moves against it, it can cause quick losses.
    • Lack of Human Intervention: An algorithm is not capable of monitoring unexpected market events that may cause sudden volatility in the market. An algo may continue trading even when the market conditions have changed significantly.

      Things to Consider Before Using Algo Trading for F&O

      The key things that an investor should consider before using algo trading in futures and options are:

      • Strategy: One must make sure that the strategy they are using has defined entry and exit, stop-loss, etc. The logic given to the system must be accurate.
      • Backtesting: The strategy given to the algo must be backtested before implementing any real-world trade. This may help a trader in understanding the potential performance, drawdowns, and behaviour during different market conditions.
      • Risk: The maximum position size, stop-loss, etc. must be clearly defined before implementing any strategy. This helps in minimising the loss due to adverse market conditions.
      • Monitoring: Monitoring the algo regularly is necessary, especially related to orders, positions, and system performance. Implementing an algo does not mean that you can completely switch off your attention. 

      Read Also: How to Do Algo Trading in India?

        Conclusion

        On a concluding note, algo trading has reshaped the options and futures traders’ world. It executes trades more efficiently and systematically. Algo trades are simply executed based on market data such as volume, technical indicators, etc. It does not involve any human emotions. However, one must understand that using algo trading is not a shortcut to profit; it may also cause losses in case of any technical failure, leverage, etc. Therefore, one must focus on implementing a well-defined strategy and backtest it in real-world data. Also, it is advisable to consult your investment advisor before any trade using algo trading in futures and options. 

        S.NO.Check Out These Interesting Posts You Might Enjoy!
        1Top Algorithmic Trading Strategies
        2Is Algorithmic Trading Legal and Profitable in India?
        3What Is High-Frequency Trading (HFT)?
        4Best Artificial Intelligence (AI) Stocks In India
        5What is Quantitative Trading?

        Frequently Asked Questions (FAQs)

        1. What is the meaning of backtesting in algo-trading?

          Backtesting refers to testing an algorithmic strategy on the historical market data to check how the strategy might have performed in the past. This may help in identifying the potential strengths and weaknesses of the strategy.

        2. Am I required to have knowledge of coding for algo-trading?

          No, it is not necessary to have coding knowledge. Various platforms offer no-code or low-code algo trading tools. Only a basic understanding of trading logic, APIs, and programming can be useful to create algo trading strategies.

        3. Can algo trading lower the trading cost?

          No, algo trading does not lower the trading cost; brokerage charges, STT, etc. are not eliminated by an algo trading setup. It only improves the efficiency of order execution.

        4. Are there any charges for implementing APIs with the trading terminal?

          No, most brokers offer free integration of APIs with the trading terminal.

        5. After activating algo trade, do I still need to monitor it?

          Yes, regular monitoring of algo trade is necessary, as market conditions and technical problems may arise at any time and can affect algorithm performance. 

    1. What Is RIA in Mutual Fund? Meaning, Fees & RIA Code

      What Is RIA in Mutual Fund? Meaning, Fees & RIA Code

      RIA in mutual fund stands for Registered Investment Adviser. It is a person or entity registered with SEBI to provide investment advice. 

      An RIA charges clients for advisory services instead of earning commissions from the mutual fund products recommended. Read this guide to know the details.

      What Is RIA in Mutual Fund?

      A Registered Investment Adviser provides investment advice. It is based on your financial goals, risk profile, investment horizon, and financial position. RIAs operate under the SEBI Investment Advisers Regulations, 2013. It is along with subsequent amendments.

      SEBI requires an investment adviser to act in a fiduciary capacity towards clients. This means:

      • Customer interest is always first.
      • All conflicts should be disclosed.
      • Follow suitability requirements.

      RIA Full Form in Mutual Fund

      The RIA full form in mutual fund is Registered Investment Adviser. It can refer to an individual or an eligible entity registered under SEBI’s investment advisory framework.

      A mutual fund distributor operates differently. Distributors are registered with AMFI and generally use an AMFI Registration Number, or ARN, to distribute mutual funds. They may earn commissions through regular mutual fund plans.

      What Is RIA Code in Mutual Fund?

      If you are wondering what is RIA code in mutual fund, it generally refers to the SEBI registration number of the Registered Investment Adviser.

      You can use these registration details to verify whether an adviser is registered before paying for investment advice. An RIA’s SEBI registration number should not be confused with the ARN used by mutual fund distributors.

      Why Does This Difference Matter?

      The main difference comes down to the nature of the service and how it is paid for.

      An RIA charges you for providing investment advice. A mutual fund distributor may receive commissions linked to the regular mutual fund plans you purchase through them.

      Neither arrangement automatically tells you whether a particular investment is suitable. However, knowing the compensation model helps you understand potential conflicts and the cost of the service.

      RIA vs Mutual Fund Distributor

      RIAs and mutual fund distributors may both help investors with mutual funds, but their primary roles are different.

      FactorRIAMutual Fund Distributor
      RegistrationSEBI investment advisory framework.AMFI registration.
      Primary roleProvides investment advice.Distributes mutual funds.
      CompensationAdvisory fee paid by the client.May earn commission from regular plans.
      Mutual fund routeDirect plans can be used for advisory clients.Generally distributes regular plans.
      ResponsibilityFiduciary responsibility towards advisory clients.Follows applicable distribution rules.
      ConflictConflicts must be disclosed and managed.Commission structure can create potential conflicts.

      Direct mutual fund plans do not include distributor commissions and generally have lower expense ratios than corresponding regular plans. Regular plans include distribution-related expenses.

      This does not necessarily mean every investor should choose an RIA. If you need personalised financial advice, an adviser may be useful. If you only need help completing mutual fund transactions, your requirements may be different.

      Role and Responsibilities of an RIA

      An RIA does more than simply suggest a mutual fund. The exact responsibilities depend on the advisory agreement and services selected.

      Common responsibilities include:

      • Understanding your financial position and investment goals.
      • Assessing your willingness and ability to take risk.
      • Recommending investments suitable for your risk profile.
      • Helping structure investments around financial goals.
      • Reviewing investments when circumstances change.
      • Disclosing fees and relevant conflicts of interest.
      • Maintaining records related to advice and suitability.
      • Explaining risks associated with recommendations.

      Risk profiling is particularly important. An adviser needs to understand how much financial risk you can take and how comfortable you are with market fluctuations before making recommendations.

      Agreement Between an RIA and Client

      The advisory relationship is governed by an agreement between you and the RIA. It establishes what services you will receive and how the adviser will be compensated.

      The agreement generally covers:

      • Scope of advisory services.
      • Fees and payment terms.
      • Rights and responsibilities.
      • Risk profiling and suitability.
      • Conflict-of-interest disclosures.
      • Termination conditions.
      • Grievance and dispute resolution.

      Reading the agreement can prevent misunderstandings later.

      Read Also: RIAs vs MFDs: Who Is Better?

      Who Can Become an RIA?

      A person who is in the business of providing investment advice for consideration generally needs registration under SEBI’s Investment Advisers framework unless an exemption applies.

      Certain professionals and intermediaries can provide incidental investment advice without separate RIA registration under specified circumstances. For example, a mutual fund distributor may provide advice that is incidental to their primary distribution activity.

      Therefore, discussing mutual funds does not automatically make someone a Registered Investment Adviser.

      Eligibility to Become an RIA

      SEBI sets qualification, certification, deposit, and other requirements for investment advisers.

      The framework changed significantly in December 2024. Specified graduate and postgraduate qualifications in areas such as finance, commerce, economics, banking, insurance, business management, and related fields can satisfy the educational requirements.

      Relevant NISM certification is also required and must remain valid.

      The earlier five-year experience requirement for individual investment advisers and principal officers was removed. The previous minimum net-worth requirements were also replaced by a deposit-based system.

      The current deposit requirement depends on the adviser’s number of clients:

      Number of ClientsMinimum Deposit
      Up to 150₹1 lakh.
      151 to 300₹2 lakh.
      301 to 1,000₹5 lakh.
      More than 1,000₹10 lakh.

      These changes are worth noting because older information about RIA eligibility may still mention the previous ₹5 lakh and ₹50 lakh net-worth requirements.

      RIA Fee Structure Under SEBI Rules

      SEBI regulates the fees investment advisers can charge individual and HUF clients. Two primary fee models are available.

      1. AUA Model

      Under the Assets Under Advice model, the maximum fee is 2.5% of AUA per annum per family of client.

      Suppose your Assets Under Advice are ₹40 lakh and your RIA charges 1% annually. Your annual advisory fee would be:

      ₹40,00,000 × 1% = ₹40,000

      The actual rate can be lower than the maximum limit based on your agreement with the adviser.

      2. Fixed-Fee Model

      Under the fixed-fee model, an adviser can charge up to the applicable annual regulatory ceiling per family of client. The ceiling was revised to ₹1,51,000 under the updated framework and can be adjusted periodically using the Cost Inflation Index.

      The earlier restriction preventing an adviser from changing the fee mode for 12 months has also been removed.

      3. RIA Fees vs Distributor Costs

      An RIA fee is usually easier to identify because you pay the advisory charge directly.

      A distributor may not send you a separate advisory bill. Instead, commissions may form part of the expenses of a regular mutual fund plan. This is one reason regular plans generally have higher expense ratios than their direct-plan counterparts.

      When comparing the two, look at the total cost as well as the service you receive. An investor who needs comprehensive financial planning may have different requirements from someone comfortable researching and managing investments independently.

      RIA Full Form in Banking

      The RIA full form in banking is also generally Registered Investment Adviser. The meaning does not change simply because the service is connected with a bank.

      However, banks can provide investment-related services through different arrangements. A bank may distribute mutual funds while investment advisory services are offered under an appropriately registered and segregated structure.

      Therefore, a mutual fund recommendation from someone working at a bank should not automatically be treated as RIA advice.

      Before investing, ask:

      • Is this an advisory or distribution service?
      • What registration applies?
      • Who pays for the service?
      • Is the mutual fund a direct or regular plan?
      • What fees or commissions apply?

      These questions make the compensation and service structure much easier to understand.

      How to Choose an RIA

      Registration is an important starting point. But the things that you should know are:

      1. Verify SEBI Registration: Check whether the person or entity is registered to provide investment advisory services. Do not rely only on social media profiles or claims of being a financial expert.
      2. Understand the Fees: Ask how the advisory fee is calculated and what services are included. The cost should be clear before you enter the advisory relationship.
      3. Check the Scope of Services: Some advisers focus mainly on investment portfolios, while others provide broader financial planning. Choose according to the support you actually require.
      4. Understand the Advisory Process: Ask how recommendations are selected. Your goals, liabilities, existing investments, time horizon, and risk profile should form part of the assessment.
      5. Avoid Guaranteed Returns: RIA registration does not remove investment risk. Be cautious of anyone promising guaranteed market returns or presenting future investment performance as certain.
      6. Read the Agreement: Review fees, services, responsibilities, termination conditions, and grievance procedures before signing the advisory agreement.

      Read Also: Stable Value Fund: Meaning, Benefits, Risks & How It Works

      Final Thoughts

      Understanding what is RIA in mutual fund investing helps you know who is providing advice and helps you invest better. If you prefer researching and managing investments yourself, Pocketful can help. Open a demat account here and get the details you need. Analyse your goals, risk, and return needs and invest better.

      S.NO.Check Out These Interesting Posts You Might Enjoy!
      1SIF Regulations in India
      2Smart SIP: Meaning, How It Works, Benefits & Risks
      3Power SIP: Meaning, How It Works, Benefits & Risks
      4Mutual Fund Churning: Meaning, Causes, Risks & How to Avoid
      5What is STP in Mutual Funds?

      Frequently Asked Questions (FAQs)

      1. What Is RIA Full Form in Mutual Fund Advisory?

        The RIA full form in mutual fund advisory is Registered Investment Adviser. It refers to an individual or eligible entity registered under SEBI’s Investment Advisers framework to provide investment advice.

      2. How Is an RIA Different From a Mutual Fund Distributor?

        An RIA primarily provides investment advice and charges clients advisory fees. A mutual fund distributor primarily distributes mutual fund schemes and may earn commissions associated with regular plans.

      3. What Fee Can an RIA Charge?

        For applicable individual and HUF clients, an RIA can use the AUA or fixed-fee model within SEBI’s prescribed limits. Under the AUA model, the maximum fee is 2.5% per annum per family of client.

      4. What Is RIA Code in Mutual Fund Documents?

        The phrase what is RIA code in mutual fund generally refers to the SEBI registration details of a Registered Investment Adviser. Investors can use these details to verify the adviser’s registration status.

      5. Does RIA Mean Something Different in Banking?

        No. The RIA full form in banking generally remains Registered Investment Adviser. However, banks can provide both advisory and distribution services, so check which type of service you are receiving.

    2. Federal Reserve Interest Rate: Impact on India & Markets

      Federal Reserve Interest Rate: Impact on India & Markets

      Rates set by the US Fed don’t just affect America, the ripple effects reach global markets everywhere. In this piece, we look at what drove the Fed’s September 2026 decision, how it plays out for US and Indian stocks, the rupee, gold, and FII money, alongside the main indicators you should track from here. 

      Federal Reserve Interest Rate: What Does It Mean? 

      Every time the Fed changes interest rates, financial markets get a bit jumpy. It all starts with the federal funds rate, the go-to benchmark for quick overnight loans between US banks. The FOMC decides where this rate should sit, setting the official target at 3.75%-4.00% back in September 2026.

      What Is the Federal Funds Rate?

      Think of it like this: when US banks run short on cash at the end of the day, they borrow from each other overnight. The interest tag on those quick loans is the federal funds rate. When the Fed moves this target, it ripple-effects through the whole economy, directly changing what people pay to borrow money.

      Why Does the Fed Change Interest Rates?

      The Fed tweaks rates to match whatever the economy is doing. When inflation gets out of hand, they raise rates so people and businesses spend less. But if the job market cools off or growth stalls, they drop rates to get money moving again. In short, every rate decision is just a direct reaction to job reports, inflation numbers, and fresh economic data.

      What Does the Fed’s Latest Rate Outlook Say for 2026? 

      Along with raising rates at the September meeting, the Fed also signaled its future policy stance. However, this should not be viewed as a definitive decision; the Fed could alter its course based on upcoming data regarding inflation, employment, and the economy.

      Signal for One More Rate Hike

      Looking at the Fed’s latest forecasts, the average expectation puts the rate at 4.1% by the end of 2026. Right now, rates sit between 3.75% and 4.00%, which basically means we could see one more 0.25% hike ahead. Reuters also pointed out that 16 out of 18 Fed members are expecting at least one more rate increase before the year wraps up.

      Fed OutlookSeptember 2026
      Current target range3.75% – 4.00%
      2026 median projection4.1%
      2027 median projection4.1%
      2028 median projection3.9%
      Long-run median3.2%

      How Federal Reserve Interest Rates Affect Financial Markets 

      Even a slight change in the Fed’s interest rates sparks significant discussion in the market. The reason is clear: US monetary policy impacts global money flows.

      1. Impact on the US Stock Market

      Higher interest rates mean higher borrowing costs for businesses, which can easily squeeze earnings and make company growth a lot harder. Growth stocks usually take the biggest hit here, mainly because their current stock prices depend so much on the big profits people hope they’ll make in the future. 

      2. Impact on the US Dollar

      When Fed rates remain high, returns on US investments can become comparatively attractive, potentially supporting demand for the dollar. Significant movements in the dollar can also alter foreign investment flows into emerging markets like India.

      3. Impact on Bond Yields

      The bond market often reacts immediately to Fed announcements. Close attention is paid to 2-year and 10-year US Treasury yields; movements in these yields reveal how investors perceive the future trajectory of interest-rate policy.

      4. Impact on Gold Prices

      Gold does not generate interest, whereas bonds can provide interest income; consequently, rising bond yields can put pressure on gold prices. However, the dynamics of gold are complex—factors such as the dollar, inflation, and geopolitical tensions also influence its price.

      5. Impact on Emerging Markets

      When US interest rates climb, a lot of global investors start moving their money back into US assets because they offer safer, better returns. That shift usually hits emerging markets pretty hard, pulling down their stock prices and weakening local currencies. For the Indian market, keeping a close eye on FII buying or selling, the USD/INR exchange rate, and the general mood on Dalal Street right after a Fed announcement tells you almost everything you need to know about where things are heading. 

      Read Also: How Interest Rate Changes Affect the Stock Market

      Federal Reserve Rate Hike Impact on Indian Stock Market 

      A US Fed decision does not directly determine interest rates in India, but it can certainly alter the environment for global investors. Following the 25 bps hike in September 2026, the impact on the Indian market is primarily visible through FII flows, the rupee, and various sectors.

      1. Impact on FII Flows and Indian Equities

      When US interest rates and bond yields remain high, the attractiveness of US assets for foreign investors can increase. This can create pressure for capital outflows from emerging markets. However, attributing FII selling solely to the Fed decision would be incorrect; valuations, earnings, and global risk sentiment also play a role.

      2. Impact on the Indian Rupee

      A strengthening dollar following a Fed move can put pressure on the rupee. An example of this was seen on September 17, 2026, when the rupee weakened to ₹96.08 per dollar. However, the USD/INR exchange rate is not determined by the Fed alone—crude oil prices, capital flows, and RBI actions also play significant roles.

      3. Which Indian Sectors Can Be Sensitive?

      The impact is not uniform across all sectors. When analyzing Fed policy, it is particularly useful to keep an eye on the following areas

      Sector What to Watch
      ITUS demand and rupee movement
      Banks & NBFCsFunding cost and liquidity conditions
      Real EstateLoan rates and financing demand
      AutoConsumer credit and financing costs
      MetalsThe dollar and global growth

      What Fed Rate Changes Mean for Indian Traders and Investors 

      If you trade or invest in India, just keeping an eye on Wall Street after a Fed announcement isn’t going to cut it. To really get what’s happening, you need to track a few specific signals that hit our market both directly and behind the scenes.

      Key Indicators to Track After the FOMC Decision

      • US Treasury Yields: Keep an eye on 2-year and 10-year yields. They give you a clear look at what big money expects rates to do down the line.
      • Dollar Index (DXY): You need to know if the US dollar is getting stronger or weaker, because any major shift spills right over into emerging markets like ours.
      • USD/INR: Watch the rupee closely. Whenever the dollar shoots up fast, it puts immediate pressure on the Indian currency.
      • FII Activity: See whether Foreign Institutional Investors are buying or dumping Indian assets. It shows you how global funds are pitching their bets in India.
      • Nifty 50 and Sensex: At the end of the day, watch how our own benchmark indices actually digest all these global cues.

      Why Market Expectations Matter So Much

      Markets usually price in a Fed rate decision long before it actually happens. That’s why just checking whether they raised or cut rates on the day isn’t enough. How the market reacts usually comes down to the Fed’s commentary about the future and the latest economic data that follows.

      Read Also: How to Start Stock Market Trading With Low or Limited Capital

      Conclusion

      At the end of the day, whatever the Fed does with interest rates never stays inside the US. It directly impacts global markets, the dollar, gold, and Indian stocks. Because of this, you can’t just look at a single rate update, you have to pay attention to where policy is heading next, how the market is reacting, and what global signals are telling us. 

      Frequently Asked Questions (FAQs)

      1. What is the Federal Reserve interest rate?

        It is the benchmark rate for overnight bank lending in the US, with a target range determined by the FOMC.

      2. What is the current Fed interest rate?

        Following the latest decision in September 2026, the target range is 3.75%–4.00%.

      3. Why does the Fed change interest rates?

        The Fed primarily adjusts rates based on the prevailing conditions regarding inflation and employment.

      4. How do Fed rate changes affect Indian stocks?

        They can impact Indian stocks through global fund flows, dollar movements, and investor sentiment.

      5. Does a Fed rate hike always hurt the Indian stock market?

        No. Market reaction also depends on expectations, Fed guidance, and other global factors.

    3. Target Maturity Funds: Meaning, Benefits, Risks & Tax

      Target Maturity Funds: Meaning, Benefits, Risks & Tax

      If you need funds at a specific time, looking solely at returns is not enough when choosing an investment. Target Maturity Funds are designed with this in mind, as they mature on a specific date. However, these are not guaranteed-return products. In this blog, we will explore how they work, how to invest in them, and the factors to consider before making a decision.

      What is a Target Maturity Fund? 

      A Target Maturity Fund is a type of passive debt mutual fund that tracks a debt index with a specific maturity date. Its portfolio may include G-Secs, SDLs, or other eligible debt securities, in line with the index. Its objective is to generate returns close to the index’s performance, though returns are not guaranteed.

      Example: Suppose you need money for a home down payment in 2030, you could consider a Target Maturity Fund with a target date close to your goal. The fund holds debt securities that mature around that time. However, the exact amount you will receive upon staying invested until 2030 is not predetermined.

      What Does “Target Maturity” Actually Mean? 

      Here, “target” refers to the time when the fund’s underlying securities approach maturity. Therefore, when selecting a fund, an investor should consider their required timeframe alongside the fund’s target date. If funds are needed in 2031, it may not be practical to choose a fund maturing in 2036 simply because it offers higher returns.

      How Does a Target Maturity Fund Work? 

      The easiest way to understand a Target Maturity Fund is to view it as a debt investment with a fixed timeframe. It operates in a step-by-step manner as follows:

      1. The fund selects a target date

      Initially, the fund tracks a debt index with a specific maturity date such as an index maturing in 2030 or 2032. SEBI has established a standard framework for Target Maturity Debt Indices.

      2. Securities within the index are determined

      Based on the index’s methodology, it may include securities such as G-Secs (Government Securities), SDLs (State Development Loans), or eligible AAA-rated bonds. The specific securities included depend on the type of index.

      3. The fund follows that specific index

      The fund manager does not engage in aggressive buying and selling based on personal preference. The fund’s primary objective is to track the performance of the underlying index, although minor tracking differences may occur due to expenses and other factors.

      4. Securities are generally held until maturity

      Target Maturity Funds typically adopt a “buy-and-hold” approach. This means the aim is to hold the portfolio’s debt securities until maturity, although adjustments may occur due to needs like redemptions or portfolio rebalancing.

      5. Proceeds can be reinvested upon security maturity

      If a security in the portfolio matures before the target date, the proceeds can be reinvested in accordance with the fund’s index methodology. This ensures the portfolio remains aligned with the target maturity.

      6. Portfolio maturity decreases as the target date approaches

      As time passes, the remaining maturity of the portfolio draws closer to the target date. Consequently, it is essential for investors to align their financial goals’ timeline with the fund’s target maturity date.

      Types of Target Maturity Funds

      Target Maturity Funds can be distinguished based on their underlying debt securities. SEBI’s standard framework includes target maturity indices based on G-Secs, SDLs, AAA-rated bonds, and combinations thereof.

      Type What does the fund contain?The important point to understand about this
      G-Sec Target Maturity FundCentral Government Securities and, in some cases, T-Bills.The primary focus here is on government securities.
      SDL Target Maturity FundState Development Loans (SDLs)It includes debt securities issued by various states.
      AAA Bond Target Maturity FundAAA-rated bondsIt involves exposure to high-rated corporate or eligible bonds; therefore, it is essential to consider the issuer and credit quality.
      G-Sec + SDL FundGovernment Securities + SDLsThe portfolio is spread across both types of government-backed securities.
      AAA Bond + SDL FundAAA-rated bonds + SDLsIt consists of a combination of corporate debt and state government securities.
      AAA Bond + G-Sec FundAAA-rated bonds + G-SecsThis provides a mix of corporate and central government securities.
      AAA Bond + SDL + G-Sec FundA combination of the three.The portfolio has exposure to three distinct debt segments; the exact allocation depends on the index.

      Read Also: Best Target Maturity Mutual Funds

      Key Features of Target Maturity Funds 

      Certain key features distinguish Target Maturity Funds from other debt mutual funds. Understanding these aspects helps in better grasping the fund’s structure and practical functioning before investing.

      • Passive Investment Approach: These funds track a specific debt index. The fund manager’s primary objective is to mirror the index’s performance. Consequently, they do not involve the continuous security selection characteristic of active funds.
      • Defined Maturity Date: Each Target Maturity Fund is based on an index with a specific maturity date. This allows investors to select an option that aligns with the timeline of their financial goals.
      • Pre-defined Portfolio Structure: The fund’s underlying index dictates the types of debt securities included in the portfolio. These may comprise G-Secs, SDLs, or eligible bonds; therefore, it is essential to review the index composition before investing.
      • Choice Between ETFs and Index Funds: The target maturity strategy is available in both ETF and index fund formats. ETFs trade on stock exchanges, whereas units of index funds are purchased and redeemed through the Asset Management Company (AMC).
      • Returns Do Not Exactly Match the Index: The fund’s performance may differ slightly from that of the underlying index. Factors such as the expense ratio, transaction costs, and portfolio management can lead to a “tracking difference.”
      • No Guaranteed Returns: The existence of a defined maturity date does not imply that the return or final amount is fixed in advance. A mutual fund’s Net Asset Value (NAV) fluctuates based on market conditions.

      Benefits of Target Maturity Funds 

      The benefit of Target Maturity Funds extends beyond just their fixed maturity date. When the right fund is selected for the right objective, it can serve as a structured investment option within a debt portfolio.

      • Ease of Investment Planning: If you know approximately when you will need funds in the future, choosing a target maturity fund can simplify your planning. This allows you to align the investment timeline with your financial goals.
      • Exposure to Multiple Securities in the Portfolio: Instead of purchasing a single bond, investing through the fund provides exposure to multiple eligible securities included in the index. This reduces reliance on any single security.
      • Easier Understanding of Interest Rate Impact: The prices of debt securities are influenced by changes in interest rates. The target maturity structure offers investors a clear reference point regarding the portfolio’s intended maturity period.
      • Better Visibility of Costs: Since these are passive funds, factors such as the expense ratio and tracking difference can be easily compared during the selection process. While lower costs do not automatically guarantee better returns, they serve as a useful factor for comparison.
      • Options Across Various Debt Categories: Depending on investor needs, target maturity options based on G-Secs, SDLs, or high-rated bonds are available. This offers the flexibility to select a category that suits the specific requirements of the portfolio.

      Risks of Target Maturity Funds 

      Risk is not entirely eliminated in Target Maturity Funds. Factors such as interest rates, bond quality, and market liquidity, particularly within the debt market, can influence the fund’s NAV and actual returns.

      • Interest Rate Risk: If market interest rates rise, the market value of existing fixed-rate bonds typically falls. This can impact the fund’s NAV.
      • Credit Risk: If the portfolio includes corporate bonds, there is a risk of default by the issuer regarding interest or principal payments. Therefore, relying solely on a bond’s credit rating does not mean risk has been completely eliminated.
      • Liquidity Risk: Not every debt security can be easily sold in the market. Low trading volumes can mean it takes longer to sell a security or that it must be sold at a price lower than expected.
      • Tracking Difference: The return of the index tracked by the fund and the fund’s actual return may not be identical. Discrepancies can arise due to factors such as expenses, cash holdings, and portfolio adjustments.
      • Risk of Premature Withdrawal: If an investor needs to sell their investment before the target date, the payout will be based on the NAV at that time. Returns could be lower than expected if market conditions are unfavorable. Therefore, it is essential to assess your liquidity needs before choosing a target maturity fund.

      Target Maturity Fund vs FD: Which One is Better? 

      The objectives of the two may differ, so it would not be right to determine which is better based solely on the returns. A Target Maturity Fund is a market-linked mutual fund, whereas an FD is a bank deposit.

      Feature Target Maturity FundBank FD
      Product typeDebt mutual fundsBank deposit
      ReturnMarket-linked; not fixedAs per the rate determined at the time of opening the deposit.
      Capital protectionNot guaranteedDICGC insurance applies to eligible bank deposits.
      NAV/ValueIt changes according to market conditions.The principal amount of an FD does not have a daily market NAV.
      Interest-rate impactBond prices can impact the NAV.The agreed interest rate on an FD generally remains fixed for the tenure.
      MaturityIt tracks an index with a target maturity date.Based on the selected fixed tenure
      Early withdrawalRedemption is possible, but the amount received will be based on the NAV at that time.Premature withdrawal depends on the bank’s rules and the applicable penalty or adjustment.
      Deposit insuranceDICGC insurance coverage is not available.Eligible bank deposits have insurance cover of up to ₹5 lakh, including both principal and interest.
      Return guaranteeNoInterest is earned based on the FD rate, but bank-specific terms apply.

      How to Invest in Target Maturity Funds? 

      Investing in a Target Maturity Fund is not difficult, but it is essential to consider your needs and the scheme’s details before making a choice. You can follow these steps to invest correctly:

      Step 1: Define Your Financial Goal

      First, determine the purpose and timing of your financial requirement, such as for education, a home down payment, or any other planned expense.

      Step 2: Choose the Right Maturity Date

      Look for a scheme with a target maturity date that aligns with your financial goal’s timeline. Selecting a fund solely based on the longest or shortest maturity period is not advisable.

      Step 3: Check the Underlying Index

      Verify which index the fund tracks. This will help you understand the types of debt securities that make up the scheme’s portfolio.

      Step 4: Assess Portfolio Quality

      Examine the composition of the portfolio specifically, whether it includes G-Secs, SDLs, or corporate bonds, and in what proportions. This helps in understanding the fund’s credit exposure.

      Step 5: Understand YTM

      Yield to Maturity (YTM) indicates the potential yield from the securities held in the portfolio. Do not mistake this for a guaranteed future return, as the actual return may vary.

      Step 6: Compare Costs and Tracking Difference

      Check the expense ratio and the fund’s tracking difference. Comparing how the passive fund’s actual performance differs from the index provides useful information.

      Step 7: Read Scheme Documents and the Riskometer

      Review the Scheme Information Document (SID) and the Riskometer before investing. These documents clarify the scheme’s investment objective, risks, and other important conditions.

      Step 8: Choose Between an ETF and an Index Fund

      If it is a Target Maturity Index Fund, it can be purchased through a mutual fund platform or an Asset Management Company (AMC). If it is an ETF, its units are traded on stock exchanges and are typically bought and sold via a demat account.

      Taxation of Target Maturity Funds 

      An easy way to understand the taxation of Target Maturity Funds is to look at how the capital gain realized upon redemption is treated. Starting from the 2025-26 financial year, debt-oriented mutual funds that meet the conditions of Section 50AA fall under the category of ‘Specified Mutual Funds.’ Gains from such funds are classified as short-term capital gains regardless of the holding period and are taxable at the investor’s applicable income-tax slab rate.

      Read Also: Debt Mutual Funds: Meaning, Types and Features

      Conclusion

      Target Maturity Funds can be a really practical debt option for reaching specific financial goals if you invest with a clear understanding. Just make sure you keep an eye on things like fund maturity, portfolio mix, and risk before choosing one. Picking the right fund that fits your personal needs is what actually matters most. 

      S.NO.Check Out These Interesting Posts You Might Enjoy!
      1Best Long-Term Mutual Funds to Invest in India
      2Best Investment Plan for Monthly Income in India
      3Best Gilt Mutual Funds in India
      4Best Precious Metal Mutual Funds to Invest in India
      5Best SWP for Monthly Income in India

      Frequently Asked Questions (FAQs)

      1. What is a Target Maturity Fund?

        It is a passive debt mutual fund that tracks a debt index with a fixed maturity date.

      2. Is a Target Maturity Fund risk-free?

        No. It carries risks such as interest-rate, credit, and liquidity risks.

      3. How does a Target Maturity Fund work?

        It invests in debt securities in line with its underlying index and adheres to that index’s maturity timeline.

      4. Can I withdraw money before maturity?

        Yes, since it is an open-ended scheme, redemption is generally possible. However, the payout will be based on the prevailing NAV at the time.

      5. Are returns guaranteed in a Target Maturity Fund?

        No. The target maturity date is fixed, but the returns are not.

    4. UPI MDR 2026: Charges & Rules Explained

      UPI MDR 2026: Charges & Rules Explained

      There is considerable discussion regarding UPI MDR charges. However, this does not mean that a charge will now apply to every UPI payment. The new rules will apply to certain merchant payments, while a different MDR rate has been set for stock market and capital-market payments. In this context, it is important for investors and traders to understand what the UPI MDR 2026 entails and how it might impact their transactions.

      What Is UPI MDR? 

      UPI MDR stands for Merchant Discount Rate. Simply put, it is a charge applicable to certain UPI merchant payments within the payment ecosystem. It is incorrect to view this as a UPI transaction fee, as there is no provision to charge the MDR separately to the customer. Under the new framework, it will apply only to specific merchant transactions, while Person-to-Person UPI payments will remain free. The revenue generated from MDR will be utilized within the UPI ecosystem for needs such as payment infrastructure, cybersecurity, innovation, and customer service.

      What Are the New UPI MDR Rules From October 15, 2026? 

      Under the new UPI MDR framework, not every transaction will incur a charge. Starting October 15, 2026, an MDR of 0.4% will apply to eligible Person-to-Merchant (P2M) transactions exceeding ₹2,000, subject to a maximum cap of ₹300 per transaction. Meanwhile, P2M payments up to ₹2,000 and Person-to-Person (P2P) transfers will remain free. A zero-MDR regime will also continue for certain small merchants.

      UPI TransactionMDR Treatment
      Person to PersonNo MDR
      P2M up to ₹2,000No MDR
      Eligible P2M above ₹2,0000.4%
      Eligible P2M ₹75,000 or aboveMaximum ₹300
      Capital-market payments0.02%, maximum ₹300

      An important point to note here is that an MDR of 0.4% does not mean charging the customer 0.4% directly. This is a charge applicable within the merchant-side payment ecosystem, and banks/payment providers have been instructed not to pass it on to the customer separately.

      For example, if an eligible merchant receives a UPI payment of ₹10,000, the MDR at a rate of 0.4% would be ₹40. However, sending ₹10,000 to a friend would not incur any MDR. This is the key difference between P2M and P2P transactions.

      Read Also: Explainer on UPI Scams

      Will Customers Have to Pay UPI MDR? 

      Under the new framework, the direct burden of the UPI MDR cannot be passed on to the customer. This means you will not have to pay any separate amount as MDR when making a payment; instead, the MDR will be treated as a merchant-side cost within the payment ecosystem. Therefore, it is important to distinguish between the payment amount displayed and the MDR. This also dispels the misconception that customers will be charged extra for every large UPI payment.

      UPI MDR for Stock Market Transactions: What Investors Need to Know 

      In the stock market, UPI is used for various types of financial payments. Therefore, it would not be correct to view the new MDR framework solely from the perspective of standard merchant payments.

      1. UPI Payments via Stock Brokers

      When an investor uses UPI with their broker, it is important to understand the nature of the payment. Eligible capital-market payments involving brokers do not attract the standard 0.4% MDR (Merchant Discount Rate) applicable to merchant payments exceeding ₹2,000; instead, they fall under the 0.02% rate designated for the capital-market category.

      2. Adding Funds to a Trading Account

      A common use of UPI is transferring funds into a trading account. Here, it is incorrect to equate the MDR with brokerage charges; payment processing and the actual share trade are distinct activities. Brokers have raised concerns that if a client frequently transfers funds without executing trades, the payment-processing costs for the broker could rise.

      3. Impact on Stock Investments

      A rate of 0.02% has been set for eligible UPI payments related to stocks and securities. This indicates that capital-market payments are treated differently to ensure that investing via digital payments remains convenient.

      4. Mutual Fund Investments and SIPs

      Mutual fund payments also fall under the capital-market category. However, SIPs and standard one-time payments should not be viewed in the same light. SIP payments processed via UPI AutoPay or recurring mandates receive different treatment; according to reports, the prescribed transaction MDR will not apply to them.

      5. UPI AutoPay and Mandates

      With UPI AutoPay, the investor authorizes a mandate upfront, and the payment is subsequently processed automatically on the scheduled date. Consequently, it is not treated the same as a manually initiated UPI payment. This distinction is particularly significant for recurring investments like SIPs.

      Understand the different investment payments this way.

      Payment TypeReported Treatment
      Stock broker-related eligible payment0.02% MDR, max ₹300
      Securities-related payment0.02% MDR, max ₹300
      Mutual fund one-time payment0.02% MDR, max ₹300
      UPI AutoPay SIPExcluded from Prescribed MDR transaction charges
      P2P fund transferNo MDR

      Understanding the 0.02% MDR through calculation

      If an MDR of 0.02% applies to an eligible capital-market payment, the calculation would be as follows

      Payment Amount0.02% MDR
      ₹5,000₹1
      ₹10,000₹2
      ₹50,000₹10
      ₹1,00,000₹20
      ₹10,00,000₹200
      ₹15,00,000₹300*

      0.02% on ₹15 lakh = ₹300, and the applicable MDR on amounts above this will also remain capped at ₹300.

      UPI MDR vs Brokerage Charges What’s the Difference? 

      UPI MDR and brokerage are two different types of charges. One is related to payment processing, while the other can be the cost of trading through a broker.

      BaseUPI MDRBrokerage
      What is?A merchant discount rate applied within the payment ecosystemA charge levied by a broker for applicable trading services
      What is it related to?Eligible UPI paymentsTrades in stocks, F&O, and other applicable segments
      Capital-market rate0.02%, capped at ₹300 per transactionVaries by broker and trading segment
      When can it apply?On applicable UPI paymentsOn applicable buy/sell transactions
      Are they the same charge?NoNo 
      What does it mean for investors?A payment-processing costA cost associated with trading services

      What Does UPI MDR Mean for Traders and Investors? 

      For those making payments to investment and trading accounts via UPI, the impact will depend on the type of transaction.

      1. For Stock Investors

      If you add funds to your broker account using UPI, the payment may fall under the ‘capital market’ category; consequently, it will be treated differently than a standard merchant payment.

      2. For Active Traders

      For traders who frequently add funds to their trading accounts, payment processing costs at the broker level could be a relevant factor. However, it would be incorrect to classify this directly as a trading or brokerage charge.

      3. For Mutual Fund Investors

      It is important to distinguish between one-time UPI payments and SIP payments made via UPI AutoPay for mutual funds, as they are treated differently under the prescribed MDR framework.

      Why Is UPI MDR Being Introduced? 

      The purpose of UPI MDR is not merely to levy a charge; its framework was introduced to support the costs and future investments of the payment ecosystem.

      1. UPI Infrastructure: The payment infrastructure requires continuous maintenance and upgrades to keep pace with the growing volume of UPI transactions.
      2. Technology Investment: Constant investment is required for new payment technologies and enhanced transaction processing capabilities.
      3. Cybersecurity: Ongoing expenditure is necessary to maintain robust fraud prevention and cybersecurity systems.
      4. Payment Ecosystem Sustainability: MDR creates a source of transaction-linked revenue for banks, payment apps, and other ecosystem participants.
      5. Better Customer Support: Maintaining the reliability of the large-scale UPI network entails expenses related to customer service and operational support.

      Read Also: Best UPI Apps in India

      Conclusion

      Understanding UPI MDR 2026 is essential for investors and traders. Not every UPI payment will incur a charge, and a separate MDR rate has been set for capital-market payments. Therefore, it is important to understand the transaction type and applicable charges when making payments via UPI for investment or trading accounts.

      S.NO.Check Out These Interesting Posts You Might Enjoy!
      1Fake Payment Screenshot Scam: How to Identify and Avoid It
      2How to Register a UPI Complaint?
      3How to Transfer Money from a Trading Account to a Bank Account?
      4NEFT vs RTGS vs UPI vs IMPS: A Comparative Study
      5Best RuPay Credit Cards in India

      Frequently Asked Questions (FAQs)

      1. What is UPI MDR 2026?

        UPI MDR 2026 is a payment processing charge applicable to specific merchant and capital-market UPI transactions.

      2. Will UPI MDR be charged on every UPI payment?

        No. MDR will not be charged on every UPI payment; its applicability depends on the type of transaction.

      3. What is the UPI MDR for capital-market payments?

        The MDR for capital-market UPI payments is set at 0.02%, with a maximum limit of ₹300 per transaction.

      4. Will investors pay UPI MDR separately?

        No. There is no provision to charge MDR separately to the customer.

      5. Is UPI MDR the same as brokerage?

        No. UPI MDR is related to payment processing, whereas brokerage is a charge applicable to trading services.

      6. Does UPI MDR apply to SIP payments?

        The treatment of SIP and UPI AutoPay transactions may differ from standard merchant UPI payments. Applicable rules depend on the transaction type.

      7. Does UPI MDR apply to stock brokers?

        The prescribed MDR framework may apply to eligible UPI payments falling under the capital-market category.

    5. Convexity in Options Trading: Meaning, Benefits & Risks

      Convexity in Options Trading: Meaning, Benefits & Risks

      The stock market often operates on simple rules. If an asset moves up by a single point, the profit increases by a single point. Derivatives operate on an entirely different engine. They have a hidden gear that accelerates returns at a rapid pace. Mastering this hidden mechanism separates average market participants from highly successful professionals. Understanding this unique pricing behavior unlocks a new level of strategic thinking in the financial markets. It helps participants navigate uncertain events with absolute clarity.

      What is Convexity in Options

      When investors buy a regular stock, the profit structure is a straight line. If the stock goes up by ten points, the profit is exactly ten points. This simple ratio is called a linear payoff.The derivatives market operates quite differently. The profit and loss curve is not a straight line at all. Instead, as the underlying asset moves in a favorable direction, the profit starts to grow at a much faster rate.

      This accelerating and curved relationship between price movement and profit is known as option convexity. To put it simply, small favorable price moves might bring very small gains. However, large favorable price moves can generate massive gains that multiply rapidly.

      This powerful acceleration is what makes convexity options highly attractive to many market participants. It acts like a multiplier effect on returns. As the underlying stock gains momentum, the financial reward increases non-linearly. The more the market moves, the faster the profits can grow. This concept is very closely tied to a metric called gamma.

      Why Convexity is Important

      Understanding this concept is crucial for anyone stepping into the derivatives segment. It completely changes how market participants calculate their potential returns. Without this knowledge, traders are simply guessing the market direction.

      Here is why options convexity holds so much importance in modern trading:

      • Unmatched Risk to Reward Ratio: For buyers, the maximum possible loss is strictly limited to the premium paid on day one. However, if the market moves fast, the potential reward expands rapidly.
      • Benefit from Speed and Timing: In regular stock trading, getting the direction right is enough to make a profit. In derivatives, the speed of the movement matters just as much. Fast movements make the profits multiply quickly.
      • Advantage of Volatility: When market uncertainty rises, contract premiums naturally increase. Buyers benefit heavily from this expanding volatility because it directly fuels the acceleration of their profits.
      • Protection During Reversals: If a trade goes wrong, the curve flattens out on the losing side for buyers. The losses slow down as the market moves further away. This mathematical advantage provides peace of mind.
      • Strategic Edge with Technology: Market participants can use advanced tools on platforms like Pocketful to analyze data carefully. This allows them to select the best strike prices and capture the maximum benefit without guesswork.

      Impact on the Trader’s Psychology

      Trading with a non-linear instrument completely shifts how a person thinks and reacts. A traditional stock investor only worries about the direction the stock will go. They simply want to know if the asset will go up or down.

      This concept impacts market psychology in the following specific ways:

      • Multi-Dimensional Thinking: Traders stop asking just if the market will go up. They analyze how far it will go, how fast it will move, and how volatility is currently priced.
      • Focus on Probabilities: Instead of making rigid predictions, professionals think in terms of probability distributions. They look at all possible outcomes rather than guessing a single future price.
      • Patience for the Right Setup: Because timing and speed are so important, market participants learn to wait for explosive setups. They avoid trading in quiet and slow-moving markets that slowly drain their funds.
      • Managing Expectations: Traders learn that being right about the market direction is not always enough. If the price move is too slow, profits might not materialize at all. This teaches them to deeply respect the element of time.
      • Emotional Stability: Understanding the mathematical curve reduces panic. Traders know exactly how much they can lose and how fast they can win. This clarity removes emotional decision-making from the process.

      Read Also: What is Commodity Pool Operator (CPO)?

      Risk Management and Convexity

      Proper risk management is the lifeline of a successful financial journey. Because the payoff is curved, the risk profile looks very different depending on the chosen side of the trade.

      Platforms such as Pocketful provide advanced option chains and real-time data. These tools help users manage these exact risks seamlessly without complicated calculations.

      Market RoleImpact of the Curved PayoffRisk Management Approach
      Option BuyersExperience positive convexity. Upside is theoretically unlimited as profits accelerate with fast market moves.Risk is naturally limited to the premium paid upfront. Focus remains on picking the right timing and capturing volatility expansion.
      Option SellersExperience negative convexity. Maximum profit is capped at the premium collected, while losses can multiply rapidly.Must obsessively protect accounts against rare extreme movements. Focus shifts to strict stop-loss orders, position sizing, and managing tail risk.

      For buyers, the strategy revolves around finding cheap premiums before a major event. They accept small regular losses in exchange for the chance of a massive accelerating gain.

      For sellers, the game is entirely different. They win small amounts very frequently. However, a single massive price movement can wipe out months of hard work.

      They must use strict hedging techniques to survive. They cannot rely on hope when the market starts moving fast against them. Both sides require absolute discipline. The mathematical curve punishes those who ignore basic risk management rules.

      Convexity in Market Shocks

      Extreme market events highlight the true power of non-linear pricing. During massive global shocks like the recent pandemic crash, regular stock portfolios saw steady declines. However, the derivatives market experienced violent, unprecedented swings. Buyers holding long put contracts saw their investments multiply enormously in just a few days. The curved payoff structure turned small premiums into massive fortunes due to the sheer speed of the market fall. Conversely, unprepared sellers faced catastrophic, accelerating losses that wiped out trading accounts overnight. Proper preparation, strict position sizing, and volatility tracking remain the only solid defenses during a sudden market shock.

      Conclusion

      Understanding non-linear payoffs adds a fascinating layer of strategy to the financial markets. It requires a mental shift from simple directional guessing to a more mature analysis of speed and volatility.

      Neither buying nor selling is universally better than the other. Each approach offers unique advantages and demands very specific risk management skills. The market provides opportunities for both styles depending on the current economic conditions.

      With modern platforms like Pocketful, tracking essential data of options convexity and executing strategies is highly efficient. They provide the exact tools needed to measure these complex market forces in real-time.

      S.NO.Check Out These Interesting Posts You Might Enjoy!
      1Best Penny Stock Trading Platforms, Brokers & Apps
      2What Is Cash Trading? Meaning, How It Works & Benefits
      3Bid Price and Ask Price: Key Differences
      4Minimum Capital Required for Options Trading in India
      5Slippage in Trading: Meaning, Types, Causes & How to Reduce It

      Frequently Asked Questions (FAQs)

      1. What is convexity in options?

        It is the non-linear relationship between price movement and profit. Favorable rapid moves cause profits to accelerate quickly.

      2. What are the main benefits of convexity?

        Buyers get a strictly defined maximum loss combined with an accelerating, theoretically unlimited profit potential if the market moves fast.

      3. How convexity is it used in trading?

        Traders buy contracts before expected high-volatility events to capture accelerating profits from sudden and explosive price movements.

      4. Why does convexity matter for risk?

        It defines tail exposure. Sellers face capped profits but rapid losses, requiring strict stop-losses during unexpected market shocks.

      5. Which tools help track this data?

        Platforms like Pocketful provide real-time advanced chains and data, allowing users to accurately measure and manage their market exposure.

    6. What Is a Black Swan Event?

      What Is a Black Swan Event?

      The global economy can be completely changed in just a single day by a sudden news update being announced. The stock market turns red, stock prices tumble, and panic spreads rapidly across trading floors. Standard financial models fail to predict this sudden crash, leaving even the most experienced investors caught off guard. Surviving these extreme market shocks requires preparation, a calm mindset, and robust risk management strategies. Careful planning protects capital during unexpected chaos and helps maintain financial stability.

      What Is a Black Swan Event in the Financial Market

      A black swan event is a highly rare and unpredictable occurrence that has a massive impact on the economy. These shocks fall far outside the normal expectations of historical data. Standard financial forecasting models usually fail to predict them because they rely entirely on past trends.

      When exploring financial markets, beginners often ask what a black swan event is and how it affects their capital. In simple terms, it is an extreme market shock. To fully grasp what a black swan event is, one must look at its main features.

      • It is extremely rare.
      • Causes severe economic damage or creates massive price swings. 

      These occurrences bring sudden spikes in market volatility. 

      Historical Examples of Black Swan Events

      History shows that markets are vulnerable to sudden global shocks. Looking at past crashes helps traders prepare for future uncertainty. A true black swan event in stock market history always leaves a lasting mark on the economy.

      Some major examples are given here:

      • The 2008 Global Financial Crisis: A worldwide banking crisis was caused by the collapse of the housing market. Massive wealth was seen to be wiped out across the world’s stock markets. This happened as liquidity dried up completely.
      • The 2020 COVID-19 Pandemic: Strict lockdowns were forced by the sudden spread of the coronavirus. A massive global sell-off was triggered by the uncertainty. In March 2020, a violent crash in indices was seen. The Indian markets were gripped by extreme panic.
      • The 1998 LTCM Collapse: A highly successful hedge fund was what Long-Term Capital Management was. However, their risk models had failed. This was caused by the unexpected Russian debt default.
      • The 2004 Indian Tsunami: Markets can also be shocked unexpectedly by natural disasters. Supply chains were disrupted by the devastating tsunami. It is showed by this how trading floors are rippled by non-financial events. The severity of a black swan in stock market history can be illustrated. The major index drops during the 2020 crash should be observed here:
      Event DateIndexDaily DropMarket Reaction
      March 9, 2020Dow Jones-7.79%Worst single-day crash in history at that time
      March 12, 2020BSE Sensex-8.18%Lower circuit triggered
      March 16, 2020Dow Jones-12.93%Extreme global sell-off

      Common Option Strategies for Black Swan Events

      During market crashes, normal trading strategies often fail. However, options trading provides specific ways to hedge against extreme drops. Traders often use these methods to protect their portfolios.

      • Put Ratio Backspreads: This strategy involves selling options at a higher strike price and buying more lots at a lower strike price. It offers limited risk if the market stays calm but provides massive profit potential if the market crashes violently.
      • Buying Deep Out-of-the-Money Puts: Purchasing deep out-of-the-money put options is a classic defense method. These options are cheap during calm markets but gain massive value when a sudden crash happens.
      • Long Straddles: A trader buys both a call and a put option at the exact same strike price. This strategy profits from massive price swings in either direction.
      • Volatility Index Strategies: The India VIX measures market fear and usually spikes during a market crash. Strategies built around volatility indices can yield high returns when panic sets in.

      Certain strategies must be completely avoided during extreme market stress. Naked option selling can lead to unlimited losses. Using a fast platform like Pocketful helps traders execute protective strategies swiftly using advanced option chain tools.

      Market Psychology of a Trader During Black Swan Events

      A black swan event quickly becomes a psychological test for investors. The sudden loss of wealth triggers intense emotional reactions that ruin logic.

      • Panic Selling: Fear takes over, causing investors to sell holdings at any price to avoid further losses. This herd mentality pushes market prices even lower.
      • Paralysis and Inaction: Some traders freeze when their screens turn completely red. They fail to cut their losses in time because the market moves too fast.
      • Loss of Confidence: Extreme shocks destroy trust in standard financial models. Traders may completely abandon their long-term strategies and shift to safe assets.
      • Margin Call Anxiety: Retail traders with highly leveraged positions face margin calls. The stress of arranging extra funds causes severe mental strain.

      To survive these shocks, maintaining emotional discipline is vital. Panic leads to poor decisions. Relying on pre-set stop losses helps traders stay rational when the broader market gives in to fear.

      What is Tail Risk and How Option Trading is Highly Exposed to Tail Risk

      Tail risk refers to the probability of extreme financial events happening that fall far outside normal expectations. In a standard bell curve of market returns, the ends of the curve are called tails. Tail risk is the danger of rare but devastating losses occurring in those extreme ends.

      Option trading is highly exposed to this specific risk. Many option sellers rely on strategies that generate small, consistent profits during calm markets. They base their trades on the assumption that huge market crashes are impossible.

      However, when a massive shock hits, the options premium explodes. Variables known as option Greeks behave very differently during a crash. Vega risk becomes dominant as implied volatility spikes. Gamma risk also increases drastically, causing the option delta to change faster than a trader can manage.

      For option sellers, an unhedged position during a tail event can wipe out years of accumulated profits in a matter of minutes. Therefore, understanding and pricing this hidden risk is absolutely crucial for anyone trading in the derivatives segment.

      How to Manage Tail Risk in Option Trading

      Managing tail risk is about survival rather than maximizing returns. Traders must protect their capital from complete destruction. Here are four effective ways to manage this risk:

      • Avoid Naked Option Selling: Selling options without a hedge exposes the trader to unlimited risk. Always use risk-defined strategies to put a hard cap on potential losses.
      • Strict Position Sizing: Leverage magnifies losses during extreme market falls. Keeping trade sizes small ensures that a single bad trade does not wipe out the entire account.
      • Maintain Adequate Liquidity: Having spare cash in a portfolio is essential. It prevents the forced liquidation of positions during margin calls.
      • Use Advanced Trading Tools: Fast execution is critical during market panic. The Pocketful trading platform offers a Scalper Mode and real-time tools. These help traders manage risk effectively during high volatility.

      Conclusion

      Periods of extreme uncertainty will always be faced by financial markets. Rare shocks being predicted is impossible. But a natural part of the economic cycle is formed by them. A disciplined approach must be maintained. Proper hedges should be used. Excessive leverage needs to be avoided. Wealth can be protected by investors through this. Pocketful can be used by investors. Your risk of a black swan event is mitigated by it. Ultimately, these rare market events should be viewed as lessons in risk management. A stronger and more resilient investing journey for the future by it.

      Frequently Asked Questions (FAQs)

      1. What is the main meaning of a black swan event? 

        It is an extremely rare, unpredictable market shock that causes severe financial impact.

      2. Can traders find benefits in black swan events? 

        Yes. While they cause panic, prepared traders using strategies like long puts can generate massive profits during the crash.

      3. How to use options during these market shocks? 

        Traders use risk-defined option strategies, like put ratio backspreads, to hedge their portfolios and limit potential downside.

      4. Do standard models predict these events? 

        No. Standard financial models rely on historical data and fail to predict rare and extreme outliers.

      5. How does implied volatility react during a crash? 

        Implied volatility spikes massively, causing the prices of option premiums to explode rapidly.

    7. NSE IPO Day 2: Subscription Status, GMP & Allotment Date

      NSE IPO Day 2: Subscription Status, GMP & Allotment Date

      NSE IPO, one of India’s leading stock exchanges, is launching an initial public offering (IPO) to raise up to ₹22,561.57 crore. The issue opens for subscription on September 17, 2026, and will close on September 21, 2026, with a price band fixed at ₹1,700 to ₹1,785 per share. Since the IPO is entirely an offer for sale (OFS), the company will not receive any proceeds from the issue. The shares are proposed to be listed on the Bombay Stock Exchange (BSE) on September 24, 2026, subject to allotment and necessary regulatory approvals. 

      NSE IPO Day 2 Subscription Status

      On Day 2, NSE IPO witnessed a good investor turnout, closing with an overall subscription of 1.04 times, The Non-Institutional Investors 1.46 times subscription Overall, indicating good participation. Among Non-Institutional Investors (NII), the bNII (above ₹10 lakh) portion was subscribed 1.36 times, while the sNII (less than ₹10 lakh) segment saw 1.68 times subscription. The Retail Individual Investors (RII) category was subscribed 0.69 reflecting healthy retail interest, the issue garnered 20,13,912 applications, with total bids amounting to approximately 16,440.09 crore, showcasing confidence across investor categories in the company’s growth potential.

      Investor CategorySubscription (x)
      Qualified Institutional Buyers (QIB)1.32
      Non-Institutional Investors (NII)1.46
      bNII (above ₹10 lakh)1.36
      sNII (less than ₹10 lakh)1.68
      Retail Individual Investors (RII)0.69
      Employees1.42
      Total Subscriptions1.04

      Total Applications: 20,13,912

      Total Bid Amount (₹ Crores): 16,440.09

      How to Check NSE IPO Allotment Status?

      NSE IPO allotment can be easily checked online in two ways: from the Registrar’s website and from the BSE website. This IPO will be listed on BSE exchanges, so the allotment status will be available to all investors on  BSE platforms.

      Method 1: Registrar’s website (KFin Technologies Limited)

      The most reliable way is to check allotment from the KFin Technologies Limited website.

      How to do:

      • Visit KFin Technologies Limited official website
      • Select “NSE” from the IPO list
      • Enter your details PAN number, Application number, or DP/Client ID
      • Click on Submit
      • You will see the allotment status on the screen.

      Method 2: Check from BSE website

      If there is more traffic on the registrar’s website, allotment status can also be checked from BSE.

      How to do:

      • Visit BSE official website
      • Select ‘Equity’ segment
      • Select “NSE” from the IPO list
      • Enter PAN number and Application number
      • Click on Search

      Objective of the NSE IPO

      For NSE IPO, the issue is a 100% Offer for Sale (OFS) with no fresh issue component. Therefore, the company will not receive any proceeds from the IPO. The entire proceeds of approximately ₹22,561.57 crore  will be received by the selling shareholders after deducting applicable expenses and taxes. 

      Use of IPO ProceedsAmount (₹ Cr)
      Proceeds to be received by selling shareholders through Offer for Sale (OFS) ₹22,561.57

      NSE IPO – Day 2 Update

      The grey market premium (GMP) of the NSE stands at ₹113 as of September 18, 2026 (Day 1). Considering the upper end of the price band at ₹1,785 per share, the estimated listing price is around ₹1,898, reflecting a potential gain of approximately 6.33% per share in the grey market.

      DateGMPEst. Listing Price Gain 
      17-09-2026 (Day 1)₹113₹1,8986.33%

      Disclaimer: The above GMP (Grey Market Premium) is just unofficial market information, which is not officially confirmed. These figures are shared for informational purposes only and investment decisions based on these should be based on the investor’s own research and discretion. We do not conduct, recommend or support any kind of transaction in the grey market.

      NSE IPO IPO – Key Details

      ParticularsDetails
      IPO Opening DateSeptember 17, 2026
      IPO Closing DateSeptember 21, 2026
      Issue Price Band₹1,700 to ₹1,785 per share
      Total Issue Size12,64,36,650  shares (aggregating up to ₹22,561.57 Cr)
      Listing PlatformBSE
      RegistrarKFin Technologies Limited 
      DRHPNSE

      Important Dates for NSE IPO Allotment

      EventDate
      Tentative AllotmentSeptember 22, 2026
      Refunds InitiationSeptember 22, 2026
      Credit of Shares to DematSeptember 22, 2026
      Listing Date September 24, 2026

      Overview of NSE 

      National Stock Exchange of India Limited (NSE) is one of India’s leading stock exchanges, providing a technology-driven platform for trading and investing across equity, equity derivatives, currency derivatives, and other financial market segments. The exchange serves a broad base of retail and institutional investors through its extensive trading infrastructure and market ecosystem. NSE has established a strong position in India’s capital markets, supported by its scale, technology, liquidity, and diverse range of products. With growing retail participation, increasing digital adoption, and continued development of India’s financial markets, the exchange remains a key part of the country’s evolving capital market infrastructure. 

      Frequently Asked Questions (FAQs)

      1. What is the opening and closing date of the NSE IPO ?

        NSE IPO  will open on 17 September 2026 and will close on 21 September 2026.

      2. What is the price band of the NSE IPO ?

        Its price band is fixed from ₹1700 to ₹1785 per share.

      3. What is the GMP (Grey Market Premium) of the NSE IPO today

        The GMP on 17 September 2026 is ₹113, which leads to a possible listing price of ₹1898.

      4. What is the total issue size of the NSE IPO?

        The total issue size of the NSE IPO is ₹22,561.57 crore, The IPO is entirely an Offer for Sale (OFS).

      5. What is the expected listing date of  the NSE IPO?

        This IPO is expected to be listed on BSE on September 24, 2026.

    8. Hero Motors IPO Allotment Status: Check Latest GMP, Steps to Verify Status

      Hero Motors IPO Allotment Status: Check Latest GMP, Steps to Verify Status

      Hero Motors, an Indian auto-components manufacturer, is launching its initial public offering (IPO) to raise up to ₹1,000 crore. The issue opened for subscription on September 16, 2026, and will close on September 18, 2026, with a price band fixed at ₹79 to ₹84 per share. The IPO comprises a fresh issue of up to ₹600 crore and an offer for sale (OFS) of up to ₹400 crore. The shares are proposed to be listed on both the Bombay Stock Exchange (BSE) and the National Stock Exchange (NSE) on September 23, 2026, subject to allotment and necessary regulatory approvals. 

      Hero Motors IPO Day 3 Subscription Status

      On Day 3, Hero Motors. IPO witnessed a strong investor turnout, closing with an overall subscription of 7.01 times. The NII category led the demand, The Non-Institutional Investors 10.47 times subscription Overall, indicating good participation. Among Non-Institutional Investors (NII), the bNII (above ₹10 lakh) portion was subscribed 8.62 times, while the sNII (less than ₹10 lakh) segment saw 14.17 times subscription. The Retail Individual Investors (RII) category was subscribed 8.62 times, reflecting healthy retail interest, issue garnered 16,25,807 applications, with total bids amounting to approximately 4,904.79 crore, showcasing confidence across investor categories in the company’s growth potential.

      Investor CategorySubscription (x)
      Qualified Institutional Buyers (QIB)0.07
      Non-Institutional Investors (NII)1.28
      bNII (above ₹10 lakh)1.24
      sNII (less than ₹10 lakh)1.35
      Retail Individual Investors (RII)0.63
      Total Subscriptions0.65

      Total Applications: 16,25,807 crore 

      Total Bid Amount (₹ Crores): 4,904.79

      How to Check Hero Motors IPO Allotment Status?

      Hero Motors IPO allotment can be easily checked online in two ways: from the Registrar’s website and from the BSE or NSE website. This IPO will be listed on both the exchanges – BSE and NSE, so the allotment status will be available to all investors on both platforms.

      Method 1: Registrar’s website (KFin Technologies Limited)

      The most reliable way is to check allotment from the KFin Technologies Limited website.

      How to do:

      • Visit KFin Technologies Limited official website
      • Select “Hero Motors” from the IPO list
      • Enter your details PAN number, Application number, or DP/Client ID
      • Click on Submit
      • You will see the allotment status on the screen.

      Method 2: Check from BSE or NSE’s website

      If there is more traffic on the registrar’s website, allotment status can also be checked from BSE or NSE.

      How to do:

      • Visit BSE or NSE’s official website
      • Select ‘Equity’ segment
      • Select “SBI Funds Management” from the IPO list
      • Enter PAN number and Application number
      • Click on Search

      Objective of the Hero Motors IPO

      For Hero Motors IPO, the issue comprises a Fresh Issue of ₹600 crore and an Offer for Sale (OFS) of ₹400 crore. The proceeds from the Fresh Issue will be received by the company for its stated objectives, while the OFS proceeds will be received by the selling shareholders after deducting applicable expenses and taxes. 

      Use of IPO ProceedsAmount (₹ Cr)
      Proceeds to be received by selling shareholders through Offer for Sale (OFS) 400
      Proceeds from Fresh Issue to be received by Hero Motors 600

      Hero Motors IPO – Day 3 Update

      The grey market premium (GMP) of Hero Motors stands at ₹0 as of September 18, 2026 (Day 3). Considering the upper end of the price band at ₹84 per share, the estimated listing price is around ₹84, reflecting a potential gain of approximately 0% per share in the grey market.

      DateGMPEst. Listing Price Gain 
      18-09-2026 (Day 2)₹0₹840%

      Disclaimer: The above GMP (Grey Market Premium) is just unofficial market information, which is not officially confirmed. These figures are shared for informational purposes only and investment decisions based on these should be based on the investor’s own research and discretion. We do not conduct, recommend or support any kind of transaction in the grey market.

      Hero Motors IPO – Key Details

      ParticularsDetails
      IPO Opening DateSeptember 16, 2026
      IPO Closing DateSeptember 18, 2026
      Issue Price Band₹79 to ₹84 per share
      Total Issue Size11,90,47,618  shares (aggregating up to ₹1,000 Cr)
      Listing PlatformBSE, NSE
      RegistrarKFin Technologies Limited 
      DRHPHero Motors

      Important Dates for Hero Motors IPO Allotment

      EventDate
      Tentative AllotmentSeptember 21, 2026
      Refunds InitiationSeptember 21, 2026
      Credit of Shares to DematSeptember 21, 2026
      Listing Date September 23, 2026

      Overview of Hero Motors 

      Hero Motors Limited is an Indian automotive components manufacturer, engaged in designing and producing drivetrain and powertrain solutions for two-wheelers, passenger vehicles, commercial vehicles, and other mobility applications. The company serves leading automotive manufacturers across domestic and international markets. With a presence across multiple countries and a focus on advanced engineering and mobility solutions, Hero Motors has established itself as a prominent player in the global auto-components industry. With growing demand for electric and conventional mobility solutions, the company continues to expand its capabilities and strengthen its position in the evolving automotive components sector. 

      Frequently Asked Questions (FAQs)

      1. What is the opening and closing date of Hero Motors IPO ?

        Hero Motors IPO  will open on September 17 2026 and will close on September 21 2026.

      2. What is the price band of the Hero Motors IPO ?

        Its price band is fixed from ₹79 to ₹84 per share.

      3. What is the GMP (Grey Market Premium) of Hero Motors IPO today?

        The GMP on September 18, 2026 is ₹0, which leads to a possible listing price of ₹84.

      4. What is the total issue size of Hero Motors IPO?

        The total issue size of the Hero Motors IPO is ₹1000 crore, The IPO is a combination of fresh issue & Offer for Sale.

      5. What is the expected listing date of Hero Motors ?

        This IPO is expected to be listed on BSE and NSE on September 23, 2026.

    9. What Is ASM in Share Market?

      What Is ASM in Share Market?

      The stock market frequently witnesses sudden price jumps and unusual trading activities on a daily basis. Regulatory bodies keep a close watch on such rapid movements to ensure a completely safe environment for all participants. Sometimes, specific company shares show excessive ups and downs without any clear logical reason or news. When this specific situation happens, special monitoring tools step in to protect everyday investors from huge unexpected losses. Market regulators place specific restrictions to calm down unnecessary excitement and bring stability back to the financial ecosystem.

      What is ASM?

      To understand the asm full form in share market, investors must look at the rules created by the Securities and Exchange Board of India. It stands for Additional Surveillance Measure. This acts as a safety system used by popular stock exchanges like NSE and BSE. Regulators actively use it to track shares showing unusual price changes or massive trading volumes. It serves as a helpful warning signal rather than a severe punishment for companies.

      Key Aspect of ASM

      • Phased Tracking: The monitoring process happens in multiple systematic phases to carefully evaluate trading behaviour over time. Regulators look at specific data points rather than judging the actual financial health of the business.
      • Margin Increase: When a stock enters asm stage 1, traders face higher margin requirements immediately. This initial step serves as a very early warning for all market participants to stay extremely alert.
      • Review Period: The asm stage 1 duration typically lasts for a minimum of five or fifteen trading days. The exact duration depends purely on the entry criteria the specific stock has met during the review.
      • Frequent Reviews: Regular reviews take place frequently to decide the next steps for the selected security. Based on these careful reviews, the stock might move to a higher strict stage or exit the surveillance entirely.
      • Corporate Actions: The entire framework operates completely independent of regular corporate actions like dividends or stock splits. Investors still receive their rightful corporate benefits even if the stock faces strict trading restrictions.

      Why Do Exchanges Place Stocks Under ASM

      • Investor Protection: The main goal is to protect retail investors from extreme financial losses caused by sudden market panic or greed. Authorities want to stop illegal market manipulation and artificial price inflation by large operators.
      • Curb Speculation: The system helps to forcefully reduce excessive speculation that does not match the actual financial results of the company. It acts as a very clear warning sign so market participants do proper research before investing capital.
      • Market Integrity: The framework exists to maintain overall market integrity and keep the trading system fair for everyone involved. It actively alerts the public about hidden risks that might not be visible in regular daily charts.
      • Discipline Focus: The measure strongly encourages traders to adopt a more disciplined approach rather than chasing quick daily profits. It systematically filters out irrational market hype from genuine company growth patterns over a longer period.

      Read Also: What Are Restricted Stock Units (RSUs)?

      Parameters considered under ASM

      Before adding any specific share to the asm list, the stock exchanges meticulously check several mathematical conditions.

      • Price Swings: High and low price variation limits monitor the absolute difference between the highest and lowest prices during a specific timeframe. Extreme price swings often indicate unhealthy market volatility that needs immediate regulatory attention.
      • Client Concentration: It refers to situations where a very small group of traders controls a massive portion of the total trading volume. It signals possible coordinated activity by big players trying to control the price.
      • Closing Jumps: Close to close price variation tracks huge daily jumps in the final closing prices. If a stock jumps too much without any real corporate news, the computer system flags it very quickly.
      • Volume Spikes: Volume variation looks for a sudden and massive spike in the total number of shares bought and sold. Unexplained volume spikes attract immediate regulatory scrutiny to prevent fake volume creation.
      • Delivery Ratio: Delivery percentage compares actual shares taken into demat accounts against the total daily trades. A very low delivery ratio usually suggests heavy speculative day trading rather than genuine long term investing.
      • Market Size: Market capitalisation checks the overall size and value of the company against specific benchmark thresholds. Different mathematical rules apply to small companies and large companies under this monitoring framework.
      • Valuation Check: Price to earnings ratio evaluates the current valuation of the listed company. A negative valuation or a dangerously high valuation compared to the broader market index acts as a strong alert signal for regulators.

      Short term ASM vs Long term ASM

      FeatureShort-Term CategoryLong-Term Category
      Primary FocusMonitors sudden and recent spikes in daily price or volume.Monitors sustained and ongoing abnormal movements over several months.
      Review PeriodUsually reviewed swiftly after just 5 or 15 trading days.Requires a minimum strict period of 90 calendar days before exit review.
      Action StagesOperates very simply in only two main escalation stages.Operates systematically in four escalating and stricter action stages.
      Entry TriggersTriggered by sudden five-day price jumps and low unique traders.Triggered by extreme high-low variations combined with high client concentration.
      Margin ImpactImposes temporary margin hikes up to a maximum of 100 percent.Imposes permanent upfront margins of 100 percent at all higher levels.
      Exit ProcessStocks can exit very quickly once daily trading activity stabilizes.Stocks require a much longer period of normal behaviour to finally exit.

      Consequences when a stock comes under ASM

      • Intraday Blocked: Intraday trading gets completely blocked for the affected securities. Traders absolutely cannot buy and sell the stock on the exact same day for quick profits. The system forces every buyer to take actual delivery into their personal demat accounts.
      • Full Payment: Full payment becomes strictly necessary for all new transactions. Investors must pay the entire one hundred percent amount upfront to buy the shares. No partial payments or margin funding benefits remain available for traders.
      • Tight Circuits: Restricted price movements occur as exchanges forcefully reduce the daily price limit to five percent or even lower. This effectively stops huge daily swings in either direction, bringing much needed calmness to the trading activity.
      • No Pledging: Pledging remains restricted for these specific shares under surveillance. Investors cannot use them as collateral to get margin loans from their brokers. If already pledged, the existing collateral value gets completely removed by the clearing system.

      How does ASM Affect in Intraday, margin, leverage and settlement

      • The impact on daily trading activities is quite strict and happens immediately. For intraday trading, the facility is completely shut down at higher monitoring stages. Traders are forced to take actual delivery of the shares directly into their personal demat accounts. All special intraday order types get permanently blocked by the trading platforms to stop quick speculation.
      • Leverage is also entirely removed from the daily trading equation. Normally, stockbrokers provide extra funds to help clients buy a larger number of shares than they can actually afford. Under this framework, borrowed funds are not allowed at all for any market participant. This creates a much safer environment by significantly reducing borrowed financial risk.
      • Margin requirements see a massive and unavoidable jump. In the very first phase, the required cash automatically goes up to fifty percent or more of the trade value. By the second phase, buyers must deposit one hundred percent of the total trade value upfront before placing an order. This makes trading these stocks much more expensive and requires full capital readiness.
      • Settlement processes permanently change from regular normal trades to the strict Trade to Trade settlement category. This means netting off open positions on the same day is completely impossible for anyone. Every single purchase must result in a strict delivery settlement at the end of the day. This rule eliminates all pure speculators from the counter and encourages only serious long term investments.

      Things to consider before trading ASM stocks

      • Business Health: Check company fundamentals carefully before making any final investing decisions. A genuinely good company might end up here simply because of sudden market hype or positive news. Always verify the actual earnings, debt levels, and overall business health.
      • Ready Cash: Arrange full capital because no margin funding is ever available for these restricted stocks. Investors need the complete cash amount ready in their trading account. Planning the investment budget carefully prevents unexpected shortfalls during trade execution.
      • Low Liquidity: Expect low liquidity since strict rules often chase away daily active traders. Finding interested buyers when trying to sell your shares might take much more time than usual. Patience becomes highly necessary when exiting your position.
      • Narrow Bands: Prepare for narrow price bands because the stock price will not move very fast in a single trading day. The strict five percent circuits limit both massive gains and massive losses. Rapid wealth creation is highly unlikely here.
      • Smart Tools: Use smart platforms like Pocketful to track volatile stocks easily. Pocketful offers great digital tools, zero delivery brokerage, and a very simple user interface. This makes it easier for investors to manage their capital safely and execute trades without any confusion.
      • Patient Mindset: Understand the holding period because buying these stocks requires a very patient mindset. Short term scalping is completely impossible due to the mandatory delivery rules enforced by the exchange. The investment horizon must be longer than usual.

      Read Also: Best Stock Broking Stocks in India

      Conclusion

      Regulatory safety measures exist purely to keep the financial ecosystem secure and transparent for everyone. Finding a stock under special surveillance does not mean the underlying business is bad, weak, or fraudulent. It simply means the trading patterns require a closer look to prevent unwanted market risks.

      By staying informed and doing proper fundamental research, market participants can navigate these unique situations safely. A disciplined approach to investing always builds lasting long term wealth, regardless of temporary market restrictions. Platforms like Pocketful that simplify the trading process add great value to this financial journey.

      S.NO.Check Out These Interesting Posts You Might Enjoy!
      1What is Commodity Valuation?
      2What is Auction Market?
      3What is MIS in Share Market?
      4What is Right Issue of Shares: Meaning, Examples, Features
      5What is Earnings Per Share (EPS)?

      Frequently Asked Questions (FAQs)

      1. What does this ASM mean for the market?

        It is a safety mechanism created by regulators to monitor stocks with unusual price jumps, ensuring market stability.

      2. Does ASM mean a company has weak fundamentals?

        No. It only flags abnormal trading patterns. Fundamentally strong companies can also face surveillance due to excessive market hype.

      3. How ASM this benefit retail investors?

        It protects everyday investors from heavy losses caused by sudden price manipulation or extreme speculation by large operators.

      4. How to use ASM for investing?

        Treat it as a clear warning sign. Conduct deep research into company financials before investing full capital without any margin.

      5. Can these stocks be pledged for extra margins?

        No. Shares under this specific list cannot be used as collateral to get additional trading funds from brokers

    10. Open Free Demat Account

      Join Pocketful Now

      You have successfully subscribed to the newsletter

      There was an error while trying to send your request. Please try again.

      Pocketful blog will use the information you provide on this form to be in touch with you and to provide updates and marketing.