Patanjali, the name itself, evokes a sense of tradition and well-being. Over time, it has become a household name in India. Patanjali is a modern consumer goods company that provides everything from herbal remedies to healthy staples in India, and is known for its Ayurvedic and natural products.
In today’s blog, we will delve deeper into Patanjali Foods, a brand synonymous with a back-to-nature approach, and explore the company’s financials, SWOT analysis, and business model.
Patanjali Overview
Baba Ramdev and Acharya Balkrishna established Patanjali Ayurveda Limited in Haridwar in 2006. Patanjali Foods was initially founded as Ruchi Soya Industries Limited. The company initially concentrated on manufacturing herbal formulations and ayurvedic medications. They started producing food, household goods, and personal care items later in 2010 after entering the fast-moving consumer goods (FMCG) industry.
Ruchi Soya Industries declared bankruptcy in the year 2019 as a result of heavy debt. In June 2022, Ruchi Soya Industries Limited formally changed its name to Patanjali Foods Limited after Patanjali Foods purchased the bankrupt company in 2019. The company produces bakery fats, soy products, edible oil, and Vanaspati Ghee.
The company grew tremendously between 2015 and 2017 due to aggressive marketing efforts and strong brand recall.

Patanjali Business Model
The business model of Patanjali Foods is built around a number of essential components
1. The company targets customers who like natural products and concentrates primarily on Ayurveda and natural ingredients in its products.
2. The company maintains standards and quality because it has direct control over many areas of the production process, including the supply chain and raw material purchases.
3. The company draws customers who are sensitive to price changes because they offer their items at very reasonable costs.
4. The company’s extensive distribution network, which consists of franchise stores, supermarkets, and its own retail locations, makes its products easily accessible to consumers.
Market Details
| Current Market Price | INR 1372 |
| Book Value | INR 272 |
| 52 Week High | INR 1713 |
| 52 Week Low | INR 864 |
| Face Value | INR 2 |
| PE Ratio | 59.51 |
| Market Capitalization | 49,587 Crores |
Read Also: Colgate Palmolive India Case Study: Business Model, Product Portfolio, And SWOT Anlaysis
Patanjali Financial Highlights
Balance Sheet
| Particulars | 31st March 2023 | 31st March 2022 | 31st March 2021 |
|---|---|---|---|
| Non-Current Asset | 5415.1376 | 5124.7768 | 5320.7144 |
| Current Asset | 7824.7724 | 6351.3587 | 3688.1054 |
| Total Asset | 13243.5856 | 11480.2111 | 9008.8198 |
| Equity | 9846.5667 | 6170.8404 | 4062.4128 |
| Long Term Liability | 193.3653 | 3054.0267 | 3215.1662 |
| Current Liability | 3201.9236 | 2253.6140 | 1731.2408 |
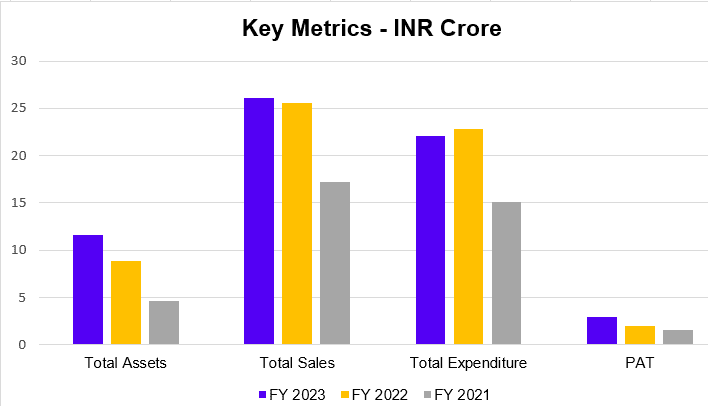
From the above table and graph, it is evident that the company’s total assets have increased over time. It was 11480 crore in the year 2022 and increased to 13243 crores in FY 2023. Still, their non-current assets remain constant, and their long-term liability has decreased drastically in FY 2023. It was 3054 crore in FY 2022 and decreased to 193 crores in FY 2023.
Income Statement
| Particulars | 31st March 2023 | 31st March 2022 | 31st March 2021 |
|---|---|---|---|
| Revenue from operations | 31524.6560 | 24205.3751 | 16318.6330 |
| Total Income | 31821.4548 | 24284.3822 | 16382.9771 |
| Total Expenses | 30642.4935 | 23210.0007 | 15868.5769 |
| Profit before tax | 1178.9613 | 1074.3815 | 514.4002 |
| Profit after tax | 886.4411 | 806.3089 | 680.7718 |
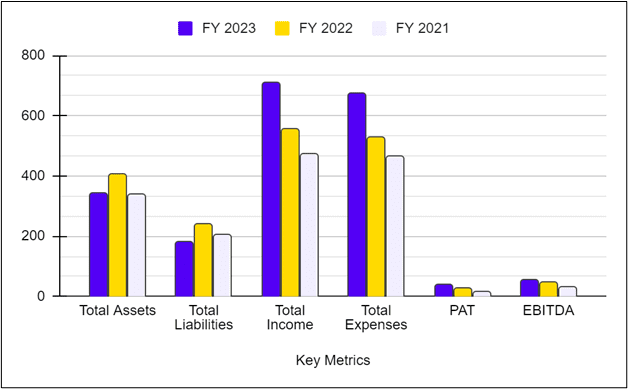
The table above indicates that the business is growing, with operating revenue rising at an approximate rate of 35% CAGR and profit rising at an approximate rate of 10% YoY.
Cash Flow Statement
| Particulars | 31st March 2023 | 31st March 2022 | 31st March 2021 |
|---|---|---|---|
| Net Cash flow from operating activities | (339.3398) | 724.2141 | 247.2654 |
| Cash flow from investing activities | 526.1229 | (1,384.47) | (43.9808) |
| Cash flow from financing activities | 241.3590 | 988.94 | (310.8140) |
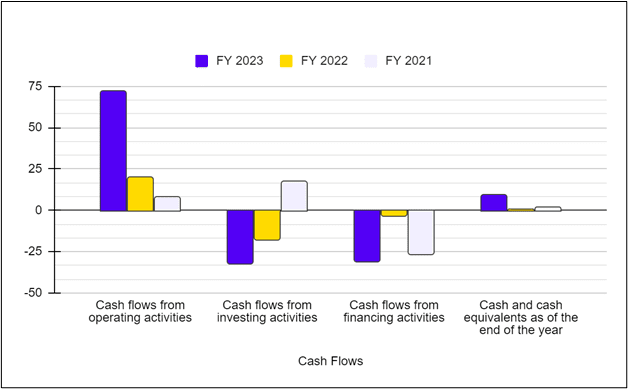
The above table indicates that the company’s primary source of earnings are its investing and financing activities, which have been erratic in the past. Given that a stable company’s primary source of earnings should come from operating activities, this could be cause for concern.
KPIs
| Particulars | 31st March 2023 | 31st March 2022 | 31st March 2021 |
|---|---|---|---|
| Operating Profit Margin (%) | 4.49 | 5.90 | 5.42 |
| Net Profit Margin (%) | 2.81 | 3.33 | 4.17 |
| Return on Capital Employed (%) | 14.12 | 15.49 | 12.16 |
| Inventory Turnover | 7.19 | 7.36 | 7.53 |
| Current Ratio | 2.44 | 2.82 | 2.13 |
| Return on Net Worth (%) | 9 | 16.51 | 16.75 |
The company’s major performance metrics show that its net profit margin dropped to 2.81% in FY 2023 from 3.33% in 2022.
Patanjali SWOT Analysis
The SWOT analysis of Patanjali reveals key strengths, weaknesses, opportunities, and threats shaping the company’s growth strategy:

Strengths
1. The company incorporates natural ingredients in its products, which helps it gain the trust of its clients and establish a strong brand identity.
2. To meet the demands of various clients, the company offers a varied product range spanning food, wellness, personal care, and other categories.
3. The products of Patanjali are affordable for every segment of customers, through which they can position themselves easily in the market.
4. The company can reach every corner of the nation, whether in an urban or rural setting, thanks to its wide distribution network.
Weaknesses
1. The company has occasionally received complaints about the quality of its products. This can be a cause for concern since a persistent pattern of complaints will negatively impact the company’s reputation with customers.
2. The company’s minimal exposure to the global market raises questions about how the firm can expand.
3. Since the company only sells ayurvedic items, its target market is only health-conscious individuals; as a result, it might not be able to meet the needs of a larger customer base.
Opportunities
1. To satisfy the demands of changing consumers, the corporation must concentrate on diversifying its product line to include ready-to-eat meals, FMCG, functional beverages, etc.
2. The company has yet to explore the foreign market, but doing so will help it grow as it will present new opportunities.
3. They can access a larger spectrum of customers thanks to the rise of e-commerce platforms.
4. The research and development team should concentrate on creating new items that will meet consumer wants, giving them an advantage over competitors.
Threats
1. Due to intense competition from both domestic and foreign brands, the company’s profitability will be severely damaged by any poor judgments the management makes regarding the quality of the product, price, and other concerns.
2. Any interruption to the supply chain, a scarcity of raw materials, or a problem with transportation could have a detrimental effect on the company’s earnings.
3. Nowadays, customer needs are changing quickly; as a result, businesses that are unable to adjust will likely experience a decline in sales.
4. Any change in a regulation made by the government regarding food safety and labeling standards could adversely impact the margins of the company.
Read Also: Gillette India Case Study: Business Model, SWOT Analysis, and Financial Overview
Conclusion
Owing to its ayurvedic products, Patanjali has established a reputation as the Swadesi Company and has always been in the spotlight. The company is still surviving and is regarded as the fastest-growing FMCG company in India despite having suffered several problems in the past with the quality of its products.
If the organization cannot meet the evolving needs of its customers, it still has a long way to go. As we usually advise, think about your risk tolerance before making any investing decisions.
| S.NO. | Check Out These Interesting Posts You Might Enjoy! |
|---|---|
| 1 | Hindustan Unilever Case Study |
| 2 | Elcid Investments – India’s Costliest Stock |
| 3 | Reliance Power Case Study |
| 4 | Burger King Case Study |
| 5 | Zara Case Study |
FAQs
What is Patanjali Foods’ primary business?
The company processes oil seeds and refines oils for culinary use in India. It also works in the FMCG sector, producing cow ghee, spices, and herbal goods, among other things.
What does the company’s cash flow situation say?
The company’s CFS indicates a very turbulent picture, where the majority of the net cash flow came from investing and financing activities.
Is PATANJALI in FMCG company?
Yes, Patanjali Ayurved Limited is an FMCG (Fast-Moving Consumer Goods) company. It offers a wide range of products, including food items, beverages, personal care products, and Ayurvedic medicines.
Are Patanjali Foods and Ruchi Soya the same company?
Yes, Patanjali Foods Limited is the new name of the company following Patanjali Ayurved’s acquisition of Ruchi Soya.
Do Foreign Institutional Investors hold any stake in Patanjali Foods?
As of December 2023, FII holds around 10.93% stake in Patanjali Foods.
Who was the CEO of Patanjali?
As of the latest information, the CEO of Patanjali Ayurved Limited is Acharya Balkrishna. He is a close associate of Baba Ramdev and has been instrumental in the company’s growth.