The summer season is quickly approaching, and to cool off, you might be sitting in a corner with a drink from the refrigerator or have turned on the air conditioner. There’s a high probability that one of these two products at your home was manufactured by Bluestar.
In this blog, we shall explore the Bluestar Company, a leader in the Indian Air Conditioner space.
Blue Star Overview
Mohan T. Advani established the Bluestar company in 1943. Headquartered in Mumbai, the company is a leader in the category of Heating, Ventilation, Air conditioning and Commercial Refrigeration (HVAC&R). They manufacture commercial freezers, air conditioners, mechanical and electric plumbing, and firefighting solutions.
In 1960, the company opened its first manufacturing plant in Thane, Mumbai. Later, in 1970, the business took over as HP’s exclusive distributor in India. The company still works with several foreign companies, including Worthington and Mitsubishi. Their manufacturing plants are located in Ahmedabad, Wada, Himachal Pradesh, and Dadra.
Product Portfolio
Bluestar Company Limited offers its customers a wide range of products as mentioned below.
- Air conditioner – The company offers a wide range of air conditioners for residential and commercial purposes.
- Water purifiers – The company produces different varieties of Water purifiers, such as mineral, RO, UV etc.
- Air Purifiers – The business is engaged in the production of air purifiers, catering to the increase in consumer demand for them.
- Air coolers – The company also produces coolers in order to cater to the surge in consumer demand in the summer season.
- Refrigerator – The company manufactures refrigerators of different ranges such as deep freezers, water coolers, etc.
- Electro-Mechanical Projects – The company acts as a single point of contact for the design, execution, and maintenance of electrical, plumbing, and firefighting systems to be installed in a building.
Distribution Channel

The business uses a variety of distribution channels to reach customers all around the nation. Bluestar has partnered with numerous national and international retailers, electronics chains, and specialty shops in the retail space. In addition, they oversee a vast network of sales representatives who deal directly with consumers to offer them customized sales and support services. Additionally, the business has a website and also sells its products online through a network of distribution channels, reaching customers all over the country to take advantage of e-commerce platforms.
Read Also: Bikaji Foods Case Study – Product Portfolio, Financial Statements, & Swot Analysis
Market Details
| Current Market Price | INR 1386 |
| Book Value | INR 127 |
| 52 Week High | INR 1514 |
| 52 Week High Date | 02-May-2024 |
| 52 Week Low | 692.5 |
| 52 Week Low Date | 23-May-2023 |
| Face Value of Share | INR 2 |
| PE Ratio | 68.9 |
| Market Capitalization | 28529 Crores |
Financial Highlights
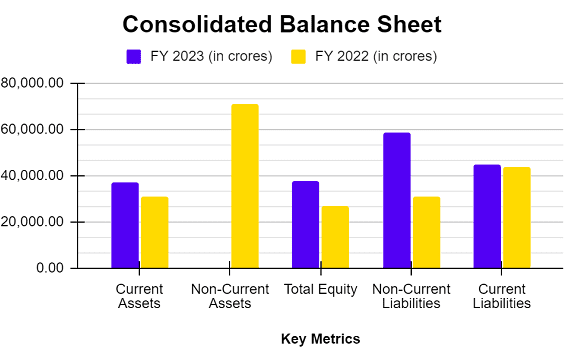
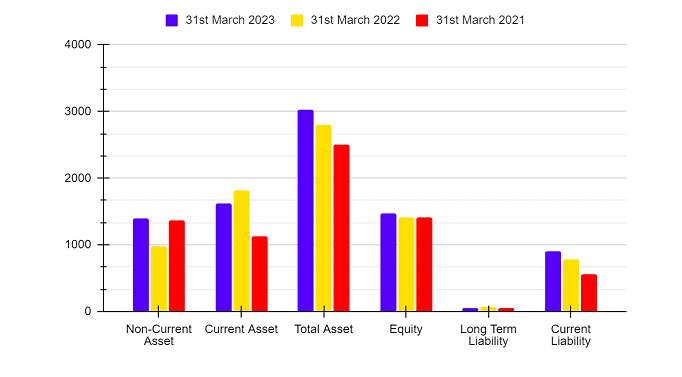
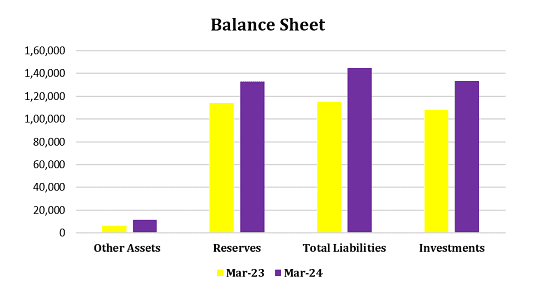
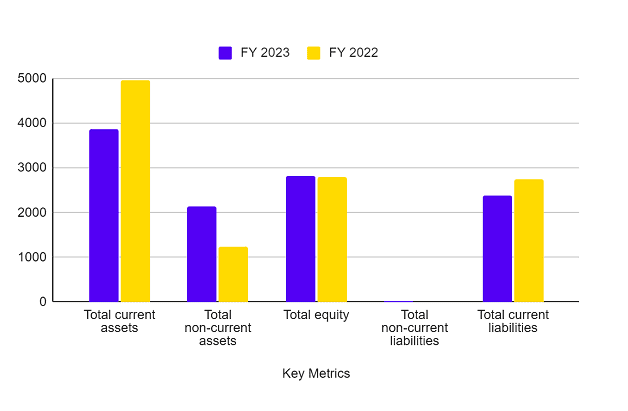
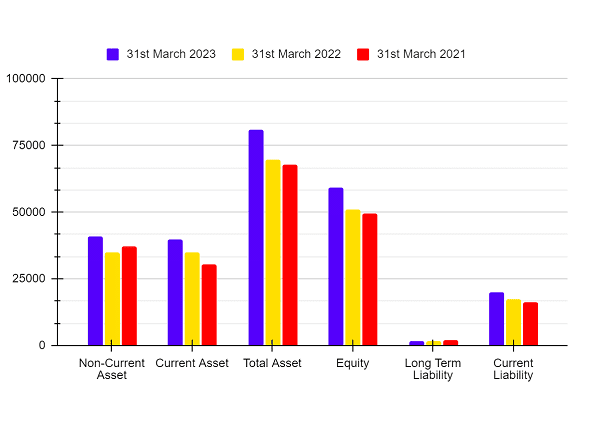
Balance Sheet
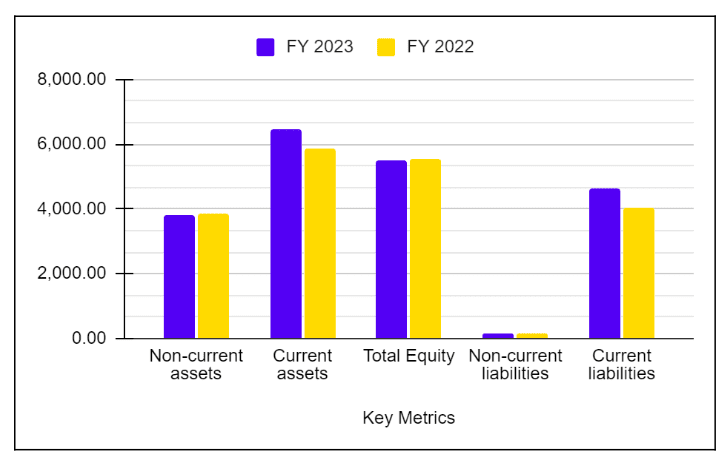
| Particulars | 31st March 2024 | 31st March 2023 | 31st March 2022 |
|---|---|---|---|
| Non-Current Asset | 1578.22 | 1148.45 | 829.21 |
| Current Asset | 5040.03 | 4250.61 | 3483.43 |
| Total Asset | 6618.25 | 5399.06 | 4312.64 |
| Equity | 2612.63 | 1333.84 | 1020.54 |
| Long Term Liability | 126.01 | 281.47 | 322.90 |
| Current Liability | 3879.61 | 3783.75 | 2969.20 |
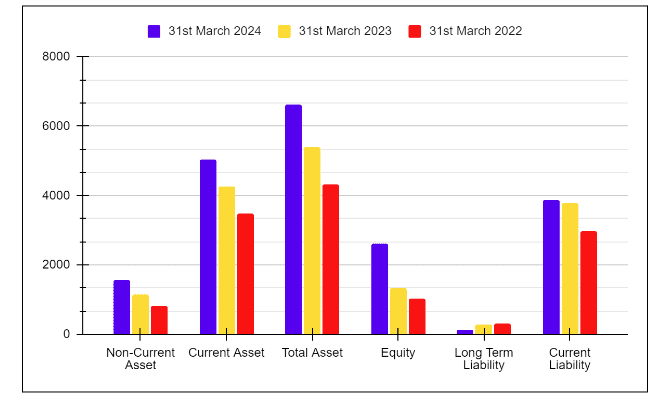
According to the above chart, we can say that the company’s long-term liabilities have declined over time, while its current liabilities and total assets have increased on a YoY basis.
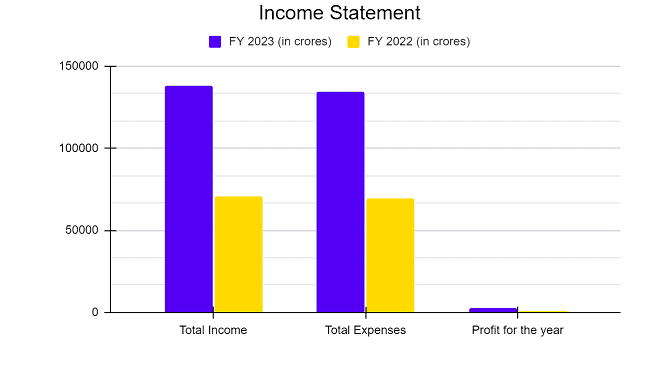
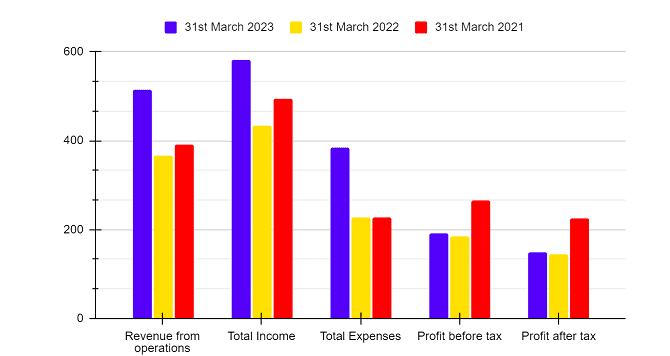
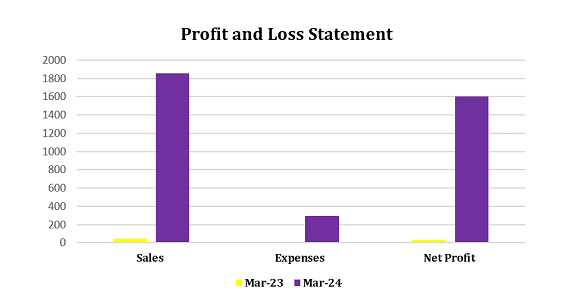
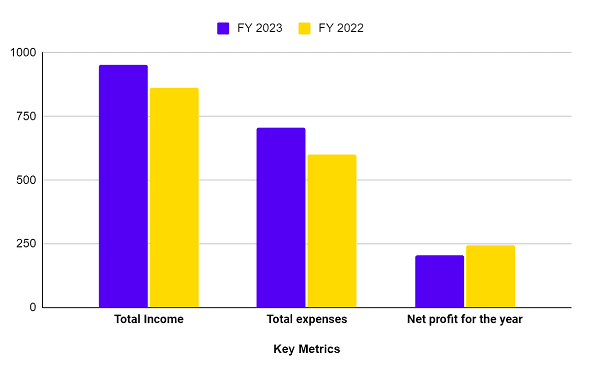
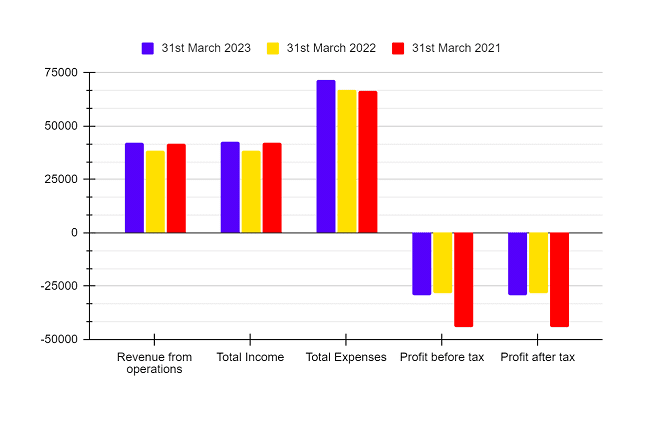
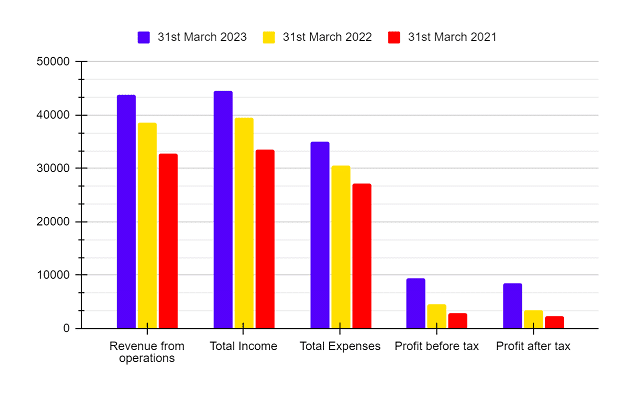
Income Statement
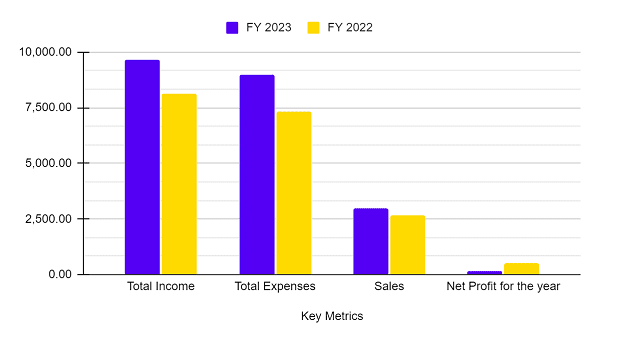
| Particulars | 31st March 2024 | 31st March 2023 | 31st March 2022 |
|---|---|---|---|
| Revenue from operations | 9685.36 | 7977.32 | 6064.08 |
| Total Income | 9732.78 | 8008.19 | 6099.80 |
| Total Expenses | 9176.11 | 7624.02 | 5849.99 |
| Profit before tax | 556.67 | 555.17 | 249.81 |
| Profit after tax | 414.31 | 400.69 | 168 |
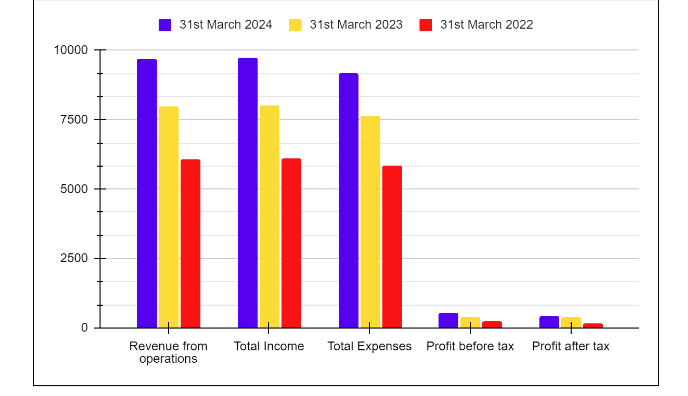
The above chart concludes that the company’s total income has shown a growth of 21% on a YoY basis whereas their profit after tax has increased by just 3.5% in FY 2024 when compared with FY 2023.
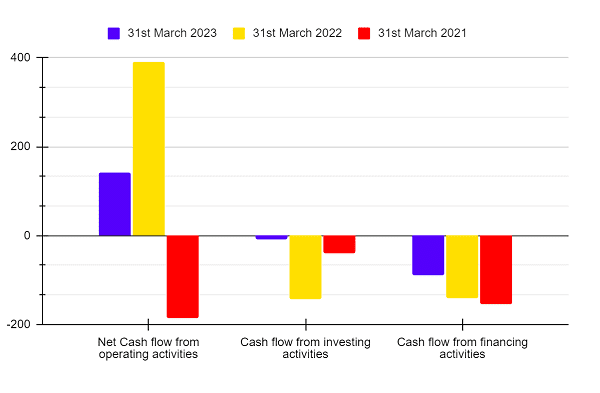
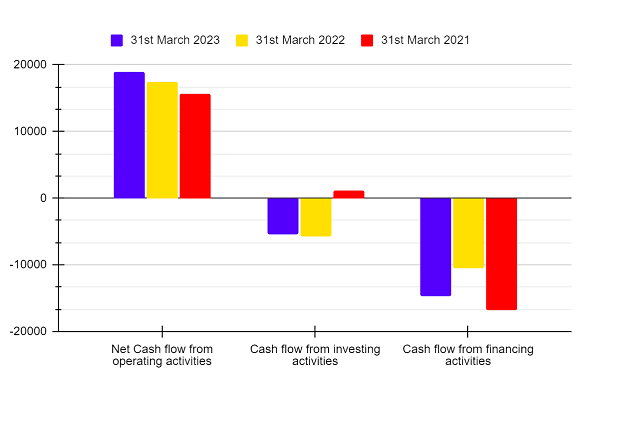
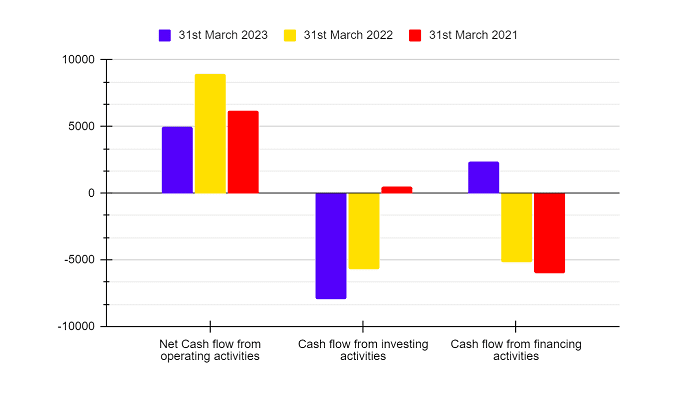
Cash Flow Statement
| Particulars | 31st March 2024 | 31st March 2023 | 31st March 2022 |
|---|---|---|---|
| Net Cash flow from operating activities | 289.22 | 247.38 | 87.40 |
| Cash flow from investing activities | (624.62) | (181.66) | (69.01) |
| Cash flow from financing activities | 364.83 | (91.08) | (82.37) |
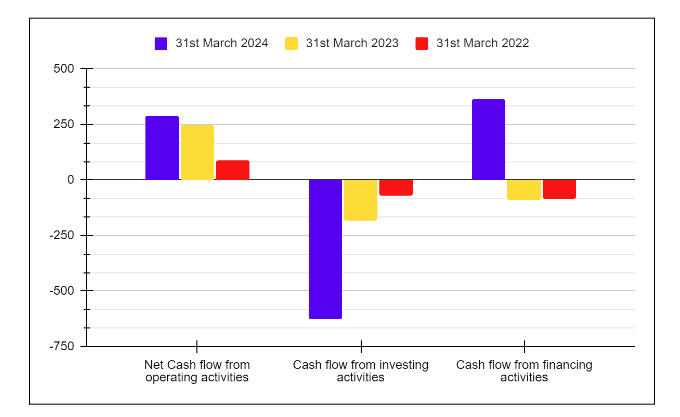
Based on the chart above, we can conclude that although the company has reported negative cash flow from investment activities for the previous three years in a row, it has demonstrated positive cash flow from financing activities in FY 2024 after publishing negative figures in FY 2022 and 2023.
KPIs
| Particulars | 31st March 2024 | 31st March 2023 | 31st March 2022 |
|---|---|---|---|
| Operating Profit Margin (%) | 6.34 | 5.5 | 4.89 |
| Net Profit Margin (%) | 4.27 | 5.01 | 2.76 |
| Return on Capital Employed (%) | 22.44 | 27.16 | 22.04 |
| Inventory Turnover | 4.33 | 3.89 | 3.36 |
| Current Ratio | 1.3 | 1.12 | 1.17 |
| Return on Net Worth (%) | 15.87 | 30.09 | 16.48 |
| Debt to Equity Ratio | 0.06 | 0.43 | 0.47 |
The business’s operating profit margin has slightly improved, but its net profit margin has declined when compared to FY 2023. The management of the company may be concerned about this decline in return on net worth.
Read Also: Dabur Case Study: Business Model and Swot Analysis
SWOT Analysis

Strengths
- The company diversifies its risk by offering a wide range of products, such as MEP solutions, commercial refrigerators, and air conditioners.
- In addition to the metro areas, Bluestar’s extensive distribution network also reaches tier 1, tier 2, and tier 3 cities. It’s also present throughout the world.
- The corporation consistently innovates its product by devoting a sizeable amount of its revenue to research and development.
- The company has four manufacturing units, allowing it to produce its products efficiently.
Weaknesses
- Since the Indian market accounts for a sizable amount of the company’s revenue, any disruption in demand in the Indian economy would have a substantial effect on that revenue.
- Since the company sources its essential components from several different regions, any disruption in the supply chain will affect its output.
- The company’s return on net worth and return on capital employed has decreased in FY 2024 as compared to FY 2023.
Opportunities
- Increasing disposable income and urbanization will create a growth opportunity for the company.
- The company can achieve new heights through strategic partnerships or acquisitions which allows them to access new technologies and better diversification of products.
- The company needs to promote eco-friendly solutions related to air conditions and refrigeration in order to navigate growing environmental concerns.
Threats
- The company faces tough competition from domestic and international players. Non-competence with them will lead to a fall in market share and profitability.
- If the government implements changes related to environmental standards, trade policies can negatively impact the company’s profitability.
Read Also: Ola Electric Case Study: Business Model, Financials, and SWOT Analysis
Conclusion
Bluestar constantly invests in product innovation and client pleasure to achieve new levels of success. The company’s operating profit margins have also improved, as seen by the financial reports that show an increase in margin over the last three years. However, there are risks that are connected to the company. Therefore, an individual must research and consult with an investment professional before making any investment decisions.
Frequently Asked Questions (FAQs)
Is Bluestar an Indian company?
Bluestar is India’s leading Heating, Ventilation, Air conditioning, and Commercial Refrigeration (HVAC&R) Company, with its headquarters in Mumbai.
Who is the head of Bluestar?
Mr. Vir S. Advani heads Bluestar as the Chairman and Managing Director.
Is Bluestar a profit-making company?
Bluestar is a profitable corporation, as seen by its net profit reports for the financial years 2024 and 2023, which came in at 414.31 and 400.69 crore, respectively.
Does Bluestar operate in the international market?
In addition to having operations in India, the company also conducts business internationally via joint ventures in several nations, such as the Middle East and SAARC countries.
What products does Bluestar manufacture?
Bluestar manufactures Air conditioners, Refrigerators, Air coolers, Air Purifiers, and Water purifiers.