Yes Bank is well-known for its pioneering approach and expertise in digital banking. The bank’s journey has been marked by both successes and setbacks as it strives to adapt to changing market conditions and regulatory needs. Despite the hurdles, Yes Bank has continued to demonstrate resilience.
Today’s blog presents a case study on Yes Bank, which includes insights into the bank’s journey, business model, and current financial position.
Yes Bank Overview and History

Yes Bank is a private sector bank with its headquarters located in Mumbai, India. It is known for its technology-driven approach and offers a wide range of products and services for retail, MSME, and corporate clients. The bank also offers brokerage services through its subsidiary, YES Securities.
Yes Bank was founded in 1999 by Indian bankers Ashok Kapur, Harkikat Singh, and Rana Kapoor. They worked with Rabobank from the Netherlands, who owned a majority stake. In 2003, it was renamed as Yes Bank. A banking license was granted in 2004, and in 2005, the bank went public through an IPO.
The bank has a pan-India presence with 1,198 branches and 1,345 ATMs. It also has an international banking unit (IBU) at GIFT City and a representative office in Abu Dhabi.
The RBI Takeover!
In 2018, the bank’s financial health began to deteriorate due to asset quality issues and concerns regarding corporate governance.
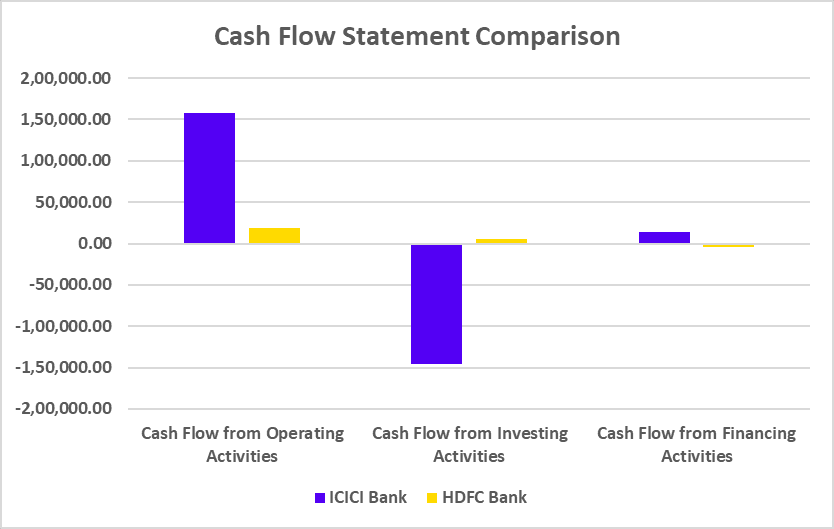
In 2020, the RBI took control of the Bank and fixed limits on withdrawals to protect depositors. A reconstruction scheme was implemented, with investors infusing INR 12,000 crores. These investors included the State Bank of India, ICICI Bank, HDFC Bank, Axis Bank, Kotak Mahindra Bank, etc. State Bank of India took a 49% stake and was the lead participant.
Yes Bank has been restructured under a new management to regain trust and stability. The bank has been focused on improving asset quality and strengthening its risk management framework.
Read Also: SBI Case Study: India’s Leading Public Sector Bank
Business Model of Yes Bank
Yes Bank is a full-service commercial bank offering a comprehensive range of financial products and services to individuals, small and medium-sized enterprises, and large corporations.
The business model mainly revolved around three segments:
- Retail Banking – This segment serves individual customers by offering various products and services, including savings accounts, current accounts, deposits, loans (home, personal, auto), credit cards, investment advisory, and wealth management.
- SME & Corporate Banking – This segment caters to small and medium-sized businesses and large corporations. It provides different financial solutions such as working capital finance, term loans, cash management services, trade finance, and advisory services.
- Investment Banking – Through its subsidiary, YES Securities, the bank provides investment banking services such as equity and debt capital markets, mergers and acquisitions, and financial advisory.
Furthermore, the bank positions itself as a technologically advanced institution, blending innovation and services to deliver a smooth banking experience. Customer satisfaction and digital banking have set it apart from others.
Market Data of Yes Bank
| Current Market Price | INR 23.8 |
| Market Capitalization | INR 74,610 crores |
| 52 Week High | INR 32.8 |
| 52 Week Low | INR 14.1 |
Financial Statements Analysis of Yes Bank
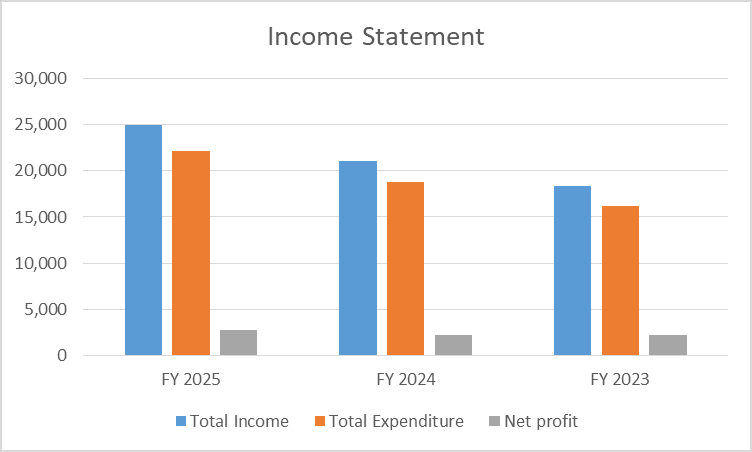
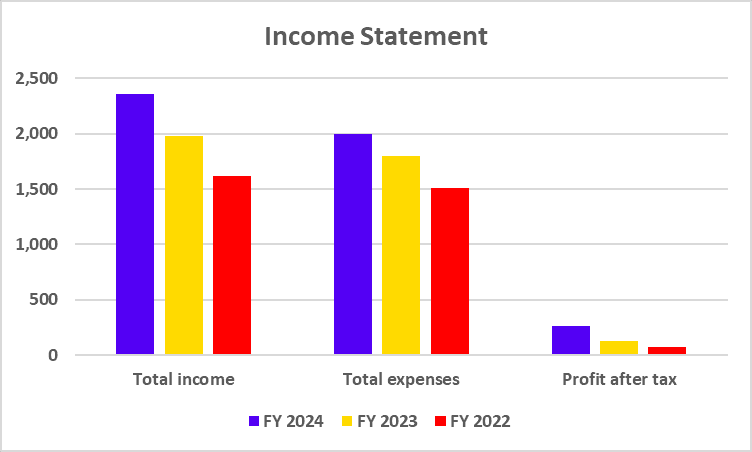
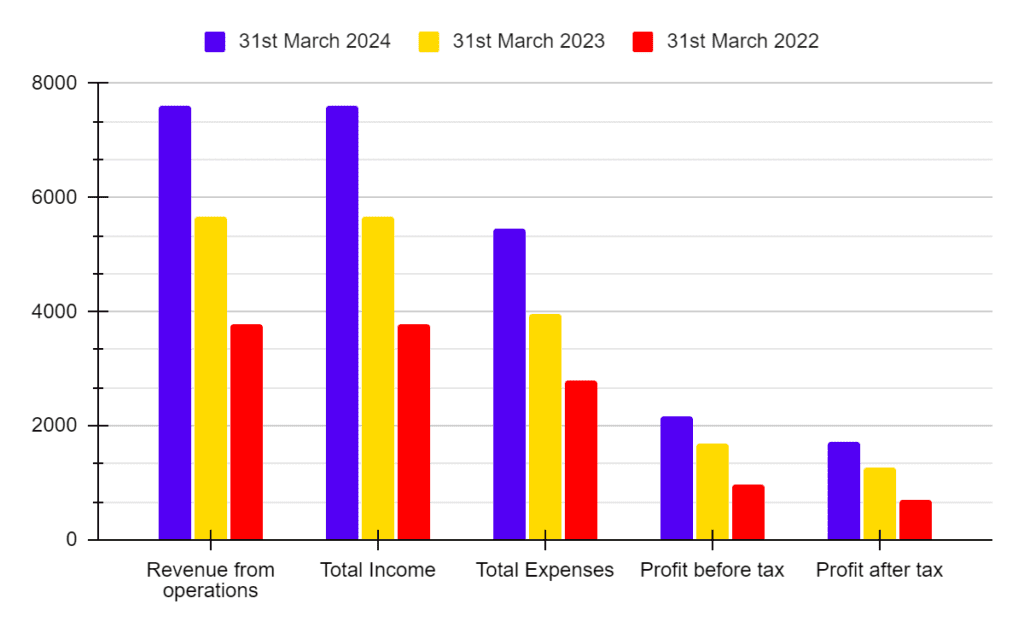
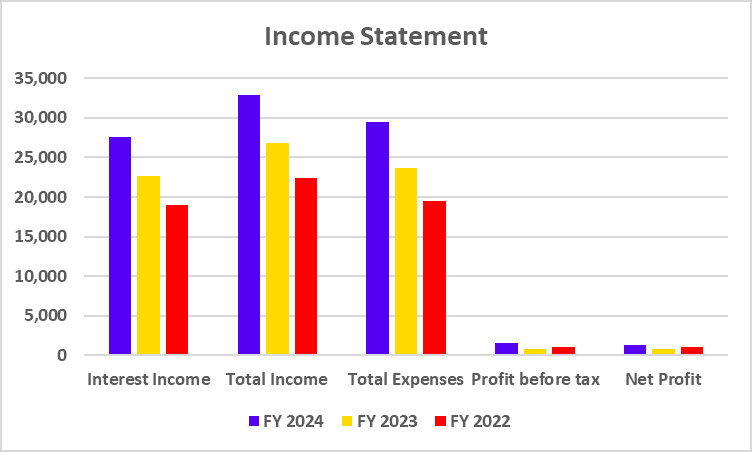
Income Statement
| Particulars | FY 2024 | FY 2023 | FY 2022 |
|---|---|---|---|
| Interest Income | 27,605 | 22,702 | 19,018 |
| Total Income | 32,960 | 26,826 | 22,423 |
| Total Expenses | 29,536 | 23,625 | 19,509 |
| Profit before tax | 1,537 | 735 | 1,064 |
| Net Profit | 1,285 | 736 | 1,064 |
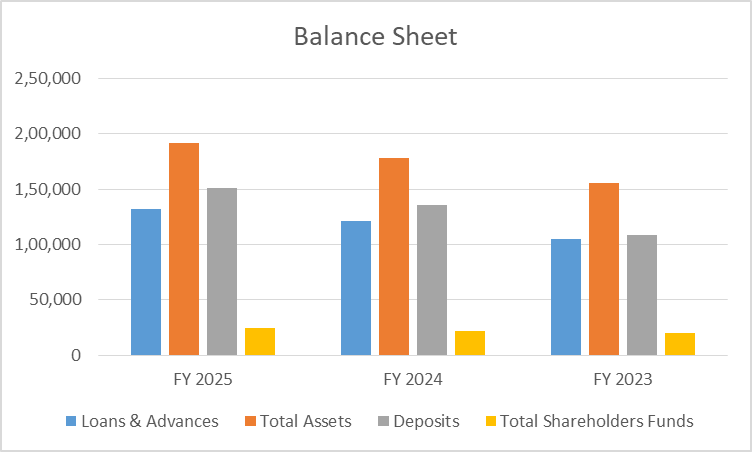
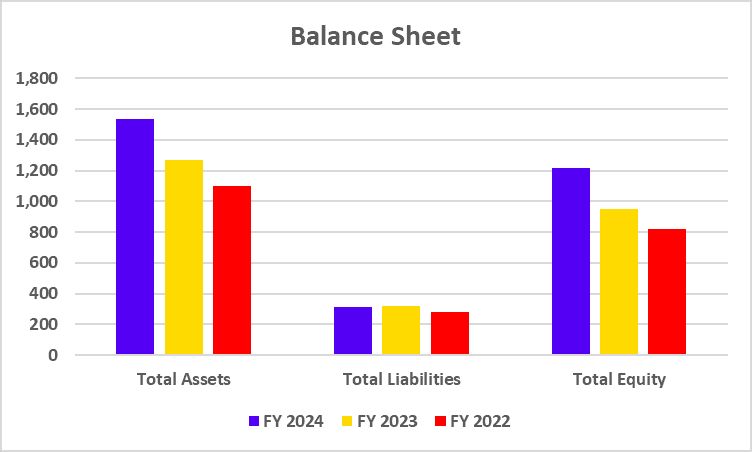
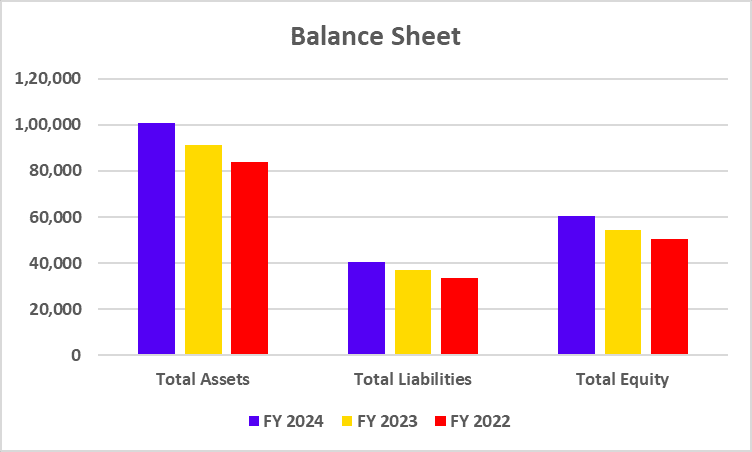
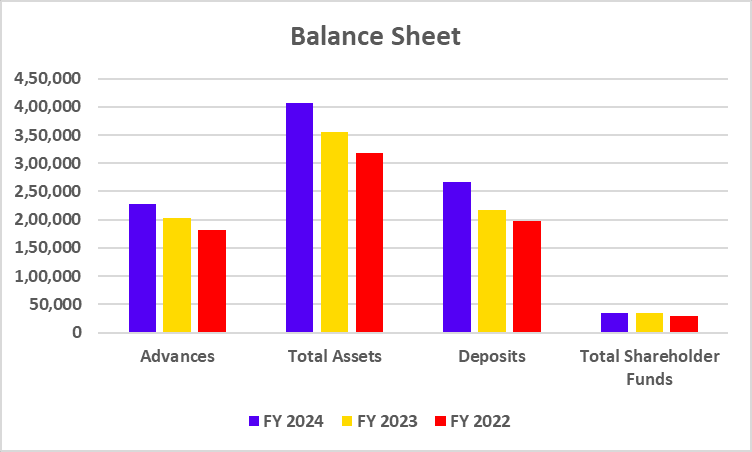
Balance Sheet
| Particulars | FY 2024 | FY 2023 | FY 2022 |
|---|---|---|---|
| Advances | 2,27,799 | 2,03,236 | 1,80,959 |
| Total Assets | 4,06,361 | 3,55,204 | 3,18,577 |
| Deposits | 2,66,229 | 2,17,382 | 1,97,062 |
| Total Shareholder Funds | 35,453 | 34,018 | 28,687 |
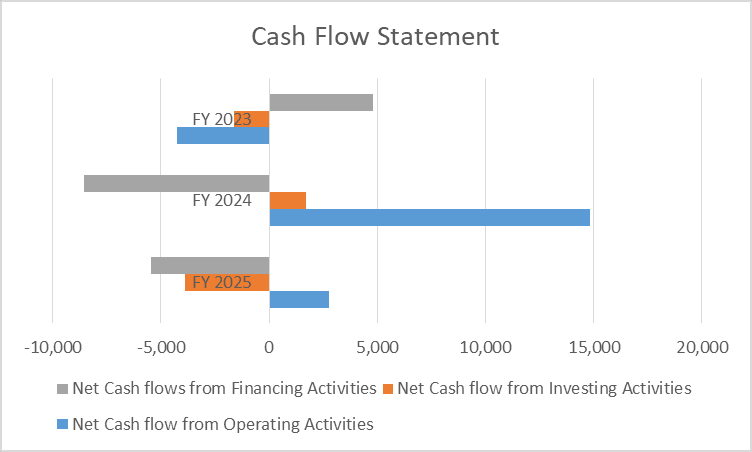
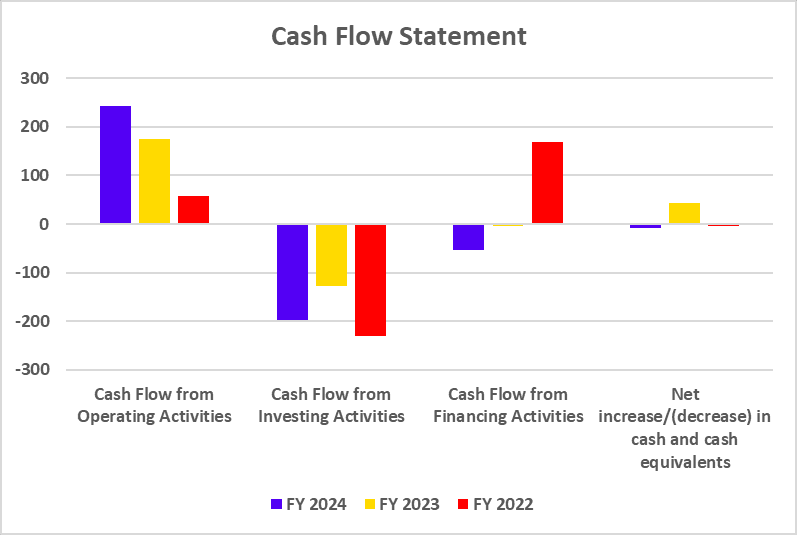
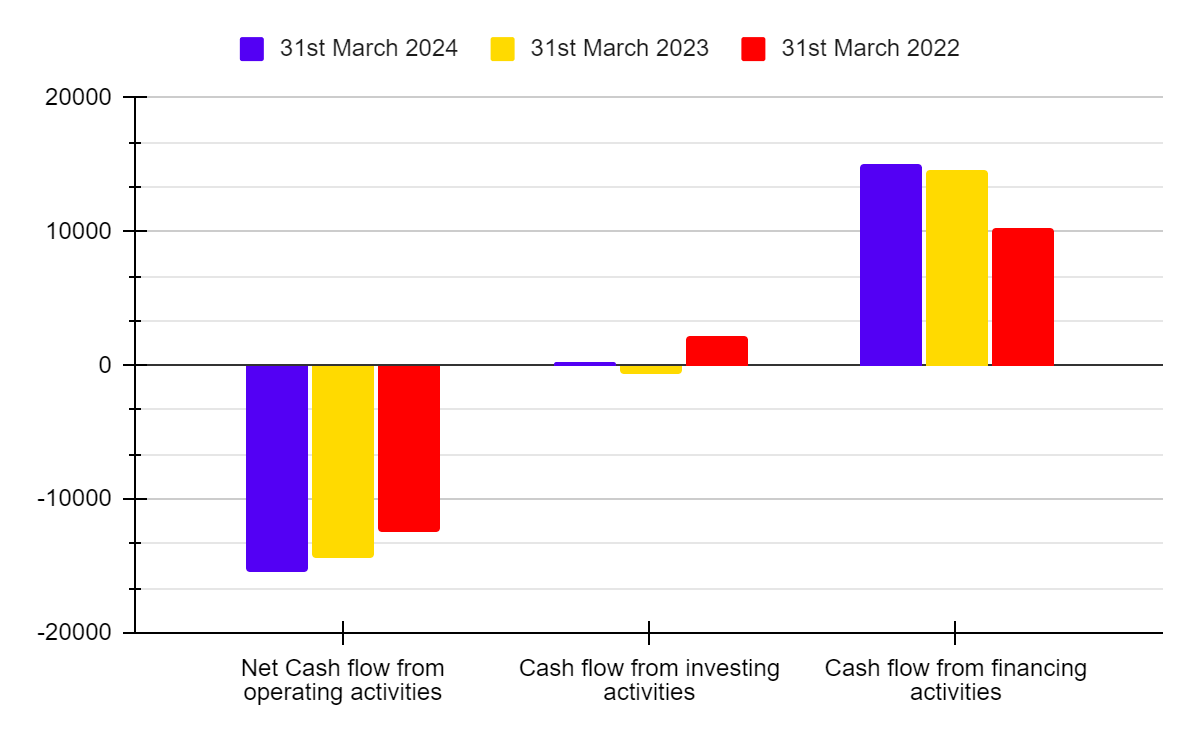
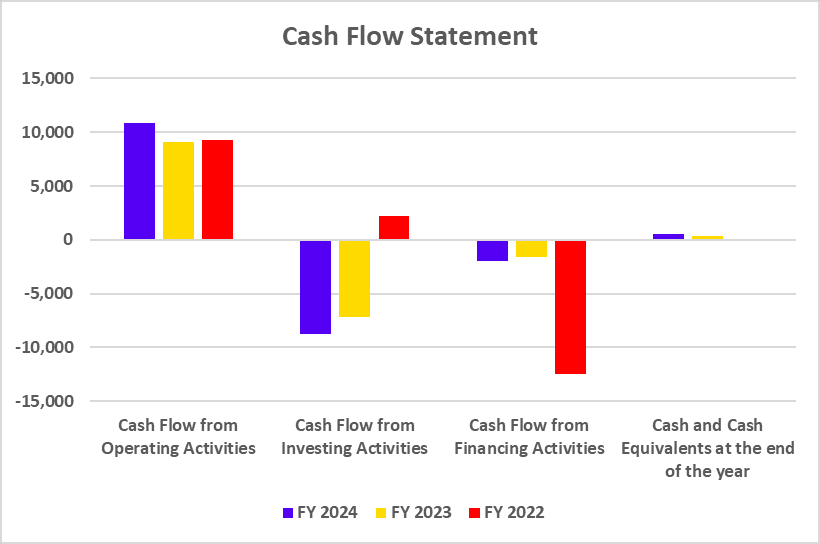
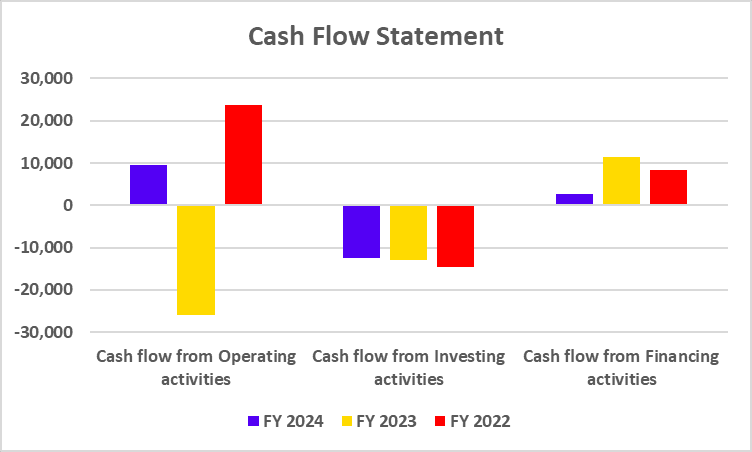
Cash Flow Statement
| Particulars | FY 2024 | FY 2023 | FY 2022 |
|---|---|---|---|
| Cash flow from Operating activities | 9,644 | -25,816 | 23,597 |
| Cash flow from Investing activities | -12,430 | -12,904 | -14,511 |
| Cash flow from Financing activities | 2,770 | 11,450 | 8,391 |
Key Performance Indicators (KPIs)
| Particulars | FY 2024 | FY 2023 | FY 2022 |
|---|---|---|---|
| Net Interest Margin (%) | 1.98 | 2.22 | 2.03 |
| Net Profit Margin (%) | 4.65 | 3.24 | 5.59 |
| ROCE (%) | 0.88 | 0.95 | 0.96 |
| CASA (%) | 30.91 | 30.77 | 31.11 |
SWOT Analysis of YES Bank.

Strengths
- Yes Bank has a strong brand image and is still recognized by customers for its innovative products and services, even after the crisis.
- It has been a leader in digital banking, providing a strong online and mobile banking platform.
- Its presence in retail, SME, and corporate banking provides a stable revenue stream.
Weaknesses
- The bank has gone through considerable financial instability in recent years, which has raised concerns about the quality of its assets and the adequacy of its capital.
- Most of Yes Bank’s loan portfolio is concentrated in the corporate sector, leading to an increased risk of NPAs in case of defaults.
- Yes Bank’s recovery largely depends on external funding, which can be risky.
Opportunities
- The bank can benefit from the growing demand for digital banking services in India by expanding its customer base and enhancing service quality.
- It also has an opportunity to expand its operations into underserved markets, especially in rural and semi-urban areas.
- The government’s efforts to strengthen the banking sector through policies like financial inclusion and digital India can create growth opportunities.
Threats
- The Indian banking sector is highly competitive, with both public and private banks and fintech companies vying for market share.
- Enhanced regulatory needs and vigilant oversight have the potential to significantly influence banking operations and profitability.
- Yes Bank faces cyber security threats as it expands digitally, which could cause financial and reputational harm.
Read Also: Small Finance Bank Share List in India
Conclusion
From facing a severe liquidity crisis to being rescued by a consortium of financial institutions, the bank has undergone drastic changes in its leadership and operations. It remains to be seen how the future unfolds for Yes Bank and whether it can regain its stability and trust in the market. However, the bank has shown impressive resilience in its recovery. While challenges persist, the future of Yes Bank appears promising. However, it is advised to consult a financial advisor before investing.
Frequently Asked Questions (FAQs)
When did the RBI take control of Yes Bank?
The Reserve Bank of India (RBI) took control of Yes Bank in March 2020.
Who is the CEO of Yes Bank?
Prashant Kumar is the Managing Director and CEO of Yes Bank.
Is Yes Bank listed on stock exchanges?
Yes Bank is listed on NSE and BSE.
What is the current market price and market capitalization of Yes Bank?
The market price of Yes Bank is INR 23.8, and the market capitalization is INR 74,610 crores on 5 August 2024.
Should I invest in Yes Bank?
Investors should thoroughly analyze the financial statements and consider other factors affecting the banking industry before investing in Yes Bank.