You save a lot of money and put in a lot of work, but you need help determining where to keep it. It is only possible to retain some of your hard-earned savings at home; opening a bank account is your only option. You might be surprised to hear that banks where you have accounts allow you to invest in their business.
This blog post will compare the State Bank of India (SBI) and ICICI Bank.
SBI Overview
State Bank of India is the largest public sector bank in India and is a titan in the Indian banking landscape with a 1/4th share in the market. SBI is headquartered in Mumbai and holds a rich heritage of over 200 years.
The roots of SBI trace back to 1806 with the establishment of the Bank of Calcutta, the first joint stock bank in British India. Three separate presidency banks – Bank of Bengal, Bank of Bombay, and Bank of Madras emerged across British India. In the year 1921, the three presidential banks merged to form the Imperial Bank of India.
In the year 1955, the government of India nationalized the Imperial Bank of India and renamed it as State Bank of India. SBI later acquired various state-associated banks and commercial banks.
SBI has played an important role in bringing banking services to rural areas. Currently, SBI holds a strong distribution network of 22,405 branches and 65,627 ATMs.
ICICI Bank Overview
ICICI Bank is among the biggest banks in India’s private sector. The government of India established the Industrial Credit and Investment Corporation of India (ICICI) on 5 January 1955. As a division of ICICI Limited, ICICI Bank was founded in 1994. It made history by being the first Indian bank and firm to list on the New York Stock Exchange. ICICI and ICICI Bank combined to form a new financial organization to increase business efficiency. Following accusations against Chanda Kochhar, the managing director of ICICI Bank, in 2018 about inappropriate lending practices, Sandeep Bakhshi assumed the role of managing director. It was the first bank to provide contactless credit and debit cards.
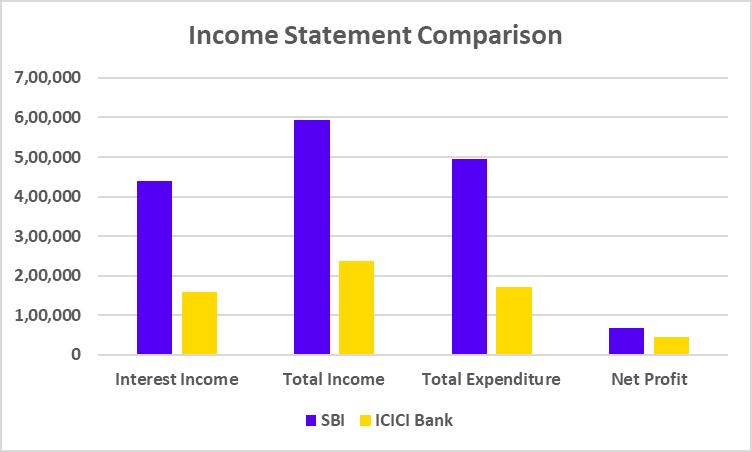
The comparison of SBI and ICICI Bank presented above leads us to conclude that while SBI has more net profit, ICICI Bank has a higher net profit margin. Although every bank has something special to offer, we always advise speaking with an investment expert before making investment decisions.
S.NO.
Check Out These Interesting Posts You Might Enjoy!
Which bank has a larger market capitalization: SBI or ICICI Bank?
ICICI Bank has a larger market capitalization than SBI as of 27 August 2024.
Which bank is more profitable: SBI or ICICI Bank?
SBI has a net profit of INR 68,244 crores compared to INR 45,007 crores for ICICI Bank for FY 2024.
Who is the CEO of ICICI Bank?
Sandeep Bakhshi is the MD and CEO of ICICI Bank.
What is the full form of ICICI Bank?
ICICI stands for Industrial Credit and Investment Corporation of India.
How was the State Bank of India formed?
State Bank of India was established in 1955 after the government of India nationalized the Imperial Bank of India and renamed it as State Bank of India.
IndiGo and SpiceJet have been important in shaping India’s aviation industry with their unique business models and operational strategies.
In today’s blog, we will take a closer look at their development and growth to gain valuable insights into the financial health of these two aviation giants.
IndiGo – An Overview
The largest and most popular passenger airline in India is InterGlobe Aviation Ltd., better known as IndiGo. Rakesh Gangwal, an Indian entrepreneur living in the US, and Rahul Bhatia of InterGlobe Enterprises established the business as a private company in 2006. The company was originally incorporated in Lucknow in 2004, and in 2006, it was converted into a public limited company, and the name was changed to InterGlobe Aviation Limited. It commenced operations in August 2006 with a fleet of 100 Airbus A320-200 aircraft. IndiGo has a strong record for punctuality, ensuring reliable travel experiences.
It operates over 2000 daily flights to 122 destinations, including 88 domestic and 34 international locations. With a fleet of over 370 aircraft, IndiGo ensures excellent connectivity and convenience for its passengers. The primary source of income for IndiGo is passenger fares.
The airline has the capability to attract a decent number of passengers through its competitive pricing and extensive network and maximizes its revenue by offering ancillary services such as baggage fees, seat selection, in-flight meals, and priority boarding. It also transports cargo, which contributes to its overall revenue.
SpiceJet – An Overview
SpiceJet is a prominent low-cost airline in India that is well-known for its affordable fares and extensive network. The airline was established in 2005 and has grown rapidly, becoming a major force in the Indian aviation sector. Originally founded as an air taxi provider in 1994, the company was known as ModiLuft. The business was bought and rebranded as SpiceJet by Indian businessman Ajay Singh in 2004.
The airline formally began operations with two Boeing 737-800 aircraft in May 2005. In terms of market share, it was ranked third among low-cost carriers in India by 2008, behind IndiGo and Air Deccan. SpiceJet provides various services, including discount coupons, travel insurance, tour packages, and flight reservations.
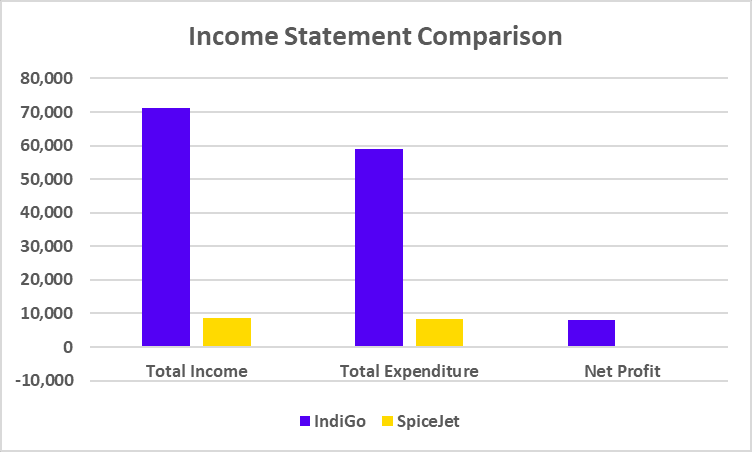
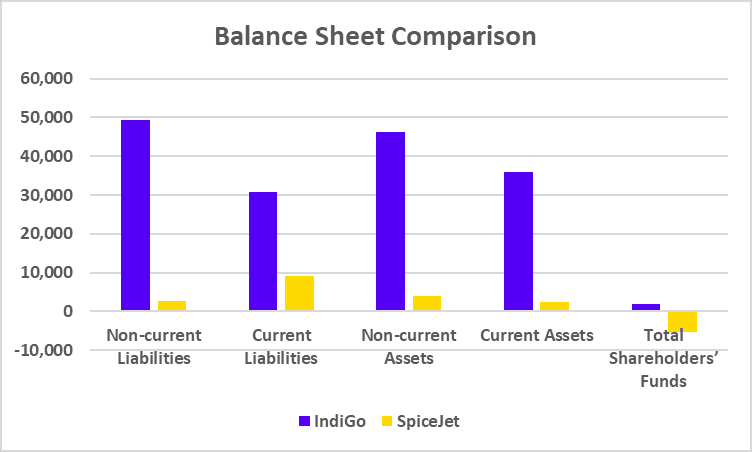
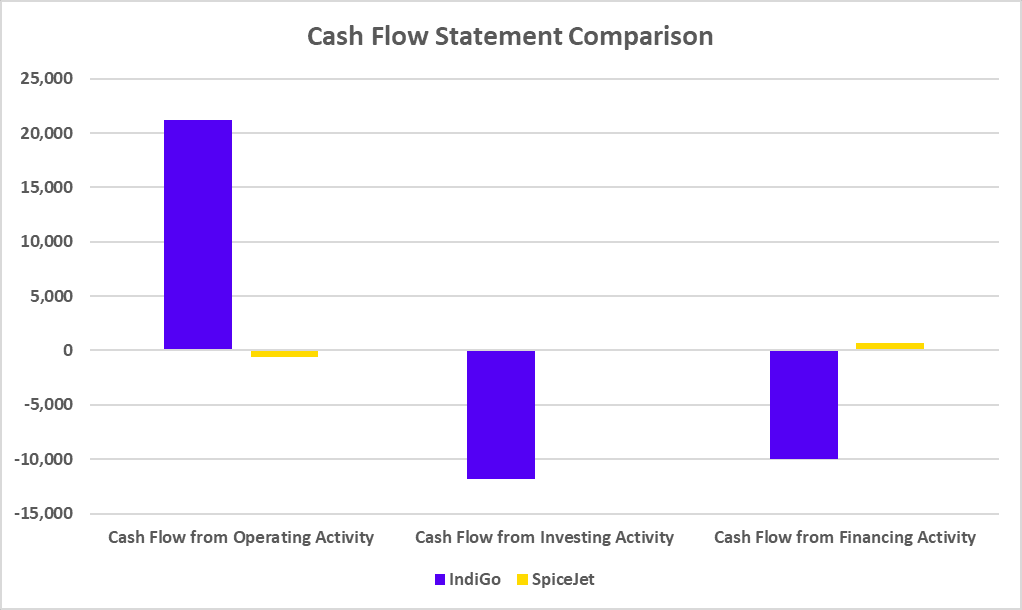
(All the above data is of the year ended March 2024)
Conclusion
IndiGo and SpiceJet are both major players in India’s aviation industry. However, there are differences in their strategies and operations. IndiGo is recognized as the dominant airline, with a strong focus on punctuality, customer service, and an extensive network. Standardizing its fleet to increase operational efficiency has been a key factor in its success. On the other hand, SpiceJet has followed a highly aggressive expansion strategy, capitalizing on its extensive network and competitive pricing to attract a significant customer base. While both airlines share a common goal of providing affordable air travel, their distinct approaches have led to different market positions. It is advised to consult a financial advisor before investing.
S.NO.
Check Out These Interesting Posts You Might Enjoy!
India is one of the world’s fastest-growing economies and is facing substantial challenges in managing its energy requirements. With a population of over 140 crore, the Government of India is making all the necessary efforts to meet the country’s rising energy needs. Two government-owned businesses, NHPC and NTPC, are responsible for energy production in India.
In today’s blog post, we’ll compare NTPC and NHPC.
NHPC Overview
The NHPC was established in 1975 by the Government of India as a division of the Ministry of Power. The company’s primary goal is to increase the nation’s hydropower output. The company has operations in Jammu & Kashmir, Uttarakhand, Arunachal Pradesh, Sikkim, etc. The corporation uses wind energy and solar energy, among other sources, to generate electricity.
In 2008, the company went public on the Indian Stock Exchange. With a hydro share of 6971.20 MW as of March 2024, the corporation has a total capacity of 7144.20 MW or 14.85% of the nation’s hydro capacity. The organization is always concentrating on using renewable energy sources to generate electricity. It also develops several infrastructure types, including tunnels, dams, and powerhouses. The company’s main office is located in Faridabad.
NTPC Overview
In response to the country’s growing need for power, the Indian government established the firm in 1975 as a public-sector corporation. The company used coal to produce electricity and is now focusing on utilizing renewable energy sources. Due to its substantial contribution to the nation’s electricity consumption, the business became India’s largest power utility in 1990. The company launched an initial public offering (IPO) in 2004 and became listed on the Indian Stock Exchange.
The corporation is diversifying its sources of electricity generation, including nuclear, solar, wind, and hydroelectric power. The firm has 94 facilities with a combined capacity of 76,134 MW, of which 52 are owned and run by NTPC, and 43 are in joint ventures or subsidiaries. The company plans to achieve a 130 GW capacity by 2032. The business produced 400 billion units of power in 2023–2024. The organization’s headquarters is in New Delhi.
In conclusion, both businesses produce power, but their methods vary: NHPC primarily draws its energy from hydroelectric sources, while NTPC draws its energy from more traditional sources like coal, gas, etc. In the fiscal year ending in 2024, both businesses reported profits and are expanding their operations in the renewable energy market. Given their bright futures, an investor should take into account the risk profile of these companies or consult a financial advisor before making any investment decisions.
S.NO.
Check Out These Interesting Posts You Might Enjoy!
Which firm, NHPC or NTPC, has a higher market capitalization?
The market capitalization of NTPC is more than that of NHPC.
What is the full form of NTPC and NHPC?
National Hydroelectric Power Corporation is abbreviated as NHPC, and the full name of NTPC is National Thermal Power Corporation Limited.
Which company is more profitable: NTPC or NHPC?
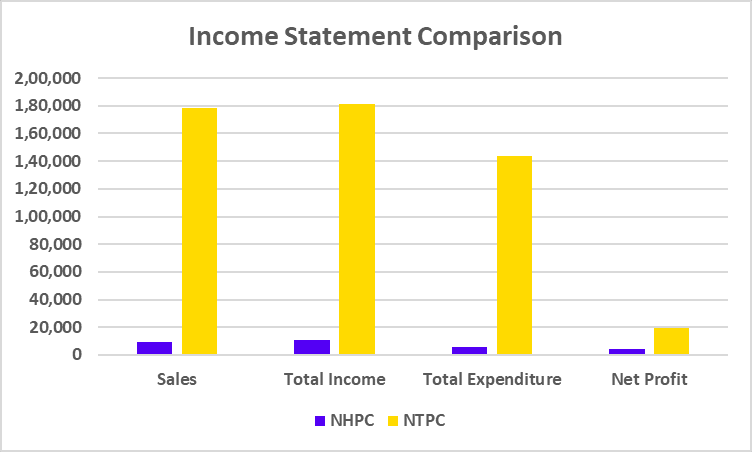
For FY 2024, NTPC generated a net profit of 19,696 crores, while NHPC reported a net profit of 4,023 crores, demonstrating that NTPC is more profitable.
What are NTPC and NHPC’s primary business activities?
While NTPC is a well-known player in the thermal power (oil, gas, and coal) generation industry, NHPC is primarily focused on hydroelectric power generation and is regarded as a major player in this area.
Which company has a more diversified business model among NTPC and NHPC?
Compared to NHPC, which mostly concentrates on hydroelectric power, NTPC has a more diverse business strategy because it generates power from various sources, including coal, gas, hydroelectric, solar, wind, etc.
The Indian economy is driven by many companies contributing to its growth and development. These companies vary in size, ownership, control, and access to capital, reflecting the country’s diverse corporate landscape. However, companies must be categorized to promote effective corporate governance.
In this blog, we will discuss the types of companies based on size, number of members, control, liability, and access to capital.
What is a Company?
A company is a legal entity formed by a group of individuals to engage in and operate a business or enterprise. It is a separate legal entity from its owners, meaning it can own assets, incur liabilities, enter into contracts, sue, and be sued. It has perpetual succession, a common seal, and is subject to statutory compliance. The purpose of the companies is generally to generate profit for their owners, although some, like Section 8 Companies, may be formed for charitable or social purposes.
List of Different Types of Companies in India
Category
Type
Definition/Act
Categorization Based on Size
Micro Enterprise
MSMED Act, 2006
Small Enterprise
MSMED Act, 2006
Medium Enterprise
MSMED Act, 2006
Categorization Based on Number of Members
One Person Company (OPC)
Section 2(62) of Companies Act, 2013
Private Limited Company
Section 2(68) of Companies Act, 2013
Public Limited Company
Section 2(71) of Companies Act, 2013
Categorization Based on Control
Sole Proprietorship
Recognized under Income Tax Act
Private Limited Company
Companies Act, 2013
Public Limited Company
Companies Act, 2013
Government-Owned Company (PSU)
Section 2(45) of Companies Act, 2013
Categorization Based on Liability
Sole Proprietorship
Not defined under Companies Act
Partnership Firm
Indian Partnership Act, 1932
Limited Liability Partnership (LLP)
LLP Act, 2008
Private Limited Company
Companies Act, 2013
Public Limited Company
Companies Act, 2013
Categorization Based on Access to Capital
Sole Proprietorship
Not defined under Companies Act
Partnership Firm
Indian Partnership Act, 1932
Private Limited Company
Companies Act, 2013
Public Limited Company
Companies Act, 2013
Section 8 Company
Section 8 of Companies Act, 2013
Here’s a detailed categorization of Indian companies based on size, number of members, control, liability, and access to capital, as per the Companies Act, 2013:
The MSME Act classifies companies based on their size to give benefits the government provides for MSMEs.
1. Categorization Based on Size
Based on the size, companies can be categorized as:
Micro, Small, and Medium Enterprises (MSMEs):
Companies are categorized based on size under the Micro, Small, and Medium Enterprises Development (MSMED) Act, 2006, but often referenced in the context of companies under the Companies Act.
Micro Enterprises:
Investment: Up to ₹1 crore.
Annual Turnover: Up to ₹5 crore.
Small Enterprises:
Investment: Between ₹1 crore and ₹10 crore.
Annual Turnover: Between ₹5 crore and ₹50 crore.
Medium Enterprises:
Investment: Between ₹10 crore and ₹50 crore.
Annual Turnover: Between ₹50 crore and ₹250 crore.
2. Categorization Based on Number of Members
Based on the number of members, companies can be categorized as:
One Person Company (OPC):
Definition: Under Section 2(62) of the Companies Act, 2013.
Members: One individual is the sole member.
Characteristics: The OPC allows a single entrepreneur to start and manage a company with limited liability, with provisions for a nominee in case of the sole member’s death or incapacity.
Private Limited Company:
Definition: Under Section 2(68) of the Companies Act, 2013.
Members: Minimum of 2 members, maximum of 200.
Characteristics: Shares are not freely transferable, and the company cannot invite the public to subscribe to its shares.
Public Limited Company:
Definition: Under Section 2(71) of the Companies Act, 2013.
Members: Minimum of 7 members, no maximum limit.
Characteristics: Can issue shares to the public, and shares are freely transferable. These companies are usually listed on stock exchanges.
3. Categorization Based on Control
Based on control, companies can be categorized as:
Sole Proprietorship:
Definition: It is not defined under the Companies Act but is recognized under various laws, such as the Income Tax Act.
Control: Controlled by a single individual.
Characteristics: The owner has full control over business operations, and there is no distinction between personal and business assets.
Private Limited Company:
Control: Controlled by directors, often with significant influence from shareholders.
Characteristics: Decisions are made by the board of directors, with major shareholders often having significant influence.
Public Limited Company:
Control: Controlled by a board of directors elected by the shareholders.
Characteristics: Ownership and management are separate, with control exercised by the elected board.
Government-Owned Companies (PSUs):
Definition: Under Section 2(45) of the Companies Act, 2013.
Control: Controlled by the government, which holds a majority stake.
Characteristics: Operates in sectors deemed crucial by the government, such as defense, energy, and infrastructure.
4. Categorization Based on Liability
Based on liability, companies can be categorized as:
Sole Proprietorship:
Liability: Unlimited liability.
Characteristics: The owner is personally responsible for all debts, and there is no legal distinction between personal and business assets.
Partnership Firm:
Liability: Unlimited liability for all partners.
Characteristics: Every partner is liable, jointly with all the other partners, for all acts of the firm.
Limited Liability Partnership (LLP):
Definition: Under the Limited Liability Partnership Act, 2008.
Liability: Limited liability for partners.
Characteristics: Partners’ liability is limited to their contribution, and the LLP has a separate legal existence. No partner is liable on account of the independent or unauthorized acts of other partners.
Private Limited Company:
Liability: Limited liability.
Characteristics: Shareholders are liable only up to the value of their shares, which means shareholders are not liable to sell their personal assets in case of a loss.
Public Limited Company:
Liability: Limited liability.
Characteristics: Shareholders are not personally liable for the company’s debts beyond the amounts of their investments.
5. Categorization Based on Access to Capital
Based on access to capital, companies can be categorized as:
Sole Proprietorship:
Access to Capital: Limited.
Characteristics: Funding is typically from personal savings, small loans, or family resources.
Partnership Firm:
Access to Capital: Moderate.
Characteristics: Partners pool their resources with additional funding from loans based on the firm’s credit.
Private Limited Company:
Access to Capital: Moderate to high.
Characteristics: Can raise capital through private placements, venture capital, or loans but cannot raise capital from the public.
Public Limited Company:
Access to Capital: High.
Characteristics: Can raise capital by issuing shares and debentures to the public, listing on stock exchanges, and other financial instruments.
Section 8 Company:
Definition: Under Section 8 of the Companies Act, 2013.
Access to Capital: Limited to donations, grants, and philanthropic funding.
Characteristics: Cannot distribute profits to members; profits are reinvested in the company’s objectives.
Each of these categories presents a different aspect of how companies in India are structured and operate, from the scale of their operations to their financial and legal framework.
There are different types of companies in India, so different stakeholders, like entrepreneurs, investors, and businesses, can operate efficiently within a legal framework. Every company serves a different purpose, from small startups to large multinational corporations, providing flexibility in terms of ownership, control, liability, and access to capital, as there are different regulations for different types of companies. Understanding these different types of companies is important for anyone looking to start, manage, or invest in a business in India.
S.NO.
Check Out These Interesting Posts You Might Enjoy!
An OPC, or a One Person Company, is a type of company in India where a single individual can own and manage the business with limited liability protection. It is ideal for entrepreneurs who want to maintain full control while enjoying the benefits of a corporate structure.
What is the difference between a Partnership Firm and a Limited Liability Partnership?
A Partnership Firm is a business owned by two or more individuals with unlimited liability, where partners are personally liable for the business’s debts and liabilities. On the other hand, an LLP provides limited liability protection to its partners, meaning they are only liable to the extent of their investment.
What is a Section 8 Company?
It is a non-profit organization in India that promotes social welfare activities such as education, arts, environment preservation, sports, charity, etc. These companies reinvest their profits and enjoy tax benefits and other exemptions.
Can a foreign company establish a business in India?
A foreign company can establish a business in India through various routes, including a joint venture with an Indian partner or establishing a branch office, liaison office, or project office. India’s Foreign Direct Investment (FDI) policy controls these processes.
What are the criteria for qualifying as a Micro Enterprise?
Investment in the plant and machinery can’t exceed INR 1 crore, and annual turnover must not exceed INR 5 crore for a company to qualify as a Micro Enterprise.
You save a lot of money and put in a lot of work, but you need help determining where to keep it. It is only possible to retain some of your hard-earned savings at home; opening a bank account is your only option. You might be surprised to hear that banks where you have accounts allow you to invest in their business.
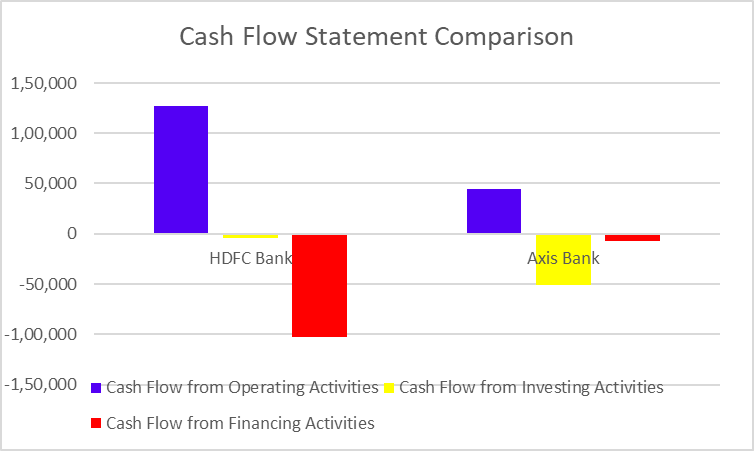
This blog post will compare HDFC Bank and Axis Bank.
HDFC Bank Overview
HDFC Bank was established in 1994 as a subsidiary of HDFC Ltd. The Reserve Bank of India granted it a banking license in January 1995. In November 1995, the bank launched its Initial Public Offering (IPO) and became a listed company on the Bombay Stock Exchange and the National Stock Exchange. In 2000, the Times Bank merged with HDFC Bank. HDFC Bank acquired Centurion Bank of Punjab to increase its branch network and clientele. The bank’s business philosophy is based on five core values: Operational Excellence, Customer Focus, Product Leadership, People, and Sustainability.
HDFC Ltd. or Housing Development Finance Corporation Ltd. was merged with HDFC Bank in 2023, The merger officially came into effect on July 1,2023 it’s India’s largest-ever M&A deal. The bank provides a wide range of financial products and services, such as retail banking, wholesale banking, loans, credit cards, savings accounts, current accounts, investment products, etc. The company’s headquarters is in Mumbai.
Axis Bank was initially established as UTI Bank by a joint venture between the Life Insurance Corporation of India, Unit Trust of India (UTI), and other business houses. UTI Bank’s operations started in 1994 when the first branch in Ahmedabad was opened. In 2007, UTI Bank was renamed “Axis Bank”. It soon became a well-established and recognized bank in the Indian Banking sector. This was a turning point in the history of Axis Bank because it became an aggressive player with a focus on branch expansion and innovation. Additionally, Axis Bank consistently made an effort to diversify its product portfolio. The bank now offers a variety of financial products, including credit cards, savings accounts, current accounts, brokerage facilities, and retail banking..
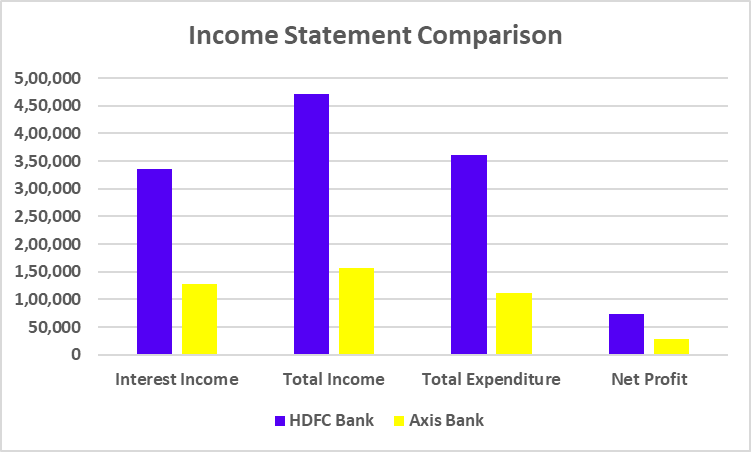
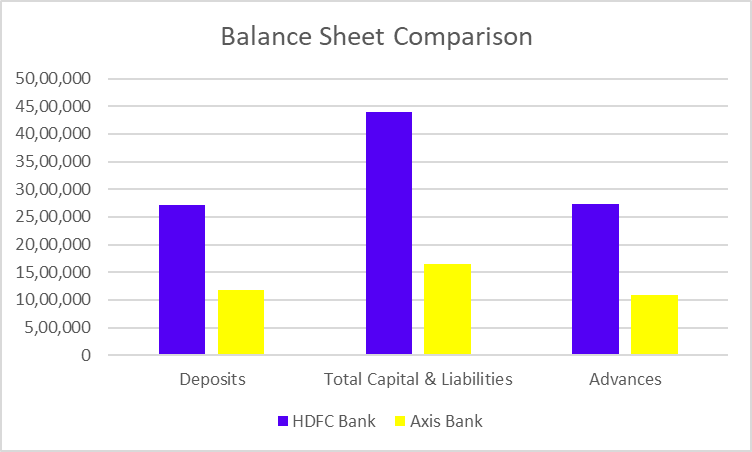
The comparison of India’s biggest private sector banks presented above leads us to conclude that while HDFC Bank has more revenue and profits overall, Axis Bank posts higher net profit margins even with less revenue. Although every bank has something special to offer, we always advise speaking with an investment expert before making investment decisions.
S.NO.
Check Out These Interesting Posts You Might Enjoy!
A small change in the interest rate can have a significant impact on stock markets, debt markets, etc. Let’s dive deeper to understand the connection between interest rate changes and their impact on the economy and on different asset classes.
In this blog, we will discuss the impact of recent interest rate changes introduced in Japan on financial markets.
Interest Rate Changes and Its Impact
Interest rate changes have a significant impact on the economy, stock market, currency market, and even debt markets. Here’s a breakdown of its impact on each of these areas :
Impact on the Economy
Interest rate changes impact the economy in the following ways:
Consumer Saving: Higher interest rates make borrowing more expensive; hence, reducing consumer spending or saving becomes more attractive, as an increase in interest rates will increase the returns on savings accounts. Lower interest rates will have the opposite impact.
Business Investment: Interest rate changes affect not only consumer spending but also business investments. Higher rates will increase the cost of borrowing, which reduces expansion activities and investments in new projects. On the other hand, a rate decrease will be positive for businesses as lower rates reduce the cost of capital, encouraging them to invest and expand.
Inflation: Central banksincrease interest rates to curb inflation while decreasing interest rates have the opposite effect.
Economic Growth: Interest rate increases can slow down economic growth, as higher borrowing costs will lead to reduced consumption and investment. In contrast, interest rate decreases are generally positive and boost economic growth by encouraging spending and investment.
Impact on the Currency Market
Interest rate changes impact the currency market in the following ways:
Currency appreciation or depreciation: Higher interest rates attract foreign investors, as returns will be higher. This will increase the demand for the currency, which in turn will lead to its appreciation. The currency depreciates if the interest rate is reduced.
Capital Flows: Foreign capital through the FDI route will increase as investors seek higher returns, and the opposite will be true for interest rate decreases.
Impact on the Stock Market
Interest rate changes impact the stock market in the following ways:
Valuation of Stocks: Higher interest rates can reduce the present value of future earnings of the companies, leading to lower stock prices. This is especially true for growth stocks, where expected future earnings make up a larger portion of their valuation. The opposite is true for interest rate decreases.
Corporate Profits: An interest rate increase will increase the borrowing costs or cost of capital for the companies, which can reduce profitability and lead to lower stock prices.
Sectoral Impact: An interest rate increase will impact certain sectors, such as utilities, automobiles, real estate, etc., which rely heavily on debt financing. These sectors may suffer, while financial institutions (like banks) may benefit from higher loan margins.
Impact on Debt Market
Interest rate changes significantly impact debt markets, influencing everything from bond prices to yields and overall market dynamics. Here’s how interest rates affect debt markets:
Bond Prices and Yields: They have an inverse relationship, as when interest rates rise, bonds with lower interest rates become less attractive, causing their prices to fall. New bonds are issued at higher rates, making older bonds less valuable. The opposite is true when interest rates fall; existing bonds with higher interest rates become more attractive, causing their prices to rise as they offer better returns than newly issued bonds.
Borrowing Costs: When interest rates rise, new debt issuance by corporations or governments will become more expensive as they must offer higher yields to attract investors.
Credit Risk and Default Risk: Higher rates can widen credit spreads, and investors demand a higher premium to compensate for the increased risk of default in a higher interest rate environment. If the interest rate decreases, credit spreads may narrow.
Carry Trade: An Explanation
Carry trade is a strategy in which an investor borrows money in a low-interest-rate currency and invests in an asset denominated in a currency with a higher interest rate. The investor first borrows funds in a currency with a lower interest rate and invests the borrowed funds in an asset denominated in a currency with a higher interest rate to earn the interest rate differential, which is the difference between two interest rates minus any transaction cost. The goal of the carry trade is to capture the difference or spread.
Role of JPY in Carry Trade
Historically, Japan has had one of the lowest interest rates across the globe, which has made the Japanese Yen (JPY) a popular funding currency for traditional carry trades. However, recent changes in Japan’s monetary policy have affected the global carry trade dynamics.
A recent interest rate hike in Japan by the Bank of Japan (BoJ) had a huge impact on the Japanese markets, leading to significant volatility. Their central bank hiked the interest rates from 0% to 0.25%, which was unexpected. The policy change was required to stabilize the Yen in a high inflationary environment for currency stability and economic growth.
The Japanese currency will continue to strengthen if the BoJ (Bank of Japan) continues to tighten the monetary policy. Higher interest rates or the expectation of higher rates can attract foreign investment into Yen-denominated assets, increasing demand for the Yen. As the Yen appreciates, investors who previously engaged in traditional carry trades (borrowing in Yen to invest in higher-yielding currencies) might start unwinding these trades, reversing their positions by selling high-yielding currencies and buying back Yen.
The recent interest rate hike and weakening US economic outlook led to a sharp decline in Japanese equities and US equity markets. The Nikkei 225 experienced a big drop and plunged more than 20% between August 1st and August 5th, 2024. The decline was particularly evident in the technology and semiconductor sectors due to concerns over US restrictions on chip exports to China and broader market trends because of the reversal of carry trade, which is funded through Japanese Yen and invested in US technology stocks.
Despite this turmoil, domestic factors, such as rising wages and strong consumption, resulted in a subsequent recovery of Japanese equities. These are short-term fluctuations, and as per the broader outlook, the market will absorb the impact of the rate hike slowly. There will be a potential recovery driven by continued wage growth and strong domestic demand.
Impact on the Indian Economy
The reverse carry trade or the unwinding of traditional carry trades can increase volatility in currency markets worldwide. The flow of capital back into Yen as they have increased the interest rate could also pressure other currencies to weaken, particularly those that were previously beneficiaries of carry trade strategies. The Indian currency was not directly involved in carry trades, so the direct risk is minimal for Indian markets. However, this shift can have broader implications for global financial markets, as changes in exchange rates and interest rate expectations influence everything from equity markets to bond yields.
To conclude, the interest rate is a mechanism through which central banks manage inflation, promote economic growth, and facilitate financial stability. They also have other tools, but the interest rate mechanism holds a special role. Some negative impacts can be seen in the short term, but in the long run, it promotes growth and enhances stability. The interest rate hike was aimed to slow down the economy and curb inflation. It also strengthens the currency but can negatively affect stock markets, especially debt-reliant sectors. Interest rates are decreased to stimulate the economy and boost stock market returns, particularly in growth-oriented and rate-sensitive sectors, but it weakens the currency.
S.NO.
Check Out These Interesting Posts You Might Enjoy!
The main risks include interest rate risk (change in interest rates) and exchange rate risk (exchange rate moves unfavorably).
How does a reverse carry trade differ from a traditional carry trade?
A reverse carry trade involves borrowing in a high-interest-rate currency and investing in a low-interest-rate currency. This strategy is used when an investor expects the low-interest rate currency to appreciate against the high-interest rate currency.
Why is the Japanese Yen often used in carry trades?
The Japanese Yen has historically had very low interest rates because of their loose monetary policy, making it a popular currency to borrow for carry trades.
Do global events affect carry trades?
Carry trades are sensitive to global events, such as monetary policy changes, political instability, geopolitical tensions, economic crises, etc.
On a Sunday, you decide to relax at home with a cup of coffee and some Maggie. You probably won’t believe it when you learn that Nestle India Limited, a single FMCG company, makes the ingredients you’ll be using.
In today’s blog post, we’ll talk about Nestle India, one of the biggest FMCG Companies in India.
Nestle India Company Overview
Nestle, the world’s biggest food and beverage company, has a long and illustrious history that began in the 1860s. The narrative begins with the formation of the Anglo-Swiss Condensed Milk Company in 1866, which produced ground-breaking milk products. Simultaneously, a German pharmacist, Henri Nestle, invented “Farine Lactee” to lower the newborn death rates. These businesses were successful because of their creative milk products, which catered to urban consumers with shifting lifestyles. The two businesses merged in 1905 to form Nestle.
The company’s main goal is to offer food and beverage items to clients of all ages and backgrounds. Its main offerings include frozen foods, baby formula, nutritious bars, instant coffee, and more.
Business Model of Nestle India
Nestle’s business strategy is built around utilizing its well-known brand and widespread reach. It operates in 191 nations and has a research department in nearly all major nations. It has formed strategic alliances with many global brands and acquired many businesses. An effective supply chain can guarantee prompt product delivery to clients, and maintaining quality standards encourages brand loyalty.
Product Portfolio
Nestle provides a large selection of products to its customers. In addition to boosting the nutritional value of its products while retaining the same level of flavor, Nestle is dedicated to innovation to fulfill the evolving demands of its customers. The company offers its products to customers through partnerships with dairy farms and various retail locations. Nestle owns numerous brands such as Nespresso, Nescafe, Kit Kat, Maggi, etc., and its 29 brands have annual sales of over $1.1 billion.
Global Presence – With a significant presence in more than 190 countries, the company is regarded as the most well-known firm in the FMCG sector.
Variety:- Nestle is not dependent on one product as it has numerous brands with billions of dollars in annual sales.
Research – The business makes significant investments in product R&D, enabling it to adjust to the shifting customer preferences.
Weaknesses
Product Pricing – The company could lose market share because it caters to a higher-end consumer base.
Supply Chain – Due to the intricate nature of the company’s distribution system, any disruption in the supply chain may affect the company’s earnings.
Product Criticism – The company’s product has been criticized for quality issues recently.
Opportunities
Technological Advancement – The corporation will be able to lower production costs by integrating digital technologies into the business processes.
Product Diversification – Since consumers are becoming health conscious, the corporation can add healthier products to its lineup.
E-Commerce – E-commerce platforms allow the business to boost digital or online sales.
Threat
Competition – The price war between businesses can lower the company’s profit margin.
Economic Downturn – Any downturn in the economy will result in less demand for their products, which will immediately affect the company’s sales and earnings.
Changing Consumer Preferences – Consumer preferences are ever-evolving; therefore, if a business cannot adapt, it will lose customers.
Conclusion
In summary, Nestle India is a leading fast-moving consumer goods (FMCG) company in India that provides a wide range of products to meet the demands of its clients. The business is present in more than 190 countries worldwide. NESTLE is working to enhance its product line, but it has already experienced some negative feedback from customers regarding the quality of its products. Even if the company has a bright future, you should speak with your investment advisor before investing.
S.NO.
Check Out These Interesting Posts You Might Enjoy!
Who is the Chairman and Managing Director of Nestle India Ltd.?
Suresh Narayanan is the company’s current Chairman and Managing Director (CMD).
Is Nestle India a good stock to buy?
Nestle India’s global presence and diverse product range give it a competitive edge, but investing in this stock involves a number of other risks, including changing customer preferences, price competition, etc. Investors should carefully assess their risk tolerance and speak to a financial advisor before making any decisions.
Where is Nestle India headquartered?
The headquarters of Nestle India is situated in Gurgaon.
Is Nestle India a profitable company?
The business has been consistently profitable for the previous three years, and its profits are consistently rising.
In what ratio is the share of Nestle India split?
In 2024, the management of Nestle India approved a stock split in a 1:10 ratio, meaning that one share with a face value of INR 10 would be divided into ten shares with a face value of INR 1 for each equity share.
The Indian IT industry is a global powerhouse, contributing to the nation’s economic growth. With the digital revolution, this industry has the potential to offer exciting investment opportunities for investors. However, with several IT companies vying for attention, TCS has been at the forefront of the global IT industry for over 5 decades. With an unwavering commitment to innovation and digital transformation, the company has played a vital role in empowering organizations to harness the power of technology.
In today’s blog, we will explore TCS’s rich history, business model, and services it offers.
TCS Company Overview
Tata Consultancy Services (TCS) is an Indian multinational IT services and consulting company. TCS is headquartered in Mumbai and has more than 6,00,000 employees in 55 countries.
TCS was founded in 1968, when Mr Fakir Chand Kohli, known as the Father of India’s IT industry, brought together a young team of IT professionals to provide punched card services to its sister company, TISCO (now Tata Steel). In the early years, TCS played an important role in establishing India’s IT industry. It was one of the first companies to provide software development and IT services. TCS has expanded its operations beyond India to have a significant presence in countries across America, Europe, Asia Pacific, the Middle East, and Africa, recognizing the growth opportunities in the global market.
Business Model OF TCS
TCS operates on a service-based business model that allows it to offer tailored solutions to meet each client’s specific needs. This approach has contributed to TCS’s success in building long-term relationships with its customers.
TCS offers a range of IT services, which are discussed in the next section.
Services offered by TCS
TCS offers the following services:
TCS BaNCS – A banking and financial solutions platform. 8 out of the top 10 custodian and asset management firms run on TCS BaNCS. This service is used by 30% of the global population in over 100 countries.
TCS ADD – ADD stands for Advanced Drug Development, and TCS ADD is an advanced software suite that uses AI to transform drug development and clinical trials.
TCS CHROMA – It is a cloud-based HRMS platform with in-built intelligence and smart automation. HRMS stands for human resource management system
TCS OmniStore – It is an AI-powered commerce platform for seamless customer experiences. It offers a unified, personalized checkout experience for shoppers on different channels.
Ignio – AI-driven automation platform for IT and business operations with end-to-end closed-loop automation
TCS MasterCraft – Digital platform to optimally automate and manage IT processes.
Quartz Smart Solutions – It combines on-chain services deployed on blockchain and off-chain services residing in traditional files. The service ensures that business processes that are well suited for the blockchain are deployed on it.
Furthermore, their customer-centric approach ensures that TCS products not only meet the needs and expectations of customers but also drive tangible results and create value for their businesses. With a deep understanding of market trends and technologies, TCS can deliver innovative solutions that make a difference.
Market Details of TCS
Current Market Price
INR 4,196
Market Capitalization
INR 15,17,719 Crores
52 Week High
INR 4,431
52 Week Low
INR 3,311
P/E Ratio (x)
31.9
(Data as of 12 August 2024)
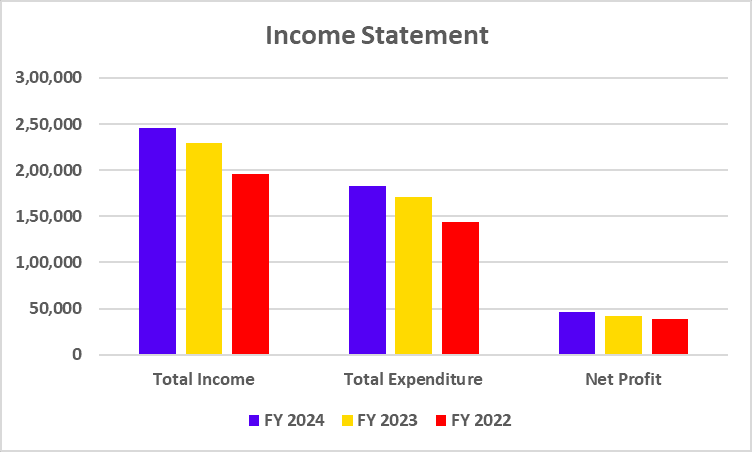
TCS Financial Statements
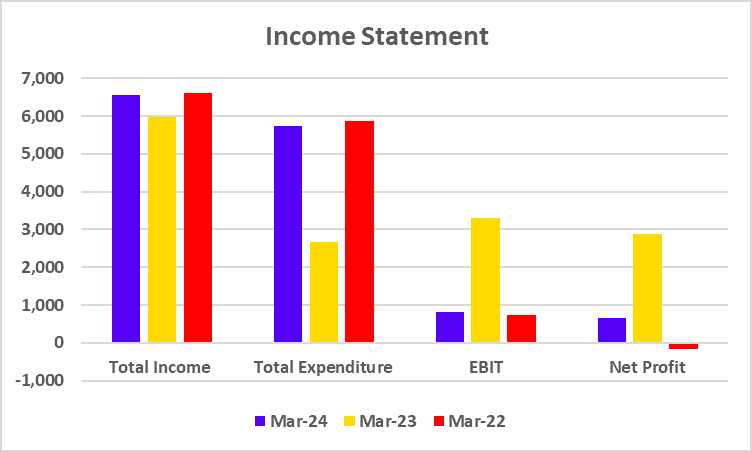
Income Statement
Particulars
FY 2024
FY 2023
FY 2022
Total Income
2,45,315
2,28,907
1,95,772
Total Expenditure
1,82,540
1,71,221
1,43,301
Net Profit
46,099
42,303
38,449
(The figures mentioned above are in INR crores unless mentioned otherwise)
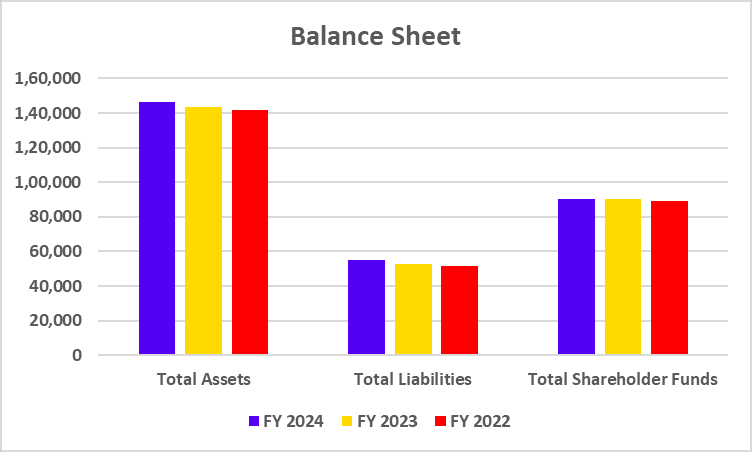
Balance Sheet
Particulars
FY 2024
FY 2023
FY 2022
Total Assets
1,46,449
1,43,651
1,41,514
Total Liabilities
55,130
52,445
51,668
Total Shareholder Funds
90,489
90,424
89,139
(The figures mentioned above are in INR crores unless mentioned otherwise)
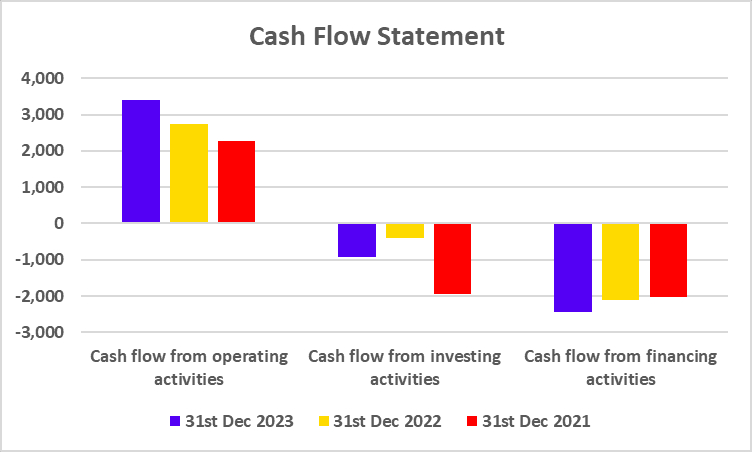
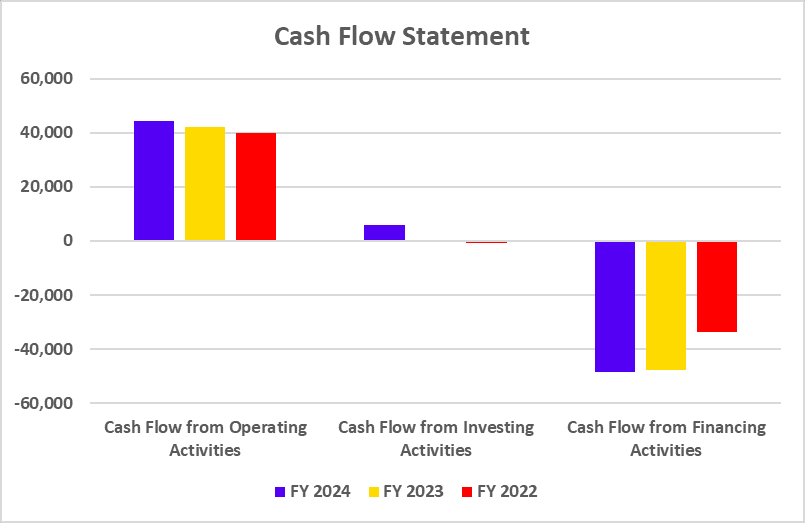
Cash Flow Statement
Particulars
FY 2024
FY 2023
FY 2022
Cash Flow from Operating Activities
44,338
41,965
39,949
Cash Flow from Investing Activities
6,026
39
-897
Cash Flow from Financing Activities
-48,536
-47,878
-33,581
(The figures mentioned above are in INR crores unless mentioned otherwise)
TCS has global operations that allow it to offer affordable and high-quality IT services to clients all over the world.
TCS focuses on industry-specific solutions and has expertise in providing IT solutions to the banking, finance, insurance, retail, and manufacturing sectors.
It has a large and skilled workforce, allowing it to handle complex IT projects.
Being a part of the TATA group of companies, TCS benefits from robust financial support, which empowers it to make significant investments in research and development, acquisitions, etc.
Weaknesses
TCS relies heavily on a few major clients, which is risky.
Talent retention is a challenging task, as it needs to maintain a high level of employee satisfaction and ensure that they stay loyal to the company.
Geographical concentration can have a significant impact on revenue when there is an over-dependence on specific regions.
Opportunities
TCS can benefit from the increasing demand for digital transformation services.
Exploring opportunities in AI, the Internet of Things (IoT), blockchain, and other emerging technologies can help TCS grow.
TCS can also focus on strengthening its partnerships with technology providers to gain a competitive edge in the market and enhance its offerings.
Threats
The IT industry is very competitive, with many global companies competing for market share.
Global economic recessions can cause a decrease in IT expenditure.
TCS has firmly established itself as a global IT services behemoth and is renowned for its robust financial position, large talent pool, and wide range of services. The company’s focus on new technologies and flexibility in adapting to changing markets have been important for its success. Despite facing intense competition and economic uncertainties, TCS carries out its business operations efficiently. To maintain its leadership, the company must invest in research and development, build strong client relationships, and effectively manage risks.
S.NO.
Check Out These Interesting Posts You Might Enjoy!
Our natural resources are at the point of exhaustion, and renewable energy is the only way to fulfill the energy demands in future. India is ranked fourth in the world in renewable energy installed capacity. Firms engaged in manufacturing wind turbines will have a crucial role in harnessing wind energy and moving towards a sustainable future.
Suzlon Energy Ltd is one the companies engaged in the renewable energy sector. In today’s blog post, we will share the overview and business model of Suzlon Energy. Moreover, we will discuss its financial performance and do a SWOT analysis of the company.
Suzlon Energy Company Overview
Suzlon Energy is an Indian multinational wind turbine manufacturer with its headquarters in Pune. It was established in 1995 by Mr. Tulsi Tanti and is now a leader in providing renewable energy solutions. Suzlon’s efforts in wind energy reduce 53.37 million tonnes of CO2 emissions annually by generating 54.62 TWh of clean energy each year. The company has operations in 17 countries and has installed more than 13,000 wind turbines.
Business Model of Suzlon Energy
Suzlon Energy has mastered the “Concept to Commissioning” Suzlon business model to provide comprehensive renewable energy solutions to its clients. The “Concept to Commissioning” model involves the following steps:
Feasibility Studies
Complex Engineering Design
Manufacturing of wind turbines and components
Installation
Commissioning of wind farms
24*7 operations and maintenance
Since its inception, Suzlon has grown significantly, reaching a global presence with installations in 17 countries. It is the only Indian company to reach 20 GW wind energy installations.
Product Offerings
Suzlon Energy provides the following products:
S120 Wind Turbine Generator: S120 has a 2.1 MW capacity and is available in three variants. This product is suitable for low-wind sites.
S133 Wind Turbine Generator: S133 has a 3 MW capacity and can be installed in any wind site.
S144 Wind Turbine Generator: It is the latest model of wind turbine generator developed by Suzlon with 40% higher power generation than other models.
Technological expertise: The company excels in wind turbine technology, providing efficient and cost-effective solutions. Suzlon invests in R&D to continually improve turbine design and efficiency.
Market position: Suzlon is a leading player in India’s wind energy market and has a strong market share.
Weaknesses
High Debt: Suzlon’s profitability and ability to invest in new projects have been significantly reduced due to high debt levels.
Operational Challenges: Suzlon has been facing operational challenges, such as delayed project execution and increased costs.
Low cash flow from operations: Company financials show lower cash inflow from operating activities for the last 2 years.
Opportunities
Growing demand for renewable energy: The demand for the company’s products will increase in future, which will result in increased revenues and profits
Strategic Partnerships: Suzlon can expand its operations in international markets by forming strategic alliances with other companies.
Threats
Regulatory Changes: Changes in government policies can have a negative impact on the company’s profitability.
Environmental Risks: Suzlon Energy has been majorly involved in harnessing wind energy, and any changes in wind patterns can affect energy production.
Suzlon Energy Ltd., a known company in India’s renewable energy sector, uses its technological expertise to provide renewable energy solutions to its clients. The company’s ability to provide effective solutions makes it the market leader in the renewable energy industry. However, variable cash flow from operations, high P/E ratio, etc., also represent significant risks. Investors must thoroughly analyze the financial statements, gauge their risk tolerance capacity, or consult a financial advisor before investing.
S.NO.
Check Out These Interesting Posts You Might Enjoy!
Suzlon operates in 17 countries, showcasing its global reach and expertise in wind energy solutions.
Does Suzlon offer any hybrid energy solutions?
Suzlon also provides wind-solar hybrid solutions, combining wind and solar power for enhanced power generation.
What is Suzlon’s role in India’s renewable energy landscape?
Suzlon is one of the top companies in India’s renewable energy sector, contributing significantly to the country’s wind power capacity.
How does Suzlon manage its financial challenges?
Suzlon is actively working on reducing its debt and improving profitability through strategic investments and operational efficiency.
What is Suzlon Energy’s business model?
Suzlon Energy works on the “Concept to Commissioning” model, which indicates the company’s ability to provide service to its customers, starting from concept development to 24*7 operations and maintenance of the commissioned equipment.
Imagine you are constructing your dream house, and you need some raw materials. Have you ever wondered where these raw materials come from? Companies such as Vedanta are involved in the production of these raw materials. The raw materials include steel, aluminum, copper wires, etc.
In this Vedanta Case Study, we explore the company’s overview, business model, financial performance, and SWOT analysis to understand its market position.
Vedanta Company Overview
The business was founded in 1979 under the name Sterlite Industries (India) Limited, and its initial focus was on the production of wires and cables for the telecommunications sector. In 1992, the company changed its focus and concentrated on smelting and refining copper. In 2003, the business formed a parent company in the United Kingdom called Vedanta Resources Limited, listed on the London Stock Exchange. A prominent operator in the Indian iron ore mining industry, Sesa Goa Limited was eventually purchased by Vedanta in 2007. Subsequently, the business bought Cairns India and Cairns Energy, a significant player in the oil and gas industry. The company’s headquarters is situated in Mumbai.
Business Model of Vedanta
The Vedanta Business Model has diversified operations because it operates in a variety of fields. It offers various commodities such as zinc, aluminum, iron, steel, etc. The company controls the entire value chain, which helps it achieve operational efficiency and high-quality products. The corporation can maintain a steady supply of products because of its huge natural reserves in Africa and India. The company has also completed several acquisitions to establish itself as a major player in the mining industry.
Product Portfolio of Vedanta
The corporation is a major participant in the commodities market and offers a wide range of commodities, such as zinc, lead, copper, steel, aluminum, semiconductor, etc. The company is involved in the production and exploration of natural gas and oil reserves in the oil and gas industry.
Market Details of Vedanta Ltd.
Vedanta Ltd. is a globally diversified natural resources company listed on BSE and NSE, with a significant market capitalization and an extensive portfolio in metals, mining, and energy.
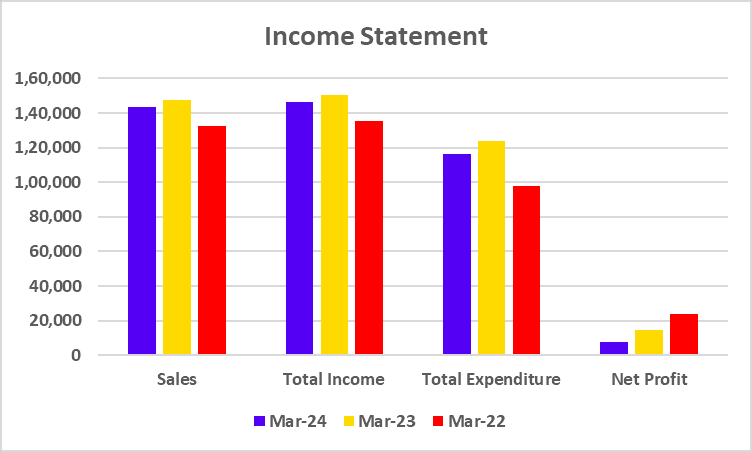
(The figures mentioned above are in INR crores unless mentioned otherwise)
The above graph shows that the company’s net profit has been decreasing for the last three years.
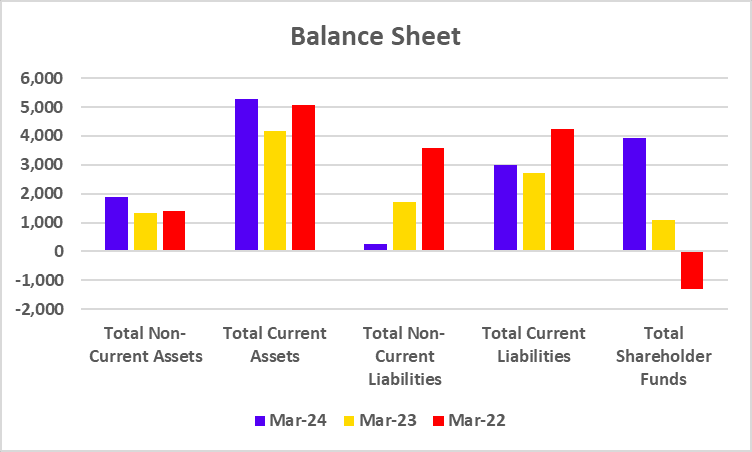
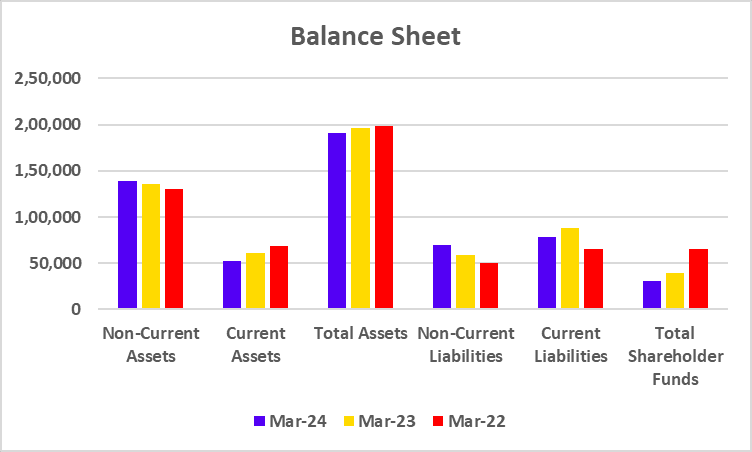
Balance Sheet
Particulars
March 2024
March 2023
March 2022
Non-Current Assets
1,38,883
1,35,849
1,30,025
Current Assets
51,924
60,507
68,575
Total Assets
1,90,807
1,96,356
1,98,600
Non-Current Liabilities
70,075
58,901
50,181
Current Liabilities
78,661
88,026
65,713
Total Shareholder Funds
30,724
39,425
65,385
(The figures mentioned above are in INR crores unless mentioned otherwise)
Based on the graph, we can conclude that the company’s non-current liabilities have increased over the past three years, whereas its shareholder funds have declined.
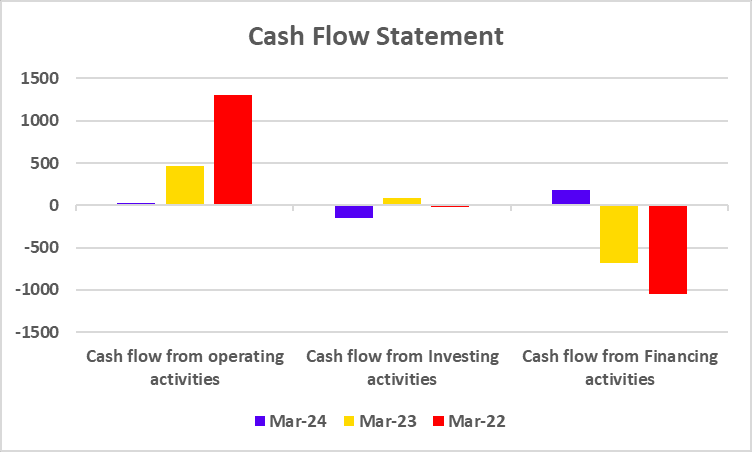
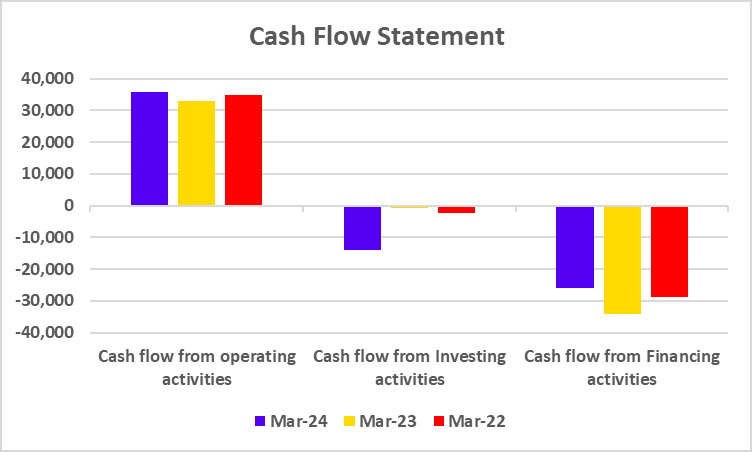
Cash Flow Statement
Particulars
March 2024
March 2023
March 2022
Cash flow from operating activities
35,654
33,065
34,963
Cash flow from Investing activities
-13,868
-693
-2,253
Cash flow from Financing activities
-26,092
-34,142
-28,903
(The figures mentioned above are in INR crores unless mentioned otherwise)
We may conclude from the above graph that, aside from the company’s cash flow from operations, cash flow from financing and investing is negative.
Key Performance Indicators (KPIs)
Particulars
March 2024
March 2023
March 2022
Operating Margin (%)
18.80
18.13
29.02
Net Profit Margin (%)
5.24
9.84
17.86
ROCE (%)
24.09
24.66
28.99
Current Ratio
0.66
0.69
1.04
Debt to Equity Ratio
2.34
1.68
0.81
SWOT Analysis of Vedanta
Strengths
Product Portfolio – By providing a large selection of commodities to its clients, the business reduces its reliance on a single commodity and increases the stability of its revenue stream.
Brand Image – Over time, the organization has developed a strong brand image that helps in client acquisition.
Volatility in Prices – Commodities price fluctuations will immediately affect the company’s profit margin.
High Debts – Due to ongoing interest payments and restrictions on taking on new projects, the company’s large debt load has a negative impact on its profit.
Environmental Concern – The business may have to deal with strict government regulations and environmental issues, which could have an effect on how it operates.
Opportunities
Technological Advancement – Utilizing cutting-edge new technologies in the exploration and production processes will benefit the business by lowering costs and boosting profit margins.
Renewable Energy – Because there is a growing market for renewable energy, the corporation can move towards clean energy sources.
Infrastructure Development – India’s infrastructure is expanding at a rapid pace, which may raise demand for products offered by Vedanta.
Threats
Competition – The mining industry has many participants, and the competition between them will lower the company’s profit margin.
Economic Condition – Negative economic conditions may decrease Vedanta’s revenues and profit margins.
Government Policies – The operations of the corporation will be immediately impacted by any policy changes made by the Indian government.
In conclusion, Vedanta Limited is a well-known participant in the Indian metal and energy sector. The firm has a wide geographical presence and a broad product range but faces several risks, including heavy debt. Even if the company has a lot of room to grow, an investor should always speak with a financial advisor before making any investment decisions.
S.NO.
Check Out These Interesting Posts You Might Enjoy!