Category: Case Study

  • TCS vs Wipro: Comparison Of Two IT Giants

    TCS vs Wipro: Comparison Of Two IT Giants

    The IT sector in India is a global powerhouse, driven by a competitive landscape of companies that are leaders in technology and innovation.

    In this blog, we will compare two of India’s largest IT companies, Tata Consultancy Services (TCS) and Wipro, and discuss key insights, their financial performance, etc.

    TCS Overview

    Tata Consultancy Services (TCS), established in 1968, is a global IT services, consulting, and business solutions provider headquartered in Mumbai, India. The company is a division of Tata Group which is the largest multinational group in India. As of March 2024, the company employs more than 6 lakh employees, and 35% of the workforce is women.

    The company offers a wide range of services, including software development, IT infrastructure services, cloud solutions, and enterprise applications. And it serves various industries, including banking, financial services, retail, telecommunications, healthcare, etc. Further, the company is known for its strong client relationships and robust service delivery models.

    As of August 2024, TCS is the largest IT services company in India by market capitalization and revenue. Further, it consistently ranked among the top IT service providers globally. The company’s focus on innovation, quality, and customer satisfaction has earned it a stellar reputation in the IT industry.

    Did You Know?

    In 2004, TCS listed at the National Stock Exchange (NSE) and Bombay Stock Exchange with the largest IPO by a private sector company, raising an impressive USD 1 billion.

    Wipro Overview

    Wipro Limited, founded in 1945, is another major player in the Indian IT industry, headquartered in Bangalore, Karnataka. The company was established as a vegetable oil manufacturer and has transformed itself into a global IT services and consulting company.

    It entered the IT sector in 1981 and has since diversified its offerings across various technology domains. It has a presence in over 66 countries and employs more than 2,50,000 people. Further, the company is known for its commitment to corporate social responsibility and ethical business practices.

    The company provides IT services, including software development, business process outsourcing (BPO), cloud computing, digital transformation and much more. The company provide services to multiple industries such as banking, healthcare, energy, consumer goods, etc. Wipro’s global delivery model and emphasis on sustainability and innovation have positioned it as a key competitor in the global IT market.

    Did You Know?

    In 2000, Wipro grew to a one billion dollar company and was listed on the New York Stock Exchange.

    Read Also: TCS Case Study: Business Model, Financial Statement, SWOT Analysis

    Comparative Study of TCS and Wipro

    ParticularsTCSWipro
    Current Price (CMP)INR 4,509INR 537
    Market Capitalization (in crores)INR 16,31,300INR 2,80,900
    52 Week High PriceINR 4,565INR 580
    52-Week Low PriceINR 3,311INR 375
    FIIs Holdings (March 24)12.70%6.96%
    DIIs Holdings (March 24)10.61%8.28%
    Book Value per ShareINR 250INR 143
    PE Ratio (x)34.325.1
    (Data as of 28 August 2024)

    Financial Statements Comparison

    Let’s have a look at the financials of both the companies.

    Income Statement (FY 2024)

    ParticularsTCS (INR crore)Wipro (INR crore)
    Total Sales2,40,89389,760
    Expenses1,76,59773,008
    Profit Before Tax (PBT)61,99714,721
    Net Profit46,09911,112
    TCS vs Wipro Income Statement

    Balance Sheet (FY 2024)

    ParticularsTCS (INR crore)Wipro (INR crore)
    Shareholders’ Fund90,48974,533
    Borrowings8,02116,465
    Other Liabilities46,96223,611
    Fixed Assets19,60443,628
    Investments31,76233,384
    Trade Receivables53,57711,548
    Cash & Cash Equivalents13,2869,695
    TCS vs Wipro Balance Sheet

    Cash Flow Statement (FY 2024)

    ParticularsTCS (INR crore)Wipro (INR crore)
    Cash Flow from Operating Activities44,38817,622
    Cash Flow from Investing Activities6,0911,144
    Cash Flow from Financing Activities(48,536)(18,257)

    Key Performance Indicators (FY 2024)

    ParticularsTCSWipro
    Operating Profit Margin27%19%
    ROE51.5%14.3%
    ROCE64.3%17%
    Earnings Per ShareINR 127INR 21.14

    Read Also: Wipro Case Study and Marketing Strategy

    Conclusion

    In summation, the comparison between TCS and Wipro highlights that both companies are giants in the IT services industry, however, TCS has a clear edge in terms of profitability because of larger market capitalization.

    However, Wipro is not lagging behind and remains a strong competitor with its global presence and focus on innovation. Investors can find value in both companies based on their preferences and risk tolerance. It’s advisable to consult with a financial advisor before making any investment decision.

    S.NO.Check Out These Interesting Posts You Might Enjoy!
    1NHPC vs NTPC
    2IndiGo vs SpiceJet
    3Infosys vs TCS
    4ITC vs HUL
    5XIRR Vs CAGR

    Frequently Asked Questions (FAQs)

    1. When was the TCS founded?

      Tata Consultancy Services (TCS) was founded in 1968.

    2. What is the full form of TCS?

      TCS stands for Tata Consultancy Services.

    3. Who is the current CEO of Wipro?

      Srini Pallia is the current CEO of Wipro. He joined the company in 1992 and previously held many leadership positions at the company, including President of Wipro’s Consumer Business Unit and Global head of Business Application Services.

    4. Which company is more profitable: TCS or Wipro?

      As of March 2024, TCS has a net profit of INR 46,099 crores compared to INR 11,112 crores of Wipro.

    5. Which company has a larger market capitalization: TCS or Wipro?

      As of August 2024, TCS has a market capitalization of around INR than 16.31 lakh crores and Wipro has a market capitalization of around INR 2.83 lakh crores.

  • SBI vs ICICI Bank: Which is Better?

    SBI vs ICICI Bank: Which is Better?

    You save a lot of money and put in a lot of work, but you need help determining where to keep it. It is only possible to retain some of your hard-earned savings at home; opening a bank account is your only option. You might be surprised to hear that banks where you have accounts allow you to invest in their business.

    This blog post will compare the State Bank of India (SBI) and ICICI Bank.

    SBI Overview

    State Bank of India is the largest public sector bank in India and is a titan in the Indian banking landscape with a 1/4th share in the market. SBI is headquartered in Mumbai and holds a rich heritage of over 200 years.

    The roots of SBI trace back to 1806 with the establishment of the Bank of Calcutta, the first joint stock bank in British India. Three separate presidency banks – Bank of Bengal, Bank of Bombay, and Bank of Madras emerged across British India. In the year 1921, the three presidential banks merged to form the Imperial Bank of India.

    In the year 1955, the government of India nationalized the Imperial Bank of India and renamed it as State Bank of India. SBI later acquired various state-associated banks and commercial banks.

    SBI has played an important role in bringing banking services to rural areas. Currently, SBI holds a strong distribution network of 22,405 branches and 65,627 ATMs.

    ICICI Bank Overview

    ICICI Bank is among the biggest banks in India’s private sector. The government of India established the Industrial Credit and Investment Corporation of India (ICICI) on 5 January 1955. As a division of ICICI Limited, ICICI Bank was founded in 1994. It made history by being the first Indian bank and firm to list on the New York Stock Exchange. ICICI and ICICI Bank combined to form a new financial organization to increase business efficiency. Following accusations against Chanda Kochhar, the managing director of ICICI Bank, in 2018 about inappropriate lending practices, Sandeep Bakhshi assumed the role of managing director. It was the first bank to provide contactless credit and debit cards. 

    Company’s Comparative Study

    ParticularSBIICICI Bank
    Current Share PriceINR 816INR 1,226
    Market Capitalization (Crores)7,27,8918,63,981
    52 Week High PriceINR 912INR 1,258
    52-Week Low PriceINR 543INR 899
    FIIs Holdings (%)11.1545.48
    DIIs Holdings (%)23.6444.97
    Book Value per ShareINR 465INR 365
    PE Ratio (x)9.9919.1
    (Data as of 27 August 2024)

    Read Also: Punjab National Bank vs State Bank of India

    Financial Statements Comparison

    Income Statement Comparison (FY 2024)

    ParticularSBIICICI Bank
    Interest Income4,39,1881,59,515
    Total Income5,94,5742,36,037
    Total Expenditure4,95,5431,71,890
    Net Profit68,22445,007
    (The figures mentioned above are in INR crores unless stated otherwise)
    Income Statement of SBI vs ICICI Bank

    Balance Sheet Comparison (FY 2024)

    ParticularSBIICICI Bank
    Deposits49,66,53714,43,580
    Total Capital & Liabilities67,33,77923,64,063
    Advances37,84,27312,60,776
    (The figures mentioned above are in INR crores unless stated otherwise)
    Balance Sheet of SBI vs ICICI Bank

    Cash Flow Statement Comparison (FY 2024)

    ParticularSBIICICI Bank
    Cash Flow from Operating Activities21,6321,57,284
    Cash Flow from Investing Activities-4,251-1,45,931
    Cash Flow from Financing Activities-9,89613,765
    (The figures mentioned above are in INR crores unless stated otherwise)
    Cash Flow Statement of SBI vs ICICI Bank

    Read Also: Blinkit vs Zepto: Which is Better?

    Key Performance Indicators

    ParticularSBIICICI Bank
    Net Interest Margin (%)2.663.61
    Net Profit Margin (%)15.5128.21
    ROE (%)17.3117.74
    Capital Adequacy Ratios (%)14.2816.33
    (all the above data is of the year ended March 2024)

    Read Also: HDFC vs SBI

    Conclusion

    The comparison of SBI and ICICI Bank presented above leads us to conclude that while SBI has more net profit, ICICI Bank has a higher net profit margin. Although every bank has something special to offer, we always advise speaking with an investment expert before making investment decisions.

    S.NO.Check Out These Interesting Posts You Might Enjoy!
    1HDFC Bank vs Axis Bank
    2PNB vs Bank of Baroda
    3Axis Bank vs ICICI Bank
    4Bank of Baroda vs SBI
    5Bank of Baroda vs Canara Bank

    Frequently Asked Questions (FAQs)

    1. Which bank has a larger market capitalization: SBI or ICICI Bank?

      ICICI Bank has a larger market capitalization than SBI as of 27 August 2024.

    2. Which bank is more profitable: SBI or ICICI Bank?

      SBI has a net profit of INR 68,244 crores compared to INR 45,007 crores for ICICI Bank for FY 2024.

    3. Who is the CEO of ICICI Bank?

      Sandeep Bakhshi is the MD and CEO of ICICI Bank.

    4. What is the full form of ICICI Bank?

      ICICI stands for Industrial Credit and Investment Corporation of India.

    5. How was the State Bank of India formed?

      State Bank of India was established in 1955 after the government of India nationalized the Imperial Bank of India and renamed it as State Bank of India.

  • IndiGo vs SpiceJet: Which is Better?

    IndiGo vs SpiceJet: Which is Better?

    IndiGo and SpiceJet have been important in shaping India’s aviation industry with their unique business models and operational strategies. 

    In today’s blog, we will take a closer look at their development and growth to gain valuable insights into the financial health of these two aviation giants.

    IndiGo – An Overview

    The largest and most popular passenger airline in India is InterGlobe Aviation Ltd., better known as IndiGo. Rakesh Gangwal, an Indian entrepreneur living in the US, and Rahul Bhatia of InterGlobe Enterprises established the business as a private company in 2006. The company was originally incorporated in Lucknow in 2004, and in 2006, it was converted into a public limited company, and the name was changed to InterGlobe Aviation Limited. It commenced operations in August 2006 with a fleet of 100 Airbus A320-200 aircraft. IndiGo has a strong record for punctuality, ensuring reliable travel experiences. 

    It operates over 2000 daily flights to 122 destinations, including 88 domestic and 34 international locations. With a fleet of over 370 aircraft, IndiGo ensures excellent connectivity and convenience for its passengers. The primary source of income for IndiGo is passenger fares. 

    The airline has the capability to attract a decent number of passengers through its competitive pricing and extensive network and maximizes its revenue by offering ancillary services such as baggage fees, seat selection, in-flight meals, and priority boarding. It also transports cargo, which contributes to its overall revenue.

    SpiceJet – An Overview

    SpiceJet is a prominent low-cost airline in India that is well-known for its affordable fares and extensive network. The airline was established in 2005 and has grown rapidly, becoming a major force in the Indian aviation sector. Originally founded as an air taxi provider in 1994, the company was known as ModiLuft. The business was bought and rebranded as SpiceJet by Indian businessman Ajay Singh in 2004. 

    The airline formally began operations with two Boeing 737-800 aircraft in May 2005. In terms of market share, it was ranked third among low-cost carriers in India by 2008, behind IndiGo and Air Deccan. SpiceJet provides various services, including discount coupons, travel insurance, tour packages, and flight reservations.

    Read Also: Swiggy Vs Zomato

    Comparative Analysis

    ParticularIndiGoSpiceJet
    Current Share Price INR 4,830INR 62.6
    Market Capitalisation (in INR crore)1,86,5514,964
    52-Week HighINR 4,945 INR 77.5 
    52-Week LowINR 2,333INR 31
    FII Holdings (%)24.431.81
    DIIs Holdings (%)15.435.16
    Book Value per ShareINR 50INR -33
    PE Ratio (x)23.9-9.25
    (Data as of 31 August 2024)

    Financial Statements Analysis

    Income Statement

    ParticularsIndiGoSpiceJet
    Total Income71,2318,524
    Total Expenditure59,0128,482
    Net Profit8,172-423
    (The figures mentioned are in INR crores unless stated otherwise)
    Indigo vs SpiceJet Income Statement

    Balance Sheet

    ParticularsIndiGoSpiceJet
    Non-current Liabilities49,4292,591
    Current Liabilities30,7989,099
    Non-current Assets46,3713,962
    Current Assets35,8532,510
    Total Shareholders’ Funds1,996-5,217
    (The figures mentioned are in INR crores unless stated otherwise)
    Indigo vs SpiceJet Balance Sheet

    Cash Flow Statement

    ParticularsIndiGoSpiceJet
    Cash Flow from Operating Activity21,217-595
    Cash Flow from Investing Activity-11,80835
    Cash Flow from Financing Activity -9,978730
    (The figures mentioned are in INR crores unless stated otherwise)
    Indigo vs SpiceJet Cash Flow Statement

    *(All Figures in INR crore unless stated otherwise).

    Read Also: Flair Vs DOMS

    Key Performance Indicators

    ParticularsIndiGoSpiceJet
    Net Profit Margin (%)11.86-5.98
    ROE409.350
    ROCE23.75-1.58
    Current Ratio1.160.28
    Debt-to-Equity0.95-0.22
    (All the above data is of the year ended March 2024)

    Conclusion

    IndiGo and SpiceJet are both major players in India’s aviation industry. However, there are differences in their strategies and operations. IndiGo is recognized as the dominant airline, with a strong focus on punctuality, customer service, and an extensive network. Standardizing its fleet to increase operational efficiency has been a key factor in its success. On the other hand, SpiceJet has followed a highly aggressive expansion strategy, capitalizing on its extensive network and competitive pricing to attract a significant customer base. While both airlines share a common goal of providing affordable air travel, their distinct approaches have led to different market positions. It is advised to consult a financial advisor before investing.

    S.NO.Check Out These Interesting Posts You Might Enjoy!
    1Bharat Petroleum vs Hindustan Petroleum
    2Apollo Hospitals vs Fortis Healthcare:
    3MRF vs Apollo Tyres
    4IndiGo vs SpiceJet
    5NHPC vs NTPC

    Frequently Asked Questions (FAQs)

    1. Which airline is larger: IndiGo or SpiceJet?

      IndiGo is considered the larger airline, with a broader customer base and a larger fleet.

    2. Which airline, IndiGo and SpiceJet, covers more international destinations?

      Both airlines have expanded their international operations, but IndiGo generally covers a wider range of international destinations.

    3. How do IndiGo and SpiceJet maintain low fares?

      They achieve low fares through efficient operations, fleet standardization, and cost-cutting measures.

    4. How have IndiGo and SpiceJet affected India’s aviation industry?

      They have made air travel more accessible and affordable for millions of people.

    5. What can we expect from IndiGo and SpiceJet in the future?

      Both airlines are likely to continue expanding their operations and improving their services to remain competitive in the Indian aviation sector.

  • NHPC vs NTPC: Which is Better?

    NHPC vs NTPC: Which is Better?

    India is one of the world’s fastest-growing economies and is facing substantial challenges in managing its energy requirements. With a population of over 140 crore, the Government of India is making all the necessary efforts to meet the country’s rising energy needs. Two government-owned businesses, NHPC and NTPC, are responsible for energy production in India.

    In today’s blog post, we’ll compare NTPC and NHPC.

    NHPC Overview

    The NHPC was established in 1975 by the Government of India as a division of the Ministry of Power. The company’s primary goal is to increase the nation’s hydropower output. The company has operations in Jammu & Kashmir, Uttarakhand, Arunachal Pradesh, Sikkim, etc. The corporation uses wind energy and solar energy, among other sources, to generate electricity. 

    In 2008, the company went public on the Indian Stock Exchange. With a hydro share of 6971.20 MW as of March 2024, the corporation has a total capacity of 7144.20 MW or 14.85% of the nation’s hydro capacity. The organization is always concentrating on using renewable energy sources to generate electricity. It also develops several infrastructure types, including tunnels, dams, and powerhouses. The company’s main office is located in Faridabad. 

    NTPC Overview

    In response to the country’s growing need for power, the Indian government established the firm in 1975 as a public-sector corporation. The company used coal to produce electricity and is now focusing on utilizing renewable energy sources. Due to its substantial contribution to the nation’s electricity consumption, the business became India’s largest power utility in 1990. The company launched an initial public offering (IPO) in 2004 and became listed on the Indian Stock Exchange. 

    The corporation is diversifying its sources of electricity generation, including nuclear, solar, wind, and hydroelectric power. The firm has 94 facilities with a combined capacity of 76,134 MW, of which 52 are owned and run by NTPC, and 43 are in joint ventures or subsidiaries. The company plans to achieve a 130 GW capacity by 2032. The business produced 400 billion units of power in 2023–2024. The organization’s headquarters is in New Delhi. 

    Comparative Company Study

    ParticularNHPCNTPC
    Current Share PriceINR 95INR 413
    Market Capitalization (In INR Crores)95,3784,00,084
    52-Week High PriceINR 118INR 426
    52-Week Low PriceINR 48.4INR 216
    FIIs Holdings (%)8.9617.68
    DIIs Holdings (%)11.5527.66
    Book Value Per ShareINR 38.5INR 166
    PE Ratio (x)26.418.7
    (Data as of 30 August 2024) 

    Read Also: ITC vs HUL

    Financial Statements Comparison

    Income Statement Comparison (FY 2024)

    ParticularNHPCNTPC
    Sales9,6321,78,500
    Total Income10,9931,81,165
    Total Expenditure5,5521,43,661
    Net Profit4,02319,696
    (The figures mentioned are in INR crores unless stated otherwise)
    NHPC vs NTPC Income Statement

    Balance Sheet Comparison (FY 2024)

    ParticularNHPCNTPC
    Non-Current Liabilities38,6192,12,719
    Current Liabilities14,2261,02,355
    Non-Current Assets80,1083,82,187
    Current Assets14,16898,009
    Shareholder Funds38,7021,60,709
    (The figures mentioned are in INR crores unless stated otherwise)
    NHPC vs NTPC Balance Sheet

    Cash Flow Statement Comparison (FY 2024)

    ParticularNHPCNTPC
    Cash Flow From Operating Activities6,93740,784
    Cash Flow From Investing Activities-5,968-32,141
    Cash Flow From Financing Activities-581-8,245
    (The figures mentioned are in INR crores unless stated otherwise)
    NHPC vs NTPC Cash Flow Statement

    Key Performance Indicators

    ParticularNHPCNTPC
    Net Profit Margin (%)41.7712.64
    ROE (%)9.3612.95
    ROCE (%)6.129.93
    Current Ratio1.640.96
    Debt to Equity Ratio0.841.46
    (All the above data is of the year ended March 2024)

    Read Also: TCS vs Wipro

    Conclusion

    In conclusion, both businesses produce power, but their methods vary: NHPC primarily draws its energy from hydroelectric sources, while NTPC draws its energy from more traditional sources like coal, gas, etc. In the fiscal year ending in 2024, both businesses reported profits and are expanding their operations in the renewable energy market. Given their bright futures, an investor should take into account the risk profile of these companies or consult a financial advisor before making any investment decisions. 

    S.NO.Check Out These Interesting Posts You Might Enjoy!
    1IndiGo vs SpiceJet
    2Bharat Petroleum vs Hindustan Petroleum
    3MRF vs Apollo Tyres
    4Tata Steel vs. JSW Steel
    5Mahindra & Mahindra vs Tata Motors

    Frequently Asked Questions (FAQs)

    1. Which firm, NHPC or NTPC, has a higher market capitalization?

      The market capitalization of NTPC is more than that of NHPC. 

    2. What is the full form of NTPC and NHPC?

      National Hydroelectric Power Corporation is abbreviated as NHPC, and the full name of  NTPC is National Thermal Power Corporation Limited. 

    3. Which company is more profitable: NTPC or NHPC?

      For FY 2024, NTPC generated a net profit of 19,696 crores, while NHPC reported a net profit of 4,023 crores, demonstrating that NTPC is more profitable. 

    4. What are NTPC and NHPC’s primary business activities?

      While NTPC is a well-known player in the thermal power (oil, gas, and coal) generation industry, NHPC is primarily focused on hydroelectric power generation and is regarded as a major player in this area.

    5. Which company has a more diversified business model among NTPC and NHPC?

      Compared to NHPC, which mostly concentrates on hydroelectric power, NTPC has a more diverse business strategy because it generates power from various sources, including coal, gas, hydroelectric, solar, wind, etc.

  • Different Types of Companies in India

    Different Types of Companies in India

    The Indian economy is driven by many companies contributing to its growth and development. These companies vary in size, ownership, control, and access to capital, reflecting the country’s diverse corporate landscape. However, companies must be categorized to promote effective corporate governance.

    In this blog, we will discuss the types of companies based on size, number of members, control, liability, and access to capital.

    What is a Company?

    A company is a legal entity formed by a group of individuals to engage in and operate a business or enterprise. It is a separate legal entity from its owners, meaning it can own assets, incur liabilities, enter into contracts, sue, and be sued. It has perpetual succession, a common seal, and is subject to statutory compliance. The purpose of the companies is generally to generate profit for their owners, although some, like Section 8 Companies, may be formed for charitable or social purposes. 

    What is a Company

    List of Different Types of Companies in India

    CategoryTypeDefinition/Act
    Categorization Based on SizeMicro EnterpriseMSMED Act, 2006
    Small EnterpriseMSMED Act, 2006
    Medium EnterpriseMSMED Act, 2006
    Categorization Based on Number of MembersOne Person Company (OPC)Section 2(62) of Companies Act, 2013
    Private Limited CompanySection 2(68) of Companies Act, 2013
    Public Limited CompanySection 2(71) of Companies Act, 2013
    Categorization Based on ControlSole ProprietorshipRecognized under Income Tax Act
    Private Limited CompanyCompanies Act, 2013
    Public Limited CompanyCompanies Act, 2013
    Government-Owned Company (PSU)Section 2(45) of Companies Act, 2013
    Categorization Based on LiabilitySole ProprietorshipNot defined under Companies Act
    Partnership FirmIndian Partnership Act, 1932
    Limited Liability Partnership (LLP)LLP Act, 2008
    Private Limited CompanyCompanies Act, 2013
    Public Limited CompanyCompanies Act, 2013
    Categorization Based on Access to CapitalSole ProprietorshipNot defined under Companies Act
    Partnership FirmIndian Partnership Act, 1932
    Private Limited CompanyCompanies Act, 2013
    Public Limited CompanyCompanies Act, 2013
    Section 8 CompanySection 8 of Companies Act, 2013

    Here’s a detailed categorization of Indian companies based on size, number of members, control, liability, and access to capital,  as per the Companies Act, 2013:

    The MSME Act classifies companies based on their size to give benefits the government provides for MSMEs. 

    1. Categorization Based on Size

    Based on the size, companies can be categorized as:

    Micro, Small, and Medium Enterprises (MSMEs):

    Companies are categorized based on size under the Micro, Small, and Medium Enterprises Development (MSMED) Act, 2006, but often referenced in the context of companies under the Companies Act.

    Micro Enterprises:

    • Investment: Up to ₹1 crore.
    • Annual Turnover: Up to ₹5 crore.

    Small Enterprises:

    • Investment: Between ₹1 crore and ₹10 crore.
    • Annual Turnover: Between ₹5 crore and ₹50 crore.

    Medium Enterprises:

    • Investment: Between ₹10 crore and ₹50 crore.
    • Annual Turnover: Between ₹50 crore and ₹250 crore.

    2. Categorization Based on Number of Members

    Based on the number of members, companies can be categorized as:

    One Person Company (OPC):

    • Definition: Under Section 2(62) of the Companies Act, 2013.
    • Members: One individual is the sole member.
    • Characteristics: The OPC allows a single entrepreneur to start and manage a company with limited liability, with provisions for a nominee in case of the sole member’s death or incapacity.

    Private Limited Company:

    • Definition: Under Section 2(68) of the Companies Act, 2013.
    • Members: Minimum of 2 members, maximum of 200.
    • Characteristics: Shares are not freely transferable, and the company cannot invite the public to subscribe to its shares.

    Public Limited Company:

    • Definition: Under Section 2(71) of the Companies Act, 2013.
    • Members: Minimum of 7 members, no maximum limit.
    • Characteristics: Can issue shares to the public, and shares are freely transferable. These companies are usually listed on stock exchanges.

    3. Categorization Based on Control

    Based on control, companies can be categorized as:

    Sole Proprietorship:

    • Definition: It is not defined under the Companies Act but is recognized under various laws, such as the Income Tax Act.
    • Control: Controlled by a single individual.
    • Characteristics: The owner has full control over business operations, and there is no distinction between personal and business assets.

    Private Limited Company:

    • Control: Controlled by directors, often with significant influence from shareholders.
    • Characteristics: Decisions are made by the board of directors, with major shareholders often having significant influence.

    Public Limited Company:

    • Control: Controlled by a board of directors elected by the shareholders.
    • Characteristics: Ownership and management are separate, with control exercised by the elected board.

    Government-Owned Companies (PSUs):

    • Definition: Under Section 2(45) of the Companies Act, 2013.
    • Control: Controlled by the government, which holds a majority stake.
    • Characteristics: Operates in sectors deemed crucial by the government, such as defense, energy, and infrastructure.

    4. Categorization Based on Liability

    Based on liability, companies can be categorized as:

    Sole Proprietorship:

    • Liability: Unlimited liability.
    • Characteristics: The owner is personally responsible for all debts, and there is no legal distinction between personal and business assets.

    Partnership Firm:

    • Liability: Unlimited liability for all partners.
    • Characteristics: Every partner is liable, jointly with all the other partners, for all acts of the firm.

    Limited Liability Partnership (LLP):

    • Definition: Under the Limited Liability Partnership Act, 2008.
    • Liability: Limited liability for partners.
    • Characteristics: Partners’ liability is limited to their contribution, and the LLP has a separate legal existence. No partner is liable on account of the independent or unauthorized acts of other partners.

    Private Limited Company:

    • Liability: Limited liability.
    • Characteristics: Shareholders are liable only up to the value of their shares, which means shareholders are not liable to sell their personal assets in case of a loss.

    Public Limited Company:

    • Liability: Limited liability.
    • Characteristics: Shareholders are not personally liable for the company’s debts beyond the amounts of their investments.

    5. Categorization Based on Access to Capital

    Based on access to capital, companies can be categorized as:

    Sole Proprietorship:

    • Access to Capital: Limited.
    • Characteristics: Funding is typically from personal savings, small loans, or family resources.

    Partnership Firm:

    • Access to Capital: Moderate.
    • Characteristics: Partners pool their resources with additional funding from loans based on the firm’s credit.

    Private Limited Company:

    • Access to Capital: Moderate to high.
    • Characteristics: Can raise capital through private placements, venture capital, or loans but cannot raise capital from the public.

    Public Limited Company:

    • Access to Capital: High.
    • Characteristics: Can raise capital by issuing shares and debentures to the public, listing on stock exchanges, and other financial instruments.

    Section 8 Company:

    • Definition: Under Section 8 of the Companies Act, 2013.
    • Access to Capital: Limited to donations, grants, and philanthropic funding.
    • Characteristics: Cannot distribute profits to members; profits are reinvested in the company’s objectives.

    Each of these categories presents a different aspect of how companies in India are structured and operate, from the scale of their operations to their financial and legal framework.

    Read Also: Top Power Companies in India

    Conclusion

    There are different types of companies in India, so different stakeholders, like entrepreneurs, investors, and businesses, can operate efficiently within a legal framework. Every company serves a different purpose, from small startups to large multinational corporations, providing flexibility in terms of ownership, control, liability, and access to capital, as there are different regulations for different types of companies. Understanding these different types of companies is important for anyone looking to start, manage, or invest in a business in India.

    S.NO.Check Out These Interesting Posts You Might Enjoy!
    1Impact of Interest Rate Change on Financial Markets
    2Jio Financial Services: Business Model And SWOT Analysis
    3Anti-Takeover Mechanisms: Defenses Against Hostile Takeovers
    4What is Pledging of Shares?
    5What is AI Washing? Definition, Tips, Evolutions & Impact

    Frequently Asked Questions (FAQs)

    1. What is OPC?

      An OPC, or a One Person Company, is a type of company in India where a single individual can own and manage the business with limited liability protection. It is ideal for entrepreneurs who want to maintain full control while enjoying the benefits of a corporate structure.

    2. What is the difference between a Partnership Firm and a Limited Liability Partnership?

      A Partnership Firm is a business owned by two or more individuals with unlimited liability, where partners are personally liable for the business’s debts and liabilities. On the other hand, an LLP provides limited liability protection to its partners, meaning they are only liable to the extent of their investment. 

    3. What is a Section 8 Company?

      It is a non-profit organization in India that promotes social welfare activities such as education, arts, environment preservation, sports, charity, etc. These companies reinvest their profits and enjoy tax benefits and other exemptions.

    4. Can a foreign company establish a business in India?

      A foreign company can establish a business in India through various routes, including a joint venture with an Indian partner or establishing a branch office, liaison office, or project office. India’s Foreign Direct Investment (FDI) policy controls these processes.

    5. What are the criteria for qualifying as a Micro Enterprise?

      Investment in the plant and machinery can’t exceed INR 1 crore, and annual turnover must not exceed INR 5 crore for a company to qualify as a Micro Enterprise.

  • HDFC Bank vs Axis Bank: Which is Better?

    HDFC Bank vs Axis Bank: Which is Better?

    You save a lot of money and put in a lot of work, but you need help determining where to keep it. It is only possible to retain some of your hard-earned savings at home; opening a bank account is your only option. You might be surprised to hear that banks where you have accounts allow you to invest in their business.

    This blog post will compare HDFC Bank and Axis Bank. 

    HDFC Bank Overview

    HDFC Bank was established in 1994 as a subsidiary of HDFC Ltd. The Reserve Bank of India granted it a banking license in January 1995. In November 1995, the bank launched its Initial Public Offering (IPO) and became a listed company on the Bombay Stock Exchange and the National Stock Exchange. In 2000, the Times Bank merged with HDFC Bank. HDFC Bank acquired Centurion Bank of Punjab to increase its branch network and clientele. The bank’s business philosophy is based on five core values: Operational Excellence, Customer Focus, Product Leadership, People, and Sustainability.

    HDFC Ltd. or Housing Development Finance Corporation Ltd. was merged with HDFC Bank in 2023, The merger officially came into effect on July 1,2023 it’s India’s largest-ever M&A deal. The bank provides a wide range of financial products and services, such as retail banking, wholesale banking, loans, credit cards, savings accounts, current accounts, investment products, etc. The company’s headquarters is in Mumbai.

    Read Also: HDFC Bank Case Study

    Axis Bank Overview

    Axis Bank was initially established as UTI Bank by a joint venture between the Life Insurance Corporation of India, Unit Trust of India (UTI), and other business houses. UTI Bank’s operations started in 1994 when the first branch in Ahmedabad was opened. In 2007, UTI Bank was renamed “Axis Bank”. It soon became a well-established and recognized bank in the Indian Banking sector. This was a turning point in the history of Axis Bank because it became an aggressive player with a focus on branch expansion and innovation. Additionally, Axis Bank consistently made an effort to diversify its product portfolio. The bank now offers a variety of financial products, including credit cards, savings accounts, current accounts, brokerage facilities, and retail banking..

    Read Also: Axis Bank Case Study

    Company’s Comparative Study

    ParticularHDFC BankAxis Bank
    Current Share PriceINR 983INR 1,186
    Market Capitalization (in INR Crores)15,10,6353,68,133
    52 Week High Price INR 1,018INR 1,247
    52-Week Low PriceINR 812INR 933
    FIIs Holdings (%)41.9142.36
    DIIs Holdings (%)31.4139.85
    Book Value per ShareINR 337INR 604
    PE Ratio (x)9.8512.15
    (Data as of 10 October 2025)

    Financial Statements Comparison

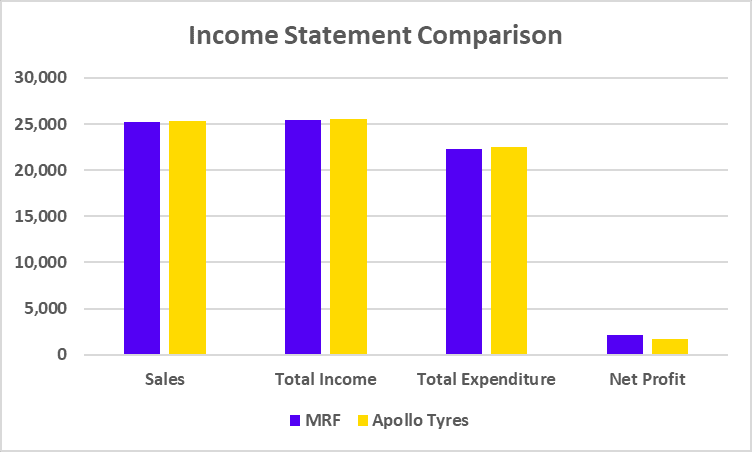
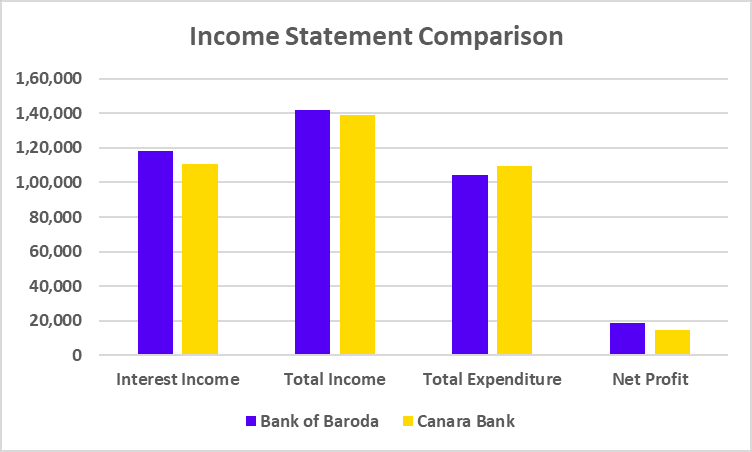
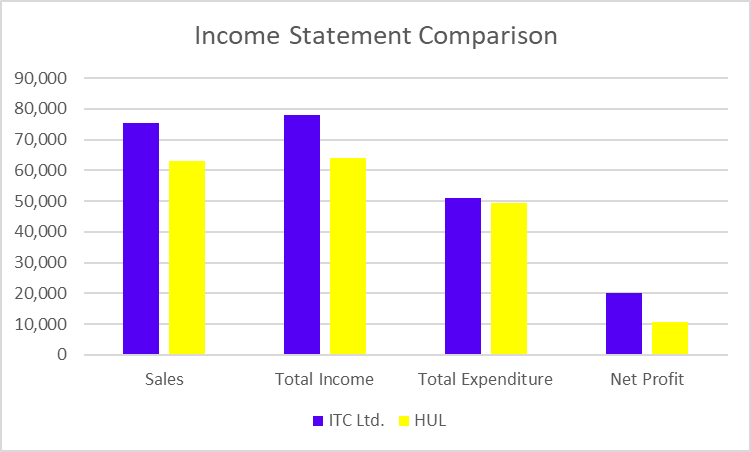
    Income Statement Comparison (FY 2025)

    ParticularHDFC BankAxis Bank
    Interest Income3,36,3671,27,374
    Total Income4,70,9151,55,916
    Total Expenditure3,60,4991,11,024
    Net Profit73,44028,115
    (The figures mentioned above are in INR crores unless stated otherwise)
    Financial Statements Comparison
    Financial Statements Comparison

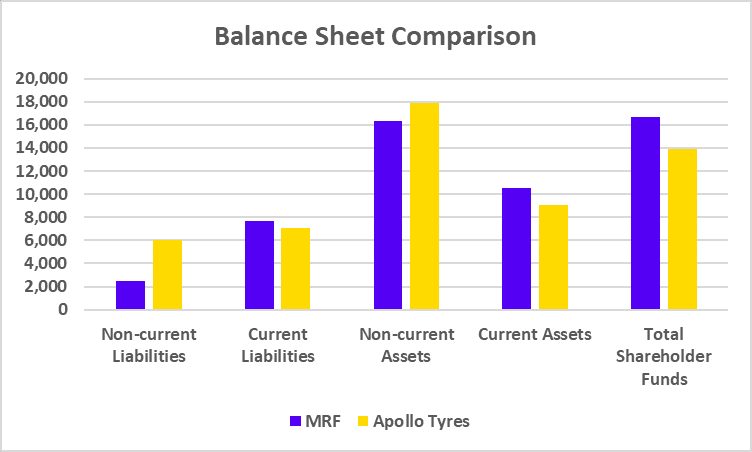
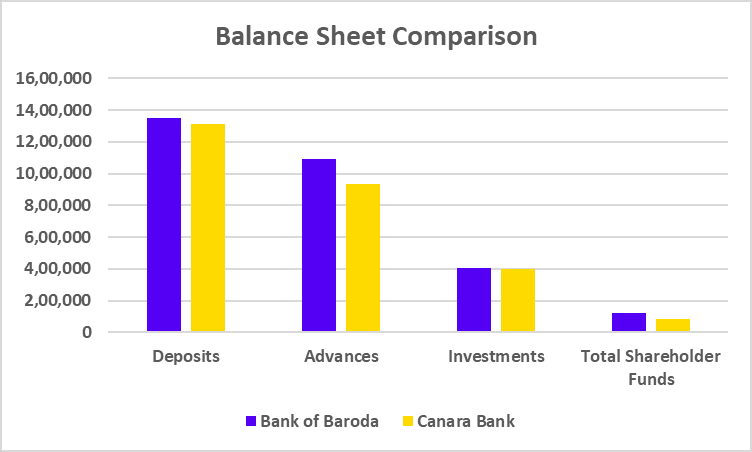
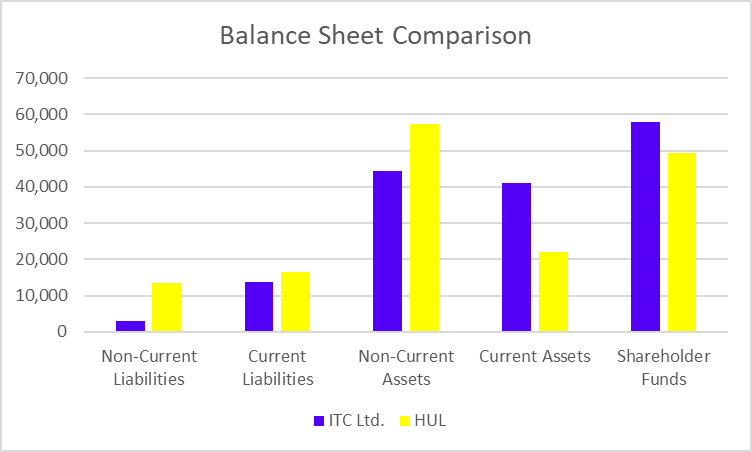
    Balance Sheet Comparison (FY 2025)

    ParticularHDFC BankAxis Bank
    Deposits27,10,89811,70,920
    Total Capital & Liabilities43,92,41716,56,962
    Advances27,24,93810,81,229
    (The figures mentioned above are in INR crores unless stated otherwise)
    Balance Sheet Comparison

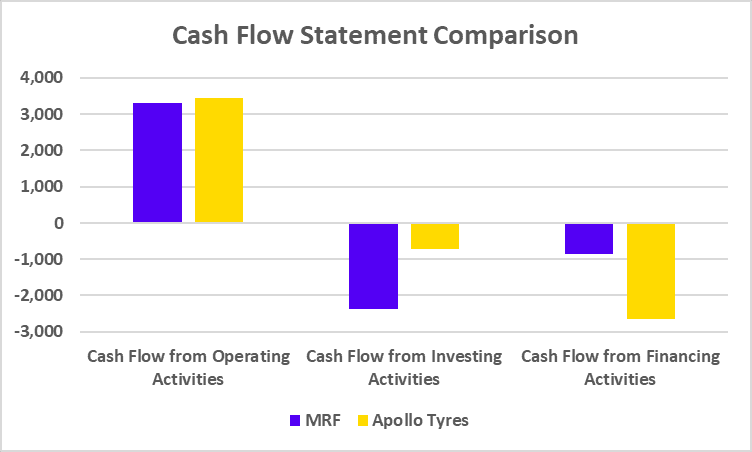
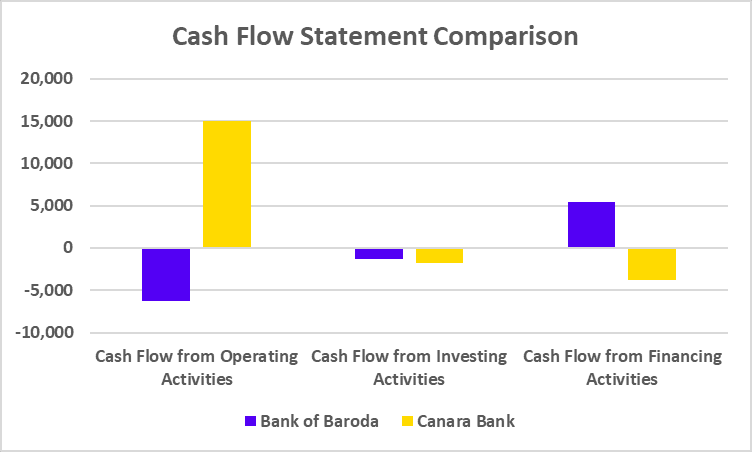
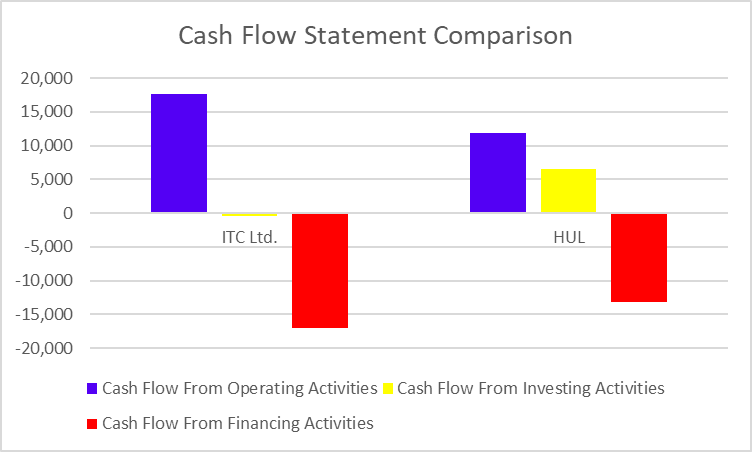
    Cash Flow Statement Comparison (FY 2025)

    ParticularHDFC BankAxis Bank
    Cash Flow from Operating Activities127,24144,383
    Cash Flow from Investing Activities-3,850-51,215
    Cash Flow from Financing Activities-102,477-7,000
    (The figures mentioned above are in INR crores unless stated otherwise)
    Cash Flow Statement Comparison
    Cash Flow Statement Comparison

    Read Also: Best Trading Apps in India

    Key Performance Indicators

    ParticularHDFC BankAxis Bank
    Net Interest Margin (%)3.473.40
    Net Profit Margin (%)21.8322.07
    ROCE (%)2.622.84
    Capital Adequacy Ratios (%)19.5517.07
    (all the above data is of the year ended March 2025)

    Read Also: ICICI Vs HDFC Bank

    Conclusion

    The comparison of India’s biggest private sector banks presented above leads us to conclude that while HDFC Bank has more revenue and profits overall, Axis Bank posts higher net profit margins even with less revenue. Although every bank has something special to offer, we always advise speaking with an investment expert before making investment decisions.

    S.NO.Check Out These Interesting Posts You Might Enjoy!
    1PNB vs SBI
    2Axis Bank vs ICICI Bank
    3PNB vs Bank of Baroda
    4SBI vs ICICI Bank
    5Bank of Baroda vs SBI
    6Blinkit vs Zepto: Which is Better?
    7UltraTech Vs Ambuja: Which is Better?
    8HCL Vs Infosys: Which is Better?
    9SIP vs Lump Sum: Which is Better?
    10SAIL Vs Tata Steel: Which is Better?
    11Differences Between MTF and Loan Against Shares
    12Scalping vs Swing Trading
    13Value Investing Vs Intraday Trading
    14Active or Passive Mutual Funds
    15Difference Between Large Cap, Mid Cap, And Small Cap Funds?

    Frequently Asked Questions (FAQs)

    1. Which person oversees HDFC Bank as managing director?

      The managing director of HDFC Bank at the moment is Mr Sashidhar Jagdishan. 

    2. In India, which private bank has the largest market capitalization? 

      HDFC Bank has the largest market capitalization of all the private banks in India. 

    3. Which bank has a larger market capitalization: Axis Bank or HDFC Bank? 

      Compared to Axis Bank, HDFC Bank has a larger market capitalization.

    4. Which bank is more profitable: HDFC Bank or Axis Bank? 

      Axis Bank has a slightly higher net profit margin of 22% compared to 21% for HDFC Bank.

    5. Who is the CEO of Axis Bank?

      Amitabh Chaudhry is the CEO of Axis Bank.

  • Impact of Interest Rate Change on Financial Markets

    Impact of Interest Rate Change on Financial Markets

    A small change in the interest rate can have a significant impact on stock markets, debt markets, etc. Let’s dive deeper to understand the connection between interest rate changes and their impact on the economy and on different asset classes.

    In this blog, we will discuss the impact of recent interest rate changes introduced in Japan on financial markets. 

    Interest Rate Changes and Its Impact

    Interest Rate Changes and Its Impact

    Interest rate changes have a significant impact on the economy, stock market, currency market, and even debt markets. Here’s a breakdown of its impact on each of these areas :

    Impact on the Economy

    Interest rate changes impact the economy in the following ways:

    • Consumer Saving: Higher interest rates make borrowing more expensive; hence, reducing consumer spending or saving becomes more attractive, as an increase in interest rates will increase the returns on savings accounts. Lower interest rates will have the opposite impact. 
    • Business Investment: Interest rate changes affect not only consumer spending but also business investments. Higher rates will increase the cost of borrowing, which reduces expansion activities and investments in new projects. On the other hand, a rate decrease will be positive for businesses as lower rates reduce the cost of capital, encouraging them to invest and expand.
    • Inflation: Central banks increase interest rates to curb inflation while decreasing interest rates have the opposite effect. 
    • Economic Growth: Interest rate increases can slow down economic growth, as higher borrowing costs will lead to reduced consumption and investment. In contrast, interest rate decreases are generally positive and boost economic growth by encouraging spending and investment.

    Impact on the Currency Market

    Interest rate changes impact the currency market in the following ways:

    • Currency appreciation or depreciation:  Higher interest rates attract foreign investors, as returns will be higher. This will increase the demand for the currency, which in turn will lead to its appreciation. The currency depreciates if the interest rate is reduced.
    • Capital Flows: Foreign capital through the FDI route will increase as investors seek higher returns, and the opposite will be true for interest rate decreases. 

    Impact on the Stock Market

    Interest rate changes impact the stock market in the following ways:

    • Valuation of Stocks: Higher interest rates can reduce the present value of future earnings of the companies, leading to lower stock prices. This is especially true for growth stocks, where expected future earnings make up a larger portion of their valuation. The opposite is true for interest rate decreases.
    • Corporate Profits: An interest rate increase will increase the borrowing costs or cost of capital for the companies, which can reduce profitability and lead to lower stock prices. 
    • Sectoral Impact: An interest rate increase will impact certain sectors, such as utilities, automobiles, real estate, etc., which rely heavily on debt financing. These sectors may suffer, while financial institutions (like banks) may benefit from higher loan margins.

    Impact on Debt Market

    Interest rate changes significantly impact debt markets, influencing everything from bond prices to yields and overall market dynamics. Here’s how interest rates affect debt markets:

    • Bond Prices and Yields: They have an inverse relationship, as when interest rates rise,  bonds with lower interest rates become less attractive, causing their prices to fall. New bonds are issued at higher rates, making older bonds less valuable. The opposite is true when interest rates fall; existing bonds with higher interest rates become more attractive, causing their prices to rise as they offer better returns than newly issued bonds.
    • Borrowing Costs:  When interest rates rise, new debt issuance by corporations or governments will become more expensive as they must offer higher yields to attract investors.
    • Credit Risk and Default Risk:  Higher rates can widen credit spreads, and investors demand a higher premium to compensate for the increased risk of default in a higher interest rate environment. If the interest rate decreases, credit spreads may narrow.

    Carry Trade: An Explanation

    Carry trade is a strategy in which an investor borrows money in a low-interest-rate currency and invests in an asset denominated in a currency with a higher interest rate. The investor first borrows funds in a currency with a lower interest rate and invests the borrowed funds in an asset denominated in a currency with a higher interest rate to earn the interest rate differential, which is the difference between two interest rates minus any transaction cost. The goal of the carry trade is to capture the difference or spread.

    Role of JPY in Carry Trade

    Historically, Japan has had one of the lowest interest rates across the globe, which has made the Japanese Yen (JPY) a popular funding currency for traditional carry trades. However, recent changes in Japan’s monetary policy have affected the global carry trade dynamics.

    A recent interest rate hike in Japan by the Bank of Japan (BoJ) had a huge impact on the Japanese markets, leading to significant volatility. Their central bank hiked the interest rates from 0% to 0.25%, which was unexpected. The policy change was required to stabilize the Yen in a high inflationary environment for currency stability and economic growth.

    The Japanese currency will continue to strengthen if the BoJ (Bank of Japan) continues to tighten the monetary policy. Higher interest rates or the expectation of higher rates can attract foreign investment into Yen-denominated assets, increasing demand for the Yen. As the Yen appreciates, investors who previously engaged in traditional carry trades (borrowing in Yen to invest in higher-yielding currencies) might start unwinding these trades, reversing their positions by selling high-yielding currencies and buying back Yen.

    Read Also: How Interest Rates Impact Mutual Funds in India

    Recent Development in Japan

    The recent interest rate hike and weakening US economic outlook led to a sharp decline in Japanese equities and US equity markets. The Nikkei 225 experienced a big drop and plunged more than 20% between August 1st and August 5th, 2024. The decline was particularly evident in the technology and semiconductor sectors due to concerns over US restrictions on chip exports to China and broader market trends​ because of the reversal of carry trade, which is funded through Japanese Yen and invested in US technology stocks.

    Despite this turmoil, domestic factors, such as rising wages and strong consumption, resulted in a subsequent recovery of Japanese equities. These are short-term fluctuations, and as per the broader outlook, the market will absorb the impact of the rate hike slowly. There will be a potential recovery driven by continued wage growth and strong domestic demand​.

    Impact on the Indian Economy 

    The reverse carry trade or the unwinding of traditional carry trades can increase volatility in currency markets worldwide. The flow of capital back into Yen as they have increased the interest rate could also pressure other currencies to weaken, particularly those that were previously beneficiaries of carry trade strategies. The Indian currency was not directly involved in carry trades, so the direct risk is minimal for Indian markets. However, this shift can have broader implications for global financial markets, as changes in exchange rates and interest rate expectations influence everything from equity markets to bond yields.

    Read Also: Impact of Interest Rate Change on Financial Markets

    Conclusion

    To conclude, the interest rate is a mechanism through which central banks manage inflation, promote economic growth, and facilitate financial stability. They also have other tools, but the interest rate mechanism holds a special role. Some negative impacts can be seen in the short term, but in the long run, it promotes growth and enhances stability. The interest rate hike was aimed to slow down the economy and curb inflation. It also strengthens the currency but can negatively affect stock markets, especially debt-reliant sectors. Interest rates are decreased to stimulate the economy and boost stock market returns, particularly in growth-oriented and rate-sensitive sectors, but it weakens the currency.

    S.NO.Check Out These Interesting Posts You Might Enjoy!
    1Bharat Petroleum vs Hindustan Petroleum: A Comparative Analysis of Oil Stocks
    2A Comparative Study on Top 5 Solar Stocks in India
    3Electoral Bonds Explained: What Are They and Why Did Supreme Court Ban It?
    4Scope of AI in Investing: Usage, Benefits, and Challenges
    5Swiggy Vs Zomato: Business Model, Marketing Strategies, Strengths, and Financials Compared

    Frequently Asked Questions (FAQs)

    1. What risks are involved in a carry trade?

      The main risks include interest rate risk (change in interest rates) and exchange rate risk (exchange rate moves unfavorably).

    2. How does a reverse carry trade differ from a traditional carry trade?

      A reverse carry trade involves borrowing in a high-interest-rate currency and investing in a low-interest-rate currency. This strategy is used when an investor expects the low-interest rate currency to appreciate against the high-interest rate currency.

    3. Why is the Japanese Yen often used in carry trades?

      The Japanese Yen has historically had very low interest rates because of their loose monetary policy, making it a popular currency to borrow for carry trades. 

    4. Do global events affect carry trades?

      Carry trades are sensitive to global events, such as monetary policy changes, political instability, geopolitical tensions, economic crises, etc. 

  • Nestle India Case Study: Business Model, Financial Statement, SWOT Analysis

    Nestle India Case Study: Business Model, Financial Statement, SWOT Analysis

    On a Sunday, you decide to relax at home with a cup of coffee and some Maggie. You probably won’t believe it when you learn that Nestle India Limited, a single FMCG company, makes the ingredients you’ll be using.

    In today’s blog post, we’ll talk about Nestle India, one of the biggest FMCG Companies in India.

    Nestle India Company Overview

    Nestle, the world’s biggest food and beverage company, has a long and illustrious history that began in the 1860s. The narrative begins with the formation of the Anglo-Swiss Condensed Milk Company in 1866, which produced ground-breaking milk products. Simultaneously, a German pharmacist, Henri Nestle, invented “Farine Lactee” to lower the newborn death rates. These businesses were successful because of their creative milk products, which catered to urban consumers with shifting lifestyles. The two businesses merged in 1905 to form Nestle. 

    The company’s main goal is to offer food and beverage items to clients of all ages and backgrounds. Its main offerings include frozen foods, baby formula, nutritious bars, instant coffee, and more. 

    Business Model of Nestle India

    Nestle’s business strategy is built around utilizing its well-known brand and widespread reach. It operates in 191 nations and has a research department in nearly all major nations. It has formed strategic alliances with many global brands and acquired many businesses. An effective supply chain can guarantee prompt product delivery to clients, and maintaining quality standards encourages brand loyalty. 

    Product Portfolio

    Nestle provides a large selection of products to its customers. In addition to boosting the nutritional value of its products while retaining the same level of flavor, Nestle is dedicated to innovation to fulfill the evolving demands of its customers. The company offers its products to customers through partnerships with dairy farms and various retail locations. Nestle owns numerous brands such as Nespresso, Nescafe, Kit Kat, Maggi, etc., and its 29 brands have annual sales of over $1.1 billion.

    Read Also: Zepto Case Study: Business Model, Financials, and SWOT Analysis

     Market Details of Nestle India Limited

    Current Market PriceINR 2,518
    Market Capitalization (In INR Crores)2,42,745 
    52 Week HighINR 2,771
    52 Week LowINR 2,163 
    P/E Ratio (x)75
    (Above Data as of 20 August 2024) 

    Financial Highlights of Nestle India Limited

    Income Statement

    Particulars31st Dec 202331st Dec 202231st Dec 2021
    Total Operating Revenues19,12616,89714,709
    Total Revenue19,24816,99814,830
    Total Expenses15,20413,74211,709
    Profit before tax4,0383,2562,884
    Profit after tax2,9992,3912,145
    (The figures mentioned above are in INR crores unless mentioned otherwise)
    Income Statement of Nestle India Limited

    Balance Sheet

    Particulars31st Dec 202331st Dec 202231st Dec 2021
    Total Non-Current Assets6,5005,4895,471
    Total Current Assets3,5943,4902,739
    Total Shareholders Funds3,0932,4592,084
    Total Non-Current Liabilities3,2113,4403,522
    Total Current Liabilities3,7913,0802,603
    (The figures mentioned above are in INR crores unless mentioned otherwise)
    Balance Sheet of Nestle India Limited

    Cash Flow Statement

    Particulars31st Dec 202331st Dec 202231st Dec 2021
    Cash flow from operating activities3,3922,7372,271
    Cash flow from investing activities-926-391-1,957
    Cash flow from financing activities-2,436-2,122-2,018
    (The figures mentioned above are in INR crores unless mentioned otherwise)
    Cash Flow Statement of Nestle India Limited

    Key Performance Indicators (KPIs)

    Particulars31st Dec 202331st Dec 202231st Dec 2021
    Operating Profit Margin (%)21.7620.1822.58
    Net Profit Margin (%)15.6714.1414.58
    Return on Net Worth/Equity (%)96.9597.20102.89
    Return on Capital Employed (%)66.0457.8159.24
    Current Ratio0.951.131.05
    Debt to Equity Ratio0.010.010.02

    Read Also: Britannia Industries Ltd Case Study: Business Segments, KPIs, Financials, and SWOT Analysis

    SWOT Analysis of Nestle India Limited

    SWOT Analysis of Nestle India Limited

    Strength

    • Global Presence – With a significant presence in more than 190 countries, the company is regarded as the most well-known firm in the FMCG sector
    • Variety:- Nestle is not dependent on one product as it has numerous brands with billions of dollars in annual sales.
    • Research – The business makes significant investments in product R&D, enabling it to adjust to the shifting customer preferences.

    Weaknesses

    • Product Pricing – The company could lose market share because it caters to a higher-end consumer base.
    • Supply Chain – Due to the intricate nature of the company’s distribution system, any disruption in the supply chain may affect the company’s earnings. 
    • Product Criticism – The company’s product has been criticized for quality issues recently. 

    Opportunities

    • Technological Advancement – The corporation will be able to lower production costs by integrating digital technologies into the business processes. 
    • Product Diversification – Since consumers are becoming health conscious, the corporation can add healthier products to its lineup.
    • E-Commerce – E-commerce platforms allow the business to boost digital or online sales. 

    Threat

    • Competition – The price war between businesses can lower the company’s profit margin. 
    • Economic Downturn – Any downturn in the economy will result in less demand for their products, which will immediately affect the company’s sales and earnings. 
    • Changing Consumer Preferences – Consumer preferences are ever-evolving; therefore, if a business cannot adapt, it will lose customers. 

    Conclusion

    In summary, Nestle India is a leading fast-moving consumer goods (FMCG) company in India that provides a wide range of products to meet the demands of its clients. The business is present in more than 190 countries worldwide. NESTLE is working to enhance its product line, but it has already experienced some negative feedback from customers regarding the quality of its products. Even if the company has a bright future, you should speak with your investment advisor before investing. 

    S.NO.Check Out These Interesting Posts You Might Enjoy!
    1Hindustan Unilever Case Study
    2Elcid Investments – India’s Costliest Stock
    3Reliance Power Case Study
    4Burger King Case Study
    5Zara Case Study
    6Kalyan Jewellers Case Study

    Frequently Asked Questions (FAQs)

    1. Who is the Chairman and Managing Director of Nestle India Ltd.?

      Suresh Narayanan is the company’s current Chairman and Managing Director (CMD).

    2. Is Nestle India a good stock to buy?

      Nestle India’s global presence and diverse product range give it a competitive edge, but investing in this stock involves a number of other risks, including changing customer preferences, price competition, etc. Investors should carefully assess their risk tolerance and speak to a financial advisor before making any decisions.

    3. Where is Nestle India headquartered?

      The headquarters of Nestle India is situated in Gurgaon.

    4. Is Nestle India a profitable company?

      The business has been consistently profitable for the previous three years, and its profits are consistently rising. 

    5. In what ratio is the share of Nestle India split?

      In 2024, the management of Nestle India approved a stock split in a 1:10 ratio, meaning that one share with a face value of INR 10 would be divided into ten shares with a face value of INR 1 for each equity share. 

  • TCS Case Study: Business Model, Financial Statement, SWOT Analysis

    TCS Case Study: Business Model, Financial Statement, SWOT Analysis

    The Indian IT industry is a global powerhouse, contributing to the nation’s economic growth. With the digital revolution, this industry has the potential to offer exciting investment opportunities for investors. However, with several IT companies vying for attention, TCS has been at the forefront of the global IT industry for over 5 decades. With an unwavering commitment to innovation and digital transformation, the company has played a vital role in empowering organizations to harness the power of technology.

    In today’s blog, we will explore TCS’s rich history, business model, and services it offers.

    TCS Company Overview

    Tata Consultancy Services (TCS) is an Indian multinational IT services and consulting company. TCS is headquartered in Mumbai and has more than 6,00,000 employees in 55 countries.

    TCS was founded in 1968, when Mr Fakir Chand Kohli, known as the Father of India’s IT industry, brought together a young team of IT professionals to provide punched card services to its sister company, TISCO (now Tata Steel). In the early years, TCS played an important role in establishing India’s IT industry. It was one of the first companies to provide software development and IT services. TCS has expanded its operations beyond India to have a significant presence in countries across America, Europe, Asia Pacific, the Middle East, and Africa, recognizing the growth opportunities in the global market.

    Business Model OF TCS

    TCS operates on a service-based business model that allows it to offer tailored solutions to meet each client’s specific needs. This approach has contributed to TCS’s success in building long-term relationships with its customers.

    TCS offers a range of IT services, which are discussed in the next section.

    Services offered by TCS

    TCS offers the following services:

    • TCS BaNCS – A banking and financial solutions platform. 8 out of the top 10 custodian and asset management firms run on TCS BaNCS. This service is used by 30% of the global population in over 100 countries.
    • TCS ADD – ADD stands for Advanced Drug Development, and TCS ADD is an advanced software suite that uses AI to transform drug development and clinical trials.
    • TCS CHROMA – It is a cloud-based HRMS platform with in-built intelligence and smart automation. HRMS stands for human resource management system
    • TCS OmniStore – It is an AI-powered commerce platform for seamless customer experiences. It offers a unified, personalized checkout experience for shoppers on different channels.
    • Ignio – AI-driven automation platform for IT and business operations with end-to-end closed-loop automation
    • TCS MasterCraft – Digital platform to optimally automate and manage IT processes.
    • Quartz Smart Solutions – It combines on-chain services deployed on blockchain and off-chain services residing in traditional files. The service ensures that business processes that are well suited for the blockchain are deployed on it.

    Furthermore, their customer-centric approach ensures that TCS products not only meet the needs and expectations of customers but also drive tangible results and create value for their businesses. With a deep understanding of market trends and technologies, TCS can deliver innovative solutions that make a difference.

    Market Details of TCS

    Current Market PriceINR 4,196
    Market Capitalization INR 15,17,719 Crores
    52 Week HighINR 4,431
    52 Week LowINR 3,311
    P/E Ratio (x)31.9
    (Data as of 12 August 2024)

    TCS Financial Statements 

    Income Statement

    ParticularsFY 2024FY 2023FY 2022
    Total Income2,45,3152,28,9071,95,772
    Total Expenditure1,82,5401,71,2211,43,301
    Net Profit46,09942,30338,449
    (The figures mentioned above are in INR crores unless mentioned otherwise)
    TCS Income Statement

    Balance Sheet

    ParticularsFY 2024FY 2023FY 2022
    Total Assets1,46,4491,43,6511,41,514
    Total Liabilities55,13052,44551,668
    Total Shareholder Funds90,48990,42489,139
    (The figures mentioned above are in INR crores unless mentioned otherwise)
    TCS Balance Sheet

    Cash Flow Statement

    ParticularsFY 2024FY 2023FY 2022
    Cash Flow from Operating Activities44,33841,96539,949
    Cash Flow from Investing Activities6,02639-897
    Cash Flow from Financing Activities-48,536-47,878-33,581
     (The figures mentioned above are in INR crores unless mentioned otherwise)
    TCS Cash Flow Statement

    Key Performance Indicators 

    Particulars (in %)FY 2024FY 2023FY 2022
    ROE (%)50.7346.6142.99
    ROCE (%)63.5157.6352.91
    Gross Profit Margin28.5227.8129.67
    Debt-to-equity Ratio000

    Read Also: Case Study on Trent Limited: Financials, Business Model, Marketing Strategies, and SWOT Analysis

    SWOT Analysis OF TCS

    SWOT Analysis OF TCS

    Strengths

    1. TCS has global operations that allow it to offer affordable and high-quality IT services to clients all over the world.
    2. TCS focuses on industry-specific solutions and has expertise in providing IT solutions to the banking, finance, insurance, retail, and manufacturing sectors.
    3. It has a large and skilled workforce, allowing it to handle complex IT projects.
    4. Being a part of the TATA group of companies, TCS benefits from robust financial support, which empowers it to make significant investments in research and development, acquisitions, etc.

    Weaknesses

    1. TCS relies heavily on a few major clients, which is risky.
    2. Talent retention is a challenging task, as it needs to maintain a high level of employee satisfaction and ensure that they stay loyal to the company.
    3. Geographical concentration can have a significant impact on revenue when there is an over-dependence on specific regions.

    Opportunities

    1. TCS can benefit from the increasing demand for digital transformation services.
    2. Exploring opportunities in AI, the Internet of Things (IoT), blockchain, and other emerging technologies can help TCS grow.
    3. TCS can also focus on strengthening its partnerships with technology providers to gain a competitive edge in the market and enhance its offerings.

    Threats

    1. The IT industry is very competitive, with many global companies competing for market share.
    2. Global economic recessions can cause a decrease in IT expenditure.

    Read Also: BSE Case Study: Business Model And SWOT Analysis

    Conclusion

    TCS has firmly established itself as a global IT services behemoth and is renowned for its robust financial position, large talent pool, and wide range of services. The company’s focus on new technologies and flexibility in adapting to changing markets have been important for its success. Despite facing intense competition and economic uncertainties, TCS carries out its business operations efficiently. To maintain its leadership, the company must invest in research and development, build strong client relationships, and effectively manage risks. 

    S.NO.Check Out These Interesting Posts You Might Enjoy!
    1HDFC Bank Case Study: Business Model, Financial Highlights, and SWOT Analysis
    2Vedanta Case Study: Business Model, Financial Statement, SWOT Analysis
    3Nestle India Case Study: Business Model, Financial Statement, SWOT Analysis
    4BPCL Case Study: Business Model, Product Portfolio and SWOT Analysis
    5Apollo Hospitals Case Study : Business Model, Financial Statements, And SWOT Analysis
    6Kalyan Jewellers Case Study

    Frequently Asked Questions (FAQs)

    1. Does TCS cater to any specific industry?

      Yes, TCS caters to several industries, with a strong focus on BFSI (Banking, Financial and Insurance), retail, healthcare, and manufacturing.

    2. What is the work culture at TCS?

      TCS is known for its employee-friendly culture, teamwork, and diversity.

    3. Is TCS involved in any social initiatives?

      Yes, TCS has a strong commitment towards Corporate Social Responsibility (CSR) and is involved in several community development programs.

    4. What is the TCS’s vision for the future?

      TCS aims to be the world’s leading digital transformation partner by using technology and creating value for its clients and society.

    5. Should I invest in TCS?

      TCS can be a good investment option. However, it is crucial to consult your financial advisor before making any financial decision.

  • Suzlon Energy Case Study: Business Model, Financial Statement, SWOT Analysis

    Suzlon Energy Case Study: Business Model, Financial Statement, SWOT Analysis

    Our natural resources are at the point of exhaustion, and renewable energy is the only way to fulfill the energy demands in future. India is ranked fourth in the world in renewable energy installed capacity. Firms engaged in manufacturing wind turbines will have a crucial role in harnessing wind energy and moving towards a sustainable future.

    Suzlon Energy Ltd is one the companies engaged in the renewable energy sector. In today’s blog post, we will share the overview and business model of Suzlon Energy. Moreover, we will discuss its financial performance and do a SWOT analysis of the company.

    Suzlon Energy Company Overview

    Suzlon Energy is an Indian multinational wind turbine manufacturer with its headquarters in Pune. It was established in 1995 by Mr. Tulsi Tanti and is now a leader in providing renewable energy solutions. Suzlon’s efforts in wind energy reduce 53.37 million tonnes of CO2 emissions annually by generating 54.62 TWh of clean energy each year. The company has operations in 17 countries and has installed more than 13,000 wind turbines.

    Business Model of Suzlon Energy

    Suzlon Energy Business Model 

    Suzlon Energy has mastered the “Concept to Commissioning” Suzlon business model to provide comprehensive renewable energy solutions to its clients. The “Concept to Commissioning” model involves the following steps:

    1. Feasibility Studies
    2. Complex Engineering Design
    3. Manufacturing of wind turbines and components
    4. Installation
    5. Commissioning of wind farms
    6. 24*7 operations and maintenance

    Since its inception, Suzlon has grown significantly, reaching a global presence with installations in 17 countries. It is the only Indian company to reach 20 GW wind energy installations.

    Product Offerings

    Suzlon Energy provides the following products:

    1. S120 Wind Turbine Generator: S120 has a 2.1 MW capacity and is available in three variants. This product is suitable for low-wind sites.
    2. S133 Wind Turbine Generator: S133 has a 3 MW capacity and can be installed in any wind site.
    3. S144 Wind Turbine Generator: It is the latest model of wind turbine generator developed by Suzlon with 40% higher power generation than other models.

    Market Details of Suzlon Energy Ltd. 

    Current Market Price₹ 80.4
    Market Capitalization (in Crores)₹ 1,08,658
    52 Week High₹ 80.4
    52 Week Low₹ 19.3
    P/E Ratio (x)127.56
    (Data as of 12 August 2024)

    Read Also: TCS Case Study: Business Model, Financial Statement, SWOT Analysis

    Suzlon Energy Financial Statements

    Income Statement

    ParticularsMarch 2024March 2023March 2022
    Total Income 6,5675,9906,603
    Total Expenditure5,7432,6775,869
    EBIT8233,312734
    Net Profit6602,887-166
    (The figures mentioned above are in INR crores unless mentioned otherwise)
    Income Statement of Suzlon Energy

    Balance Sheet

    ParticularsMarch 2024March 2023March 2022
    Total Non-Current Assets1,8911,3451,389
    Total Current Assets5,2874,1775,084
    Total Non-Current Liabilities2491,7233,578
    Total Current Liabilities3,0082,7004,234
    Total Shareholder Funds3,9201,099-1,316
    (The figures mentioned above are in INR crores unless mentioned otherwise)
    Suzlon Energy Balance sheet

    Cash Flow Statement

    ParticularsMarch 2024March 2023March 2022
    Cash flow from operating activities334661,301
    Cash flow from Investing activities-15184-18
    Cash flow from Financing activities177-684-1,044
    (The figures mentioned above are in INR crores unless mentioned otherwise)
    Suzlon Energy Cash Flow Statement

    Key Performance Indicators (KPIs)

    ParticularsMarch 2024March 2023March 2022
    Net Profit Margin (%)10.1148.35-2.52
    ROCE (%)21.0420.9629.09
    Current Ratio1.761.551.20
    Debt to Equity Ratio0.031.73-1.18

    Read Also: Ather Energy Case Study: Business Model, Financials, and SWOT Analysis

    SWOT Analysis of Suzlon Energy 

    Strengths

    • Technological expertise: The company excels in wind turbine technology, providing efficient and cost-effective solutions. Suzlon invests in R&D to continually improve turbine design and efficiency.
    • Market position: Suzlon is a leading player in India’s wind energy market and has a strong market share.

    Weaknesses

    • High Debt: Suzlon’s profitability and ability to invest in new projects have been significantly reduced due to high debt levels.
    • Operational Challenges: Suzlon has been facing operational challenges, such as delayed project execution and increased costs.
    • Low cash flow from operations: Company financials show lower cash inflow from operating activities for the last 2 years. 

    Opportunities

    • Growing demand for renewable energy: The demand for the company’s products will increase in future, which will result in increased revenues and profits
    • Strategic Partnerships: Suzlon can expand its operations in international markets by forming strategic alliances with other companies.

    Threats

    • Regulatory Changes: Changes in government policies can have a negative impact on the company’s profitability.
    • Environmental Risks: Suzlon Energy has been majorly involved in harnessing wind energy, and any changes in wind patterns can affect energy production.

    Read Also: Nestle India Case Study: Business Model, Financial Statement, SWOT Analysis

    Conclusion

    Suzlon Energy Ltd., a known company in India’s renewable e­nergy sector, uses its te­chnological expertise to provide renewable energy solutions to its clients. The company’s ability to provide effective solutions makes it the market leader in the renewable energy industry. However, variable cash flow from operations, high P/E ratio, etc., also represent significant risks. Investors must thoroughly analyze the financial statements, gauge their risk tolerance capacity, or consult a financial advisor before investing.

    S.NO.Check Out These Interesting Posts You Might Enjoy!
    1Hindustan Unilever Case Study
    2Elcid Investments – India’s Costliest Stock
    3Reliance Power Case Study
    4Burger King Case Study
    5Zara Case Study

    Frequently Asked Questions (FAQs)

    1. Does Suzlon Energy have international operations?

      Suzlon operates in 17 countries, showcasing its global reach and expertise in wind energy solutions.

    2. Does Suzlon offer any hybrid energy solutions?

      Suzlon also provides wind-solar hybrid solutions, combining wind and solar power for enhanced power generation.

    3. What is Suzlon’s role in India’s renewable energy landscape?

      Suzlon is one of the top companies in India’s renewable energy sector, contributing significantly to the country’s wind power capacity.

    4. How does Suzlon manage its financial challenges?

      Suzlon is actively working on reducing its debt and improving profitability through strategic investments and operational efficiency.

    5. What is Suzlon Energy’s business model?

      Suzlon Energy works on the “Concept to Commissioning” model, which indicates the company’s ability to provide service to its customers, starting from concept development to 24*7 operations and maintenance of the commissioned equipment.

  • Open Free Demat Account

    Join Pocketful Now

    You have successfully subscribed to the newsletter

    There was an error while trying to send your request. Please try again.

    Pocketful blog will use the information you provide on this form to be in touch with you and to provide updates and marketing.