Category: Case Study

  • IPO Alert – Capital Small Finance Bank

    IPO Alert – Capital Small Finance Bank

    India’s investor community has come a long way from investing in bank fixed deposits to participating in initial public offerings (IPOs), a relatively riskier alternative. Initially, people hesitated to invest even in a renowned company, but nowadays, they are actively interested in initial public offerings (IPOs).

    You would be surprised to hear that in 2022, the Indian stock market reported the third-highest number of initial public offerings (IPOs) globally. Additionally, India saw several fantastic initial public offerings (IPOs) in 2023, some of which allowed investors to earn over 90% in listing gains!

    In today’s blog, we will explore another IPO, Capital Small Finance Bank.

    If you haven’t read our blog on Jana Small Finance IPO, click here to check it out. 

    Overview of the company

    Initially founded as Capital Local Area Bank(CLAB), Capital Small Finance Bank mostly operated in Punjab. With RBI’s approval on April 24, 2016, it became India’s first small finance.

    In February 2017, it received the designation of a ‘scheduled bank’ (these banks get access to low-interest loans from RBI), which allowed it to increase its lending and borrowing capabilities.

    Capital Small Finance Bank started its business operations with 39 branches but currently operate around 1000 branches in the country. 

    Promoters

    The Samara Family is in charge of the Capital Small Finance Bank, and Mr Sarvjit Singh Samra serves as both the institution’s managing director and CEO. In the year 2000, he was instrumental in the founding of Capital Local Area Bank.

    Dinesh Gupta, Amarjit Singh Samara, Navneet Kaur Samara, and Surinder Singh Samara are other family members who are regarded as promoters.

    The promoters group holds approximately 24% of Capital Small Finance Bank Shares.

    Details of the issue

    Capital Small Finance Bank is proposing an IPO of Rs. 523.07 crore. The IPO consists of an offer for sale of 73.07 crore and a fresh issue of Rs. 450 crore.

    The Capital Small Finance Bank IPO is open to the public from February 7 to February 9, 2024. The shares will be allotted in full on February 12th, 2024, with a listing date of February 14th on the NSE and BSE.

    Timeline of the IPO

    IPO Open Date7th Feb 2024
    IPO Close Date9th Feb 2024
    Finalization of Allotment12th Feb 2024
    Initiation of Refund13th Feb 2024
    Credit of Shares into a Demat Account13th Feb 2024
    Listing Date on NSE & BSE14th Feb 2024

    Details of the IPO

    Face Value of ShareRs. 10
    Price BandRs. 445 – 468 per share
    Market Lot32 Shares
    Total Issue SizeRs. 523.07 Crores
    Total Number of Shares1,11,76,713 shares
    Fresh Issue SizeRs. 450 Crore
    Offer for SaleRs. 73.07 Crore
    Listing ExchangeNSE & BSE

    Objective of the Issue

    The main objective of Capital Small Finance Bank is to use the funds from the offering to meet the bank’s projected future capital needs, and the issue costs may also be covered using the money that was raised.

    IPO Allotment Size

    The table below displays the minimum and maximum number of shares that an investor is eligible to apply for.

    ApplicantMarket LotShareAmount
    Retailer (Min)13214,976
    Retailer (Max)134161,94,668
    Small High Net Worth Individual (Min)14448209,664
    Small High Net Worth Individual (Max)662,1129,88,416
    Ultra High Net Worth Individual (Min)672,14410,03,392

    The aforementioned figures showcase that a retail investor can invest a minimum of INR 14,976 rupees and a maximum of INR 1,94,668. 

    Lead Managers

    Equirus Capital Private Limited, DAM Capital Advisors Limited, and Navuma Wealth Management Limited are the firms in charge of managing the Capital Small Finance Bank IPO procedure.

    Read Also: IPO Alert: Jana Small Finance Bank

    Financial Highlights of Capital Small Finance Bank (In crores, unless stated otherwise)

    Particulars31 Mar 202331 Mar 202231 Mar 2021
    Assets7,990.777,153.926,371.24
    Revenue725.48632.40557.27
    Profit After Tax93.6062.5740.78
    Reserve & Surplus576.36481.74416.88
    Total Borrowings721.38498.43616.72
    Capital Adequacy Ratio – Total Capital (CRAR) (%)18.87%18.63%19.8%
    Net NPA (NNPA) (%)1.36%1.36&1.13%
    Net Interest Margin (NIM) (%)4.19%3.74%3.36%
    CASA Ratio (%)41.88%42.16%40.08%

    Both the revenue and the assets have significantly improved which suggests that the bank is operating profitably. Additionally, not only did the bank’s clients increase, but the profit after tax also rose by almost 50% y-o-y in FY23.

    The CASA ratio indicates that the bank has access to a stable and consistent source of cheap money as interest rates on Savings and Current account holdings are much lower than traditional borrowings. 

    The Net NPA ratio showcases the bank’s efficiency in providing loans only to credit-worthy individuals and institutions. A consistent rate of 1.3% is much lower than the industry average of 3-4%.

    A healthy NIM of around 4% indicates stability even in an environment where all major banks saw a decrease in NIM.

    Additional Key Performance Indicators (KPIs) 

    ROE – Capital Small Finance Bank’s return on equity ratio rose to 16.62% in FY23 from 12.95% in FY22.

    RoE is the ratio of profit after tax to average net worth.

    EPS – Capital Small Finance Bank’s earnings per share rose to 27.35 in FY23 and 18.41 in FY22. 

    This crucial financial ratio establishes the company’s profitability. It is computed by dividing net income by the total number of outstanding shares of the corporation.

    P/E Ratio – Currently, the price-to-earnings ratio stands in the range of 16.27 to 17.11, based on the lower and upper end of the price band. 

    The amount an investor is willing to pay for a single share of a company for one rupee of its earnings is referred to as the PE ratio.

    Risks

    1. Competition – The small finance banking industry is extremely competitive, with many players entering the market and even getting into the public domain via launching IPOs. This may cause some serious issues as fierce competition leads to decreased margins and market share.
    2. Negative Cash Flow – The bank has a history of having negative cash flow from operating activities. In FY23, CFO stood at -107.44 Crores, and in FY22, CFO was -210.74 Crores. The bank’s inability to generate positive cash flow from a money-making business like banking could be indicative of deeper inefficiencies that are more qualitative than quantitative. 
    3. High attrition rate – In FY23, the bank faced an attrition rate of 19.82%. This is extremely high and showcases the dissatisfaction among the workforce. This could translate into decreased margins in the coming years. 
    4. RBI Crackdown impending – As of now, the small finance banking industry has been allowed many relaxed requirements that other banks have to face. If RBI decides to take some of those relaxations away, then it could dramatically affect the margins of these banks. 
    5. Geographical concentration – As of FY23, 87% of the branches were in Punjab and 96.44% of deposits came from the region. This could be indicative of the bank’s unwillingness to expand beyond Punjab, to other regions of the country. 

    Read Also: Small Finance Bank Share List in India 2025

    Conclusion

    Investors have a fantastic opportunity to access a bank with a strong and profitable track record in the market through the initial public offering (IPO). Currently, the bank offers a varied loan portfolio with robust growth in both revenue and margin over the years.

    Investing in initial public offerings (IPOs) involves conducting extensive research on the regularities that the companies must meet. 

    The suitability of investment in an IPO depends on an individual’s risk horizon and financial objective. So, you must do your research before investing! 

    Frequently Asked Questions (FAQs)

    1. How can I participate in the Capital Small Finance Bank IPO?

      You can participate in Capital Small Finance Bank IPO through your demat account via ASBA (Application Supported by Blocked Amount) or UPI (through the broker).

    2. What will happen after I subscribe for the IPO?

      Shares are listed on the exchange after you subscribe for the initial public offering (IPO), at which point you can purchase and/or sell shares.

    3. Does the bank have enough capital to support its deposits/liabilities in case of emergency?

      The Capital Adequacy ratio, as prescribed by RBI, has to be above 15% for Small finance banks, and the Capital Small finance bank has consistently beaten this requirement by at least 3%. 

    4. What is the issue price of the Capital Small Finance Bank IPO?

      The price band of Capital Small Finance Bank IPO is 445 to 468 INR.

    5. Why is Capital Small Finance Bank going public?

      Capital Small Finance is going public to meet capital requirements.

  • IPO Alert: Jana Small Finance Bank

    IPO Alert: Jana Small Finance Bank

    If you are someone who is curious about investing in IPOs, fasten your seat belt because we are back again with another IPO study!

    In this blog, we will explore the details of Jana Small Finance Bank IPO, which is all set to hit the Indian stock exchange on 14th February 2024.

    Jana Small Finance Bank Overview

    Before its establishment in 2006, Jana Small Finance Bank Limited was known as Janalakshmi Financial Services. It offered Micro, Small and Medium Enterprises (MSME) loans, affordable housing loans, term loans, fixed deposit loans, two-wheeler loans, and gold loans.

    In 2017, the Reserve Bank of India (RBI) granted Janalakshmi Financial Services a license to become a Small Finance Bank (SFB), enabling it to provide a broader range of financial products.

    SFBs are a new entrant into the banking system established to provide essential banking services to MSMEs, Shopkeepers, Farmers, etc. Recently, SFBs have witnessed a rapid growth in terms of deposits and branches.

    In terms of AUM and deposit size, Jana Small Finance Bank ranks as the fourth-largest small finance bank. Additionally, it has 771 banking outlets including 278 in unbanked rural centers. Thus serving more than 4.87 million active clients. The company is run by 18,184 permanent employees.

    Promoters

    The promoters of Jana Small Finance Bank are Jana Holdings Limited, Jana Capital Limited, and Jana Urban Foundation (which was previously known as Jana Social Services).

    Details of the IPO

    Jana Small Finance Bank IPO’s issue size is INR 570 crore, through a book-building issue. The IPO is a combination of a fresh issue and an offer for sale; the fresh issue consists of about INR 462 crores whereas, the offer for sale consists of INR 108 crores.

    The IPO’s subscription period will begin on February 7th, 2024, and will end on February 9th, 2024.

    Timeline of the IPO

    IPO Open Date7th Feb 2024
    IPO Close Date9th Feb 2024
    Finalisation of Allotment12th Feb 2024
    Initiation of Refund (in case of no allotment)13th Feb 2024
    The credit of shares into Demat Account (in case of allotment)13th Feb 2024
    Listing Date on NSE & BSE (tentative)14th Feb 2024

    The objective of the Issue

    The goal of Jana Small Finance Bank’s IPO is to use the proceeds to cover the bank’s anticipated future capital needs. The raised capital can also be used to cover the cost of the issue.

    Key details of the IPO

    Face Value of ShareRs. 10
    Price BandRs. 393 – Rs. 414 per share
    Market Lot36 Shares
    Total Issue SizeRs. 570 Crores
    Total Number of Shares13,768,049 shares
    Fresh Issue SizeRs. 462 Crore
    Offer for SaleRs. 108 Crore
    Listing ExchangeNSE & BSE

    Allotment Size

    The market lot of Jana Small Finance Bank IPO is 36 Shares. The minimum and maximum number of shares that an investor can apply for are shown in the table below.

    ApplicantMarket Lot(s)SharesAmount (Rs.)
    Retailer (Min)13614,904
    Retailer (Max)134681,93,752
    Small High Net Worth Individual (Min)145042,08,656
    Small High Net Worth Individual (Max)6724129,98,568
    Ultra-High Net Worth Individual (Min)68244810,13,172

    The figures above showcase that a retail investor can invest as little as INR 14,904 rupees and as much as INR 1,93,752 at maximum.

    Read Also: Small Finance Bank Share List in India 2025

    Financial Highlights of Jana Small Finance Bank

    Have a look at the key Financial metrics of the company (in Crores, unless stated otherwise).

    ParticularsFY 2023FY 2022FY 2021
    Total Assets25,64420,18919,079
    Revenue3,7003,0622,721
    Profit After Tax (PAT)25617.4772
    Net Worth1,7771,1851,101
    Reserves & Surplus1,472999914
    Total Borrowings6,2774,5094,815
    Total Capital Ratio (CRAR) (%)15.57%15.26%15.51%
    Tier 1 Capital Ratio (%)13.02%11.83%11.75%
    Net Non-Performing Assets (NPA) (%)2.64%3.95%5.33%
    Net Interest Margin (NIM) (%)7.73%7.32%8.36%
    CASA Ratio# (%)20.21%22.52%16.29%
    Source – Prospectus

    # – CASA Ratio is the ratio of current and savings account deposits to total deposits. It tells us the percentage of deposits that are low-cost access to banks as interest in these accounts is lower than in other deposits such as Fixed Deposits.

    The financial data makes it evident that profit after taxes has improved over the years, and NPAs have reduced substantially. Both assets and borrowings have increased with a significant increase in revenue. It is indicative of sound fundamentals.

    But, the NIM and CASA ratios tell a different story. The NIM of small finance banks are generally higher than other banks, and Jana SFB’s competitor, Ujjivan SFB, is averaging 9% NIM in these markets. The CASA ratio also does not paint a rosy picture of the bank’s operations. The industry standard ranges at north of 25%, but Jana SFB is unable to achieve these ratios. Also, the CRAR has a trend of barely meeting the guideline of 15% for small finance banks.

    Additional Ratios

    ROAE – ROAE or Return on Average Equity is calculated as the net profit for the relevant period to Average Net Worth for the relevant period, expressed as a percentage.

    Jana SFB’s ROAE as now is 16.78%.

    P/BV – Price to book value represents the price divided by book value or how much an investor is willing to pay for the company over book value.

    Price to book value or P/BV ratio is 1.28 for Jana Small Finance Bank.

    EPS – Earnings per share, or EPS, is the total earnings a shareholder has earned. It is computed by dividing the business’s profit after tax by the number of outstanding shares.

    Jana Small Finance Bank’s Basic EPS stands at 47.47.

    P/E Ratio – The relationship between the stock price and earnings per share is known as the company’s price-to-earnings ratio.

    According to the price range of IPO, Jana Small Finance Bank would have a PE Ratio of 8.28 – 8.72.

    Read Also: IPO Alert – Capital Small Finance Bank

    Conclusion

    The growing network of Jana Small Finance Bank may pose a threat to the current small financing banks. The Jana Small Finance Bank’s primary goal is to empower individuals and small businesses.

    Before taking into consideration the above-mentioned IPO of Jana Small Finance Bank, remember to consult your financial advisor. Keep in mind that the suitability of investment in IPOs completely depends on your investment horizon and risk profile.

    Frequently Asked Questions (FAQs)

    1. What is the issue price of Jana Small Finance Bank IPO?

      The price band of Jana Small Finance Bank IPO is INR 393 to 414.

    2. What will be the issue size of the Jana Small Finance Bank IPO?

      The issue size of Jana Small Finance Bank IPO is 570 crore.

    3. What is the minimum investment amount for retail investors?

      The minimum investment amount for a retail investor to invest in Jana Small Finance Bank IPO is INR 14,148 (at the lower end of the price range).

    4. Can Jana Small Finance Bank successfully expand its operations?

      With rural areas exhibiting lower financial inclusion rates than urban areas and facing less competition in banking services, it seems Jana Small Finance Bank has promising growth prospects ahead.

    5. Does Jana Small Finance Bank have any regulatory penalties?

      No, the management has remained clear of any major regulatory penalties as of Feb 2024.

  • Axis Bank vs ICICI Bank: Analysis of Private Sector Banks

    Axis Bank vs ICICI Bank: Analysis of Private Sector Banks

    I am sure that you all have heard about Axis bank vs ICICI bank, but have you ever thought which of these banks is doing better? 

    Prepare for a financial showdown as we dissect these two titans of the private banking sector. Uncover the strengths, weaknesses, and strategies shaping India’s banking landscape.

    Axis Bank – An Overview 

    One of India’s top three banks, Axis Bank, was initially established as UTI Bank by a joint venture between the Life Insurance Corporation of India, the Government of India, and other business houses.

    UTI Bank’s operations started in the year 1994 when it opened its first branch in Ahmedabad, Gujrat. By the mid of 2007, UTI bank was renamed to “Axis Bank” and Shikha Sharma was appointed as the MD and CEO. It soon became a well-established and recognised bank in the Indian Banking sector. This was a turning point in the history of Axis Bank because it became an aggressive player, and focused on branch expansion and innovation. Additionally, Axis Bank consistently made an effort to diversify its product portfolio.  

    At present, Axis Bank has a total of over 4,800 branches and 13,000 ATMs throughout India. The headquarters of Axis Bank is located in Mumbai. The bank is advancing to new heights with Mr Amitabh Chaudhary as its MD and CEO.

    The bank now offers a variety of financial products, including credit cards, savings accounts, current accounts, brokerage facilities, and retail banking.

    Read Also: HDFC Bank vs Axis Bank

    ICICI Bank – An Overview 

    Axis Bank vs ICICI Bank

    ICICI Banks stands for Industrial Credit and Investment Corporation of India and is regarded as India’s second-largest private sector bank. Through a joint venture with other industrial houses, the World Bank and the government of India initiated the establishment of ICICI in 1955 as a part of their initiative to accelerate the economy’s industrial growth by providing them with long and medium-term growth.

    In October 2001, the directors of ICICI and ICICI Bank approved the merger of its subsidiary businesses such as ICICI Personal Finance Limited, and ICICI Capital Services Limited with ICICI Bank. The directors of ICICI and ICICI Bank granted their approval for the merger of their subsidiary businesses, such as ICICI Personal Finance Limited, and ICICI Capital Services Limited into ICICI Bank in October 2001. In 2002, the merger proposal was completed and sanctioned by the RBI. Subsequently, all the branches of ICICI were merged into one entity referred to as ICICI Bank.

    At present, ICICI bank has more than 5,500 branches across India, as well as more than 13,200 ATMs.

    ICICI became the first Indian company and Asian bank other than Japanese Banks to be listed on the New York Stock Exchange (NYSE). ICICI Bank is currently under Mr. Sandeep Bakshi’s guidance.

    Read Also: ICICI Vs HDFC Bank

    Axis Bank vs ICICI Bank Comparative Analysis 

    Before deciding which private bank is best for you, we will provide you with a comparison between Axis and ICICI Bank.

    Market Capitalization

    Axis Bank – 3,28,352 Crores (As of 7th Feb 2024)

    ICICI Bank – 7,15,780 Crores (As of 7th Feb 2024)

    From the figures above we can say that ICICI Bank has a higher market capitalization than Axis Bank.

    These two players dominate the Bank nifty index as ICICI Bank has a weightage of 24.45% and Axis Bank has a weightage of 10.05%.

    Share Price

    Axis Bank – 1063 (As of 7th Feb 2024)

    ICICI Bank – 1019 (As of 7th Feb 2024)

    Axis Bank vs ICICI Bank Financial Statement Analysis

    Before we move on, let’s start by looking at the financial statements of Axis Bank and ICICI Bank in a comparative manner.

    1. Total Income – Axis Bank’s total income was Rs 35,136 crores, while ICICI Bank’s total income is about Rs. 59,479 crores, showcasing a year-on-year growth rate of around 27% for both companies. 
    2. Net Profit – The net profit of Axis Bank is Rs. 6,493 crores, while ICICI Bank has a net profit of around 11,255 crores, depicting a YoY growth rate of -23.4% and 33.64% respectively. 
    3. Total Assets – The total assets of Axis Bank are worth approximately Rs. 1,344,417 crores, while the total assets of ICICI Bank are valued at approximately Rs. 19,58,490 crores while having a YoY growth rate of 12.45% and 11.74% respectively. 
    4. Total Deposits  – Axis Bank holds around 9,45,824 crores in deposits, while ICICI Bank holds Rs.12,10,832 crores. The YoY growth rate stood at 15.2% and 11%. 
    5. Net NPA – The Net NPA of Axis Bank was 0.39% in FY23 from 0.73% in FY22, whereas the Net NPA of ICICI Bank was 0.51% in FY23 from 0.81% in FY22.

    (The above mentioned figures are as of March 2023)

    Key Ratios

    Axis Bank vs ICICI Bank

    Now that we have compared financial statements, we can move on to the key ratios of both Axis Bank and ICICI Bank.

    1. TTM PE Ratio – PE ratio refers to the price-to-earning ratio of a company, which tells whether the company stock is overvalued or undervalued. In terms of Trailing Twelve Months (TTM) PE ratio, Axis Bank has a PE ratio of 24.46, whereas ICICI Bank has a PE ratio of 16.88.
    2. CASA (Current Account and Savings Account) – CASA refers to the ratio of the total amount deposited by the customer into their savings and current accounts compared to the total amount deposited in the bank. Axis Bank had a CASA ratio of 47.12% in FY23 and 44.96% in FY22, and ICICI Bank had a CASA ratio of 45.47% in FY23 and 48.60% in FY22. Current and savings accounts constitute a substantial portion of both ICICI and Axis Bank’s total deposits. This indicates that the banks are able to get access to cheaper sources of funds. But, while Axis bank managed to increase its CASA ratio, ICICI’s ratio decreased. 
    3. Net Interest Margin – The Net Interest Margin (NIM) is the distinction between the income generated by banks from interest earned and interest payout to deposit providers.
    4. Operating Profit Margin The operating profit margin is determined by dividing the bank’s operating profit by its operating earnings. If the operating profit margin is higher, the bank is better able to manage its operations. Axis Bank has a negative operating profit margin of -8.98%, while ICICI Bank has a negative operating profit margin of -25.31%. 

    (The above mentioned ratios are as of March 2023)

    Did you know?

    NPA stands for non-performing assets, which are loans and advances given by banks to customers whose repayment is overdue by more than 90 days.

    Read Also: Blinkit vs Zepto: Which is Better?

    Conclusion

    Although ICICI Bank has a higher net interest margin than Axis Bank, the operating profit margin of ICICI Bank is less than Axis Bank. However, these are not the sole factors that one should consider before investing in these banks. Despite the strong branch network and fundamentals of these banks, it is important to consider your risk appetite and investment horizon before making any investment decision.

    S.NO.Check Out These Interesting Posts You Might Enjoy!
    1SBI vs ICICI Bank
    2PNB vs Bank of Baroda
    3Bank of Baroda vs SBI
    4Bank of Baroda vs Canara Bank
    5PNB vs SBI

    FAQs

    1. What is the full form of ICICI?

      ICICI stands for Industrial Credit and Investment Corporation of India.

    2. Which bank has a higher market capitalization?

      ICICI Bank has a higher market capitalization.

    3. Axis Bank or ICICI Bank: Which is better for a savings account?

      Both banks offer similar interest rates and services, but ICICI Bank has a larger branch network, while Axis Bank provides additional perks like cashback and rewards. Choose based on your need for accessibility or added benefits.

    4. Is it true that ICICI is an Indian Bank?

      Yes, ICICI is an Indian Bank.

    5. Who is the current MD and CEO of ICICI Bank?

      Mr Sandeep Bakshi is the current MD and CEO of ICICI Bank.

    6. Which bank has the most branches: ICICI or Axis Bank?

      ICICI Bank has more branches as compared to Axis with around 5,500 branches across India. 

  • Reliance Industries Case Study: Marketing Strategy and SWOT Analysis

    Reliance Industries Case Study: Marketing Strategy and SWOT Analysis

    Do you know how Reliance Industries became one of India’s most successful and popular companies?

    As we know, Mr. Dhirubhai Ambani started Reliance in 1958 in Mumbai, Maharashtra. The business includes different industries like energy, petrochemicals, natural gas, retail, telecommunications, mass media, and textiles.

    This blog will break down the marketing strategies and SWOT analysis of Reliance Industries. Still, before we delve deeper into it, we will briefly look at the history of Reliance Industries.  

    About Reliance Industries

    Reliance Industries is India’s largest company in terms of market cap (as of 7 Feb 2024) and is involved in energy, refining, textiles, retail, and telecommunications business. Incorporated by the famous tycoon Mr. Dhirubhai Ambani and managed by Mr. Mukesh D. Ambani. It is the 100th largest company worldwide. As of 7 Feb 2024, Reliance Industries market cap stood at INR19.05 lakh crore.

    Here are the quick stats about the Reliance Industry:

    Founded byMr. Dhirubhai Ambani
    IndustryConglomerate
    Founded In1958
    Company TypePublic
    HeadquartersMumbai, Maharashtra, India
    Area ServedAcross the globe
    Key PersonMukesh Ambani, Chairman & Managing Director
    SectorsOil and Gas, Chemicals, Telecommunications, Retail, Media, etc.
    RevenueINR 10,00,122 crores in FY 2024
    Profit after tax (PAT)INR 79,020 crores in FY 2024
    Total assetsINR 17,55,986 crore in 2024
    SubsidiariesJio Platforms, Reliance Reliance Retail, Network18 Group, Alok Industries, Reliance Foundation, Indiawin Sports, etc.  

    Market Information of Reliance Industries

    Current Market Price ₹1,281
    Market Capitalization (in ₹ Crores)17,32,955
    52 Week High₹1,609
    52 Week Low₹1,156
    Dividend Yield0.39%
    ROCE9.61%
    (Data as of 28 March 2025)

    Read Also: Reliance Power Case Study: Business Model, Financial Statements, And SWOT Analysis

    Marketing Strategy of Reliance Industries

    Reliance Industries Limited has a wide range of target audiences to serve. So, let us understand how the company serves its offerings using the Marketing Mix Model framework, which covers understanding its product, pricing, advertising, & distribution strategies.

    Product Strategy

    Reliance Industries, one of India’s largest conglomerates, spans various sectors and accounts for 20% of the nation’s exports. Its portfolio includes Reliance Fresh, Reliance Trends, Reliance Mart, and more.

    Pricing Strategy

    Reliance Industries follows different pricing strategies for different sectors. This company follows the pricing penetration for retail, telecommunications, and health. When Reliance launched Jio, it offered free services to its customers to enhance its market share.

    The telecommunications industry was at a loss, but Jio still decided to provide unprecedented offers to customers to increase their customer base. This led to a complete revolution in the industry as smaller players could not fight such a rough battle and hence had to shut shop. Outlets such as Reliance Fresh provide products directly to the consumer at a discounted price. Reliance Industries focuses on pricing analysis before making a price decision. This strategy has helped them gain unrivaled positions in the industry.

    Place & Distribution Strategy

    Reliance Industries has a strong presence throughout the nation. Reliance Retail is the largest retailer with more than 1500 stores in the country, and other brands such as Reliance Fresh, Reliance Footprint, and Reliance Digital have reached Tier 1 and Tier 2 cities. While Tier 3 is still majorly yet to experience the wonders of the company.

    Promotion & Advertising Strategy

    The promotional strategy of the Reliance industry is a mix of all types of theories, including pamphlets, ads, and word of mouth. Reliance also focused on 360 branding and brand promotion. They use the tagline “Growth is Life” and have encapsulated their sentiments about taking people together.

    Reliance Industries Limited owner Mukesh Ambani also acquired the rights of the Mumbai Indians for 10 years, bringing the Reliance brand to the limelight. After that, Jio launched the hashtag #DigitalIndia in the market, which encourages youth to be digitally active. Reliance Industries’ success factor for Jio is ensuring the deliverables to their consumers to make them habituated to the service, which impacted their competitors in ways they hadn’t even imagined!

    Marketing Campaign

    Reliance marketing campaigns keep the brand presence alive in consumers’ minds and build trust, which directly impacts the goodwill of the company. Let’s get into the market campaigns of Reliance:

    • Reliance Jio launched a campaign named Jio Dhana Dhan in 2017. This campaign is still ongoing and holds the market with its new, updated products and services.
    • Reliance Retail enhanced its advertisement volume after the pandemic to retain the audience’s attention.
    • For its marketing campaigns, Reliance Digital mainly focuses on showcasing the latest technology products, features, and services available at its stores. One of the recent ad video campaigns was named “Technology se Rishta Jodo”. This ad was a big hit on the internet, with 9m+ views, and it even got many positive comments.

    Read Also: Jio Financial Services: Business Model And SWOT Analysis

    SWOT Analysis of Reliance Industries

    Let’s move into Reliance Industries SWOT Analysis. It includes a deep study of the company’s strengths, weaknesses, opportunities, and threats.

    Strengths

    • Reliance Industries is India’s biggest conglomerate company in terms of revenue and profitability. It is a well-known brand across the globe.
    • It has diversified into several businesses, such as telecom, retail, petroleum, media, and many more. This reduces the effect of seasonality on the company’s performance.
    • The company is successful because they have a holistic approach to growth and progress. This has been demonstrated by their decades of complete dominance over people’s hearts.
    • Reliance Industries is also heavily involved in CSR activities like sustainable development, education, healthcare, uplifting the financially unfortunate, girl child protection, etc.

    Weaknesses

    • The weakness of Reliance Industries lies in the challenge of maintaining its market position amidst high competition. However, this risk is somewhat mitigated by the company’s dynamic and competent management, which helps navigate the competitive landscape effectively.
    • The company also faced controversies and conflicts such as stock manipulation, the Krishna Godavari Basin gas issue, etc. While many of these controversies turned out to be hoaxes, they still hold enough power to materially affect the stock price.

    Opportunities

    • Reliance Industries also partnered with other brands to expand their business by using small-scale manufacturers to meet high demand during peak seasons.
    • To avoid competition, Reliance Industries should consider buying small and weak players. This tactic has also proven quite effective in consistently increasing its profits.  
    • Tying up with the global oil industry players will help the Reliance industry to boost its oil business.

    Threats

    • In recent times, Reliance Industries’ sales growth rate has declined. This could be taken as nothing more than a hiccup or the beginning of a trend.
    • High competition from big conglomerates such as Adani can reduce Reliance’s market share in some sectors.

    Key Performance Indicators

    ParticularsMarch 2024 March 2023 March 2022
    Operating Margin (%)14.1412.9413.65
    Net Profit Margin (%)8.728.439.65
    ROE (%)8.779.317.78
    ROCE (%)9.389.378.02
    Current Ratio1.181.071.12
    Debt to Equity Ratio0.410.440.34

    Future Outlook

    Reliance Industries is positioning itself as a leader in both traditional and emerging sectors, with a strong focus on sustainability. It is also ramping up its petrochemical and retail businesses with significant investments in digital platforms and 5G services. Reliance plans to establish a capacity of 100 GW of solar energy by 2030 and achieve net-zero carbon emissions by 2035, aligning with global sustainability goals. Moreover, the company plans to establish 100 Compressed Biogas (CBG) plants, which will consume 5.5 million tonnes of agricultural residue, reduce 2 million tonnes of carbon emission, and produce 2.5 million tonnes of organic manure annually. As India’s largest conglomerate, Reliance is well-positioned for long-term growth, driven by diversification and strong government support for clean energy.

    Conclusion

    There is no doubt that, at the moment, Reliance is the largest public company in India, with a strong brand image and brilliant marketing strategies. Reliance Industries is leading in various sectors like petroleum, oil, retail, and gas because of its product quality and efficiency. 

    Reliance Industries’ growth motto is “Growth is life”. Their marketing strategies, such as 360 branding and strategic partnerships, have contributed to their success. However, many segments operate in a competitive environment, which could dampen the revenue growth of the company in the long term. In summation, always do thorough research before investing in the company and consult your financial advisor.

    S.NO.Check Out These Interesting Posts You Might Enjoy!
    1TCS Case Study: Business Model, Financial Statement, SWOT Analysis
    2Vedanta Case Study: Business Model, Financial Statement, SWOT Analysis
    3Nestle India Case Study: Business Model, Financial Statement, SWOT Analysis
    4BPCL Case Study: Business Model, Product Portfolio and SWOT Analysis
    5Apollo Hospitals Case Study : Business Model, Financial Statements, And SWOT Analysis

    Frequently Asked Questions (FAQs)

    1. Who is the owner of Reliance Industries?

      Mr. Mukesh Ambani is the owner of Reliance Industries.

    2. What type of company is Reliance Industries?

      It is an Indian multinational conglomerate headquartered in Mumbai.

    3. What are the products of Reliance Industries?

      Reliance Industries has a long list of products ranging from textiles, petroleum, refining, telecommunications, groceries, and many more.

    4. When was the Reliance Industries founded?

      The company was founded in 1958.

    5. Which companies come under Reliance Industries?

      Reliance Retail, Jio, Reliance Fresh, Reliance Foundations, Reliance Trends, Reliance Digital, and many more.


  • Rashi Peripherals Limited: IPO Analysis

    Rashi Peripherals Limited: IPO Analysis

    The Indian tech giant Rashi Peripherals Limited (RPL) is all set to tap the public market with its much-anticipated INR 600 crore IPO! Are you excited to own a piece of this company in the Information and Communication Technology (ICT) distribution landscape?

    In today’s blog, we will share the key details about the IPO and a brief overview of the company. 

    Key details of the IPO

    1. Rashi Peripherals IPO is a book-built issue of INR 600 crores. The issue is completely fresh and will be opening for subscription from February 7, 2024, to February 9, 2024.
    2. Rashi Peripherals IPO is a main-board IPO, which means the post-issue capital is more than 10 crores.
    3. The price band of IPO is INR 295 to INR 311 per share.
    4. The listing date for Rashi Peripherals IPO is fixed at February 14, 2024.
    5. JM Financial Limited and ICICI Securities Limited are the book-running lead managers of the Rashi Peripherals IPO, whereas Link Intime India Private Ltd is the registrar for the issue.
    6. The fund’s return process is scheduled for Tuesday, February 13, 2024.
    7. The company will be listed on both the exchanges, i.e., NSE & BSE.
    8. The company promoters are as follows – Krishna Kumar Choudhary, Sureshkumar Pansari, Kapal Suresh Pansari, Keshav Krishna Kumar Choudhary, Chaman Pansari, Krishna Kumar Choudhary (HUF), and Suresh M Pansari HUF.
    9. Rashi Peripherals IPO’s objective is to raise capital from the market is to fund working capital requirements and prepayments and repayments of borrowings.
    Category of InvestorsAllocation of shares
    EmployeesNo employee quota
    Anchor AllocationCarved out of the QIB Portion
    QIB Shares Offered96,46,302 shares (50% of the net IPO offer size)
    NII (HNI) Shares Offered28,93,891 shares (15% of the net IPO offer size)
    Retail Shares Offered67,52,411 shares (35% of the net IPO offer size)
    Total Shares Offered1,92,92,604 shares (100.00% of IPO size)
    Source – RHP

    Read Also: IPO Alert – Capital Small Finance Bank

    Company Overview

    Company Overview

    Rashi Peripherals was incorporated in the year 1989 and carries experience of more than 33 years. The company took its time in rising to glory, and now it is one of the leading national distributors of global technology brands in India for Information and Communications Technology (ICT) products. It also offers end-to-end value-added services such as pre-sale activities, solutions design, technical support, marketing services, credit solutions, and warranty management services.

    The company also operates in Singapore. It has two subsidiaries – Znet Technologies Private Limited in India and Rashi Peripherals Pte Limited in Singapore.

    Business Model

    Rashi Peripherals operates in the following two business verticals:

    • PES (Personal Computing, Enterprise, and Cloud Solutions) – Under this vertical, the company distributes personal computing devices, enterprise solutions, embedded designs/ products, and cloud computing. These include Laptops, Desktops, Routers, and Switches.
    • LIT (Lifestyle and IT essentials)– LIT includes the distribution of products such as graphic cards, CPUs, motherboards, storage and memory devices, lifestyle peripherals, and accessories that include keyboards, mouse, web cameras, monitors, wearables, casting devices, fitness trackers and gaming accessories, power equipment such as UPS and inverters, and networking and mobility devices.

    Rashi Peripherals holds 50 branches that operate for sales and service centres, and 63 warehouses as of September 30, 2022. The company has a direct presence in 680 locations in India and 53 global technology brands, with 9,996 customers in FY23.

    Distribution Channel

    Rashi Peripherals has a vision of being a multi-channel pan-India distributor and leader with an emphasis on general trade, modern trade and e-commerce channels.

    • General trade includes hybrid resellers who sell to online marketplaces and retail channels, regional distributors, retailers, brand stores, original equipment manufacturers, etc., which are collectively known as ‘Channel Partners’.
    • Modern trade includes large-format retail, multi-format retail, and small-format retail chains.
    • E-commerce includes some of India’s leading online marketplaces.

    Over the years, Rashi Peripherals has consistently added new global technology brands to its portfolio and worked with them to distribute products across categories. Some of the top brands distributed by the company are: Asus, Fitbit, HP, Intel, Lenovo, LG, Philips, Samsung, Logitech, and Luminous.

    Key Strengths

    Strengths of Rashi Tech
    1. RPL ranks among the fastest-growing distribution partners in India’s ICT distribution market and offers a well-established channel across India.
    2. The Indian tech sector is expected to witness growth, which will eventually benefit the Rashi Peripherals distribution business.
    3. Return on Equity (RoE) stands at a comfortable 19.33%.  
    4. The industry is low capital-intensive, thus RPL does not manufacture any of its products, which indicates that the requirement to take further debt is substantially low.
    5. Repeat customers bring in almost 92% of revenue while maintaining a 6.3% growth in total customers. This indicates the company’s strong ability to retain and satisfy customers.
    6. The company has a high trade receivable turnover ratio, indicating that it is very efficient in collecting receivables from its clients.

    Weak Points

    1. The Information and Communication Technology (ICT) industry in India is highly competitive (Indian competitors include Savex Technologies Private Limited, Ingram Micro India Private Limited, and Redington (India) Limited). Both domestic and foreign players can significantly affect the top-line figures of the company.
    2. The company’s net profit margin stands at 1.3%, but the industry generates profit from volume rather than margins.
    3. The top 8 suppliers account for almost 83% of the total purchases. Any changes in the contracts with these suppliers could cause significant damage to the company’s financials as RPL does not manufacture any of its products.
    4. RPL’s Inventory turnover ratio decreased significantly in FY23, this may indicate the company’s inability to manage inventory well.

    Awards & Recognitions

    • Digital Terminal Most Preferred National Distributor 2023
    • VAR India VAD Award 2022
    • Samsung MSP Solutions Champion 2023
    • Digital Terminal Best ICT National Distributor in India 2023
    • LG Most Dynamic National Distributor in 2022
    • Intel Partner of the Year Award 2022,
    • HP Most Trusted and Preferred Distributor Award 2022
    • Samsung Top Distributor Partner in B2B Business in 2022

    Highlights of Financial Statements

    ParticularsFY 2023FY 2022
    Revenue/Total IncomeINR 9,469 croreINR 9,322 crore
    Profit-after-TaxINR 123.34 croreINR 182.51 crore
    Return on Equity Ratio19.33%37.56%
    Debt to Equity Ratio1.531.52
    Inventory Turnover Ratio6.629.93
    Trade Receivables Turnover Ratio9.349.58
    Trade Payables Turnover Ratio8.8310.52
    Debt Service Coverage Ratio (DSCR)0.20.26
    Source – RHP

    Read Also: IPO Alert: Entero Healthcare Solutions Limited (EHSL)

    We can say that the company experienced a minor growth in its revenue in FY 2023 as compared to the previous financial year. However, profit margins were decreased due to a larger decrease in profits.

    Conclusion

    To wrap it up, Rashi Peripherals Limited IPO is a mainboard and medium-risk investment. Although the company holds a strong track record and a wide network of distributors and operates in a competitive industry. It is suggested that investors carefully assess the risks and other factors before investing in the IPO.

    S.NO.Check Out These Interesting Posts You Might Enjoy!
    1IPO Alert: Vibhor Steel Tubes Limited
    2Platinum Industries IPO: Business Model, Key Details, KPIs, and SWOT Analysis
    3Mukka Protein IPO: Business Model, Key Details, Financial Statements, and SWOT Analysis
    4Bharat Highways InvIT IPO: Business Model, Financials, Key Details, and SWOT Analysis
    5Pune E-Stock Broking Limited IPO: Key Details, Business Model, Financials, Strengths, and Weaknesses

    Frequently Asked Questions (FAQs)

    1. What is the minimum investment amount in Rashi Peripherals IPO?

      The minimum lot size for the IPO is 48 shares, with an estimated cost of INR 14,928 at the lower end of the price band.

    2. What does Rashi Peripherals do?

      Rashi Peripherals is a large distributor of ICT products and offers several IT hardware and software solutions.

    3. Who are the book running lead managers for the IPO?

      J.M. Financials and ICICI Securities.

    4. What is the listing date?

      14th February, 2024.

    5. How can I apply for the IPO?

      You can apply for the IPO either through your broker or the ASBA facility available with the banks.

  • Flair Vs DOMS: Unveiling The Best In Stationery Industry

    Flair Vs DOMS: Unveiling The Best In Stationery Industry

    Standing in a stationary shop and wondering which pen to buy for your project or trying to choose which colour palette to choose to paint your canvas? We often end up in such situations, and do you know there are two listed companies in India operating in this industry?

    The two companies are Flair and DOMS. These two companies are household names in India, catering to the diverse needs of students, artists, and professionals. Let’s explore these two companies.

    Flair Writing Industries Limited

    The company was established in the year 1976. Flair is a prominent name in the world of writing instruments, specifically in India. It is headquartered in Mumbai and was founded by Mr Khubilal Jugraj Rathod with a range of metal pens.

    The company is committed to quality and innovation, consistently striving to develop new and improved writing devices. Flair’s pillar stones include commitment to Quality and innovation. It develops and manufactures a wide variety of products that are tailored to today’s continuously shifting market.

    Did you know?

    Pierre Cardin pens are the most widely used flair pens and a style statement with world-class quality.

    DOMS Industries Limited

    DOMS Industries is another major brand in the Indian market. The company was originally incorporated as ‘Writefine Products Private Limited’ and in October 2006, it was renamed to “DOMS Industries Private Limited”. It traces its lineage back to over 4 decades.

    The company has achieved significant growth and brand recognition since its establishment. It offers a wide range of products such as drawing materials, gifting items, pens, and geometrical instruments, paper materials, kits & combos, etc. The company has a strong distribution network in over 45 countries.

    Comparative Analysis

    comparative analysis

    Market Capitalisation (As of 2 February 2024)

    Flair – Flair is a small-cap company with a market cap of INR 3,419 crore.

    DOMS Industries – DOMS Industries is also a small-cap company with a market cap of INR 8,615 crore.

    Share Price (As of 2 February 2024)

    Flair – INR 324

    DOMS Industries – INR1420

    Product Portfolio

    Flair provides a diverse range of writing products such as pens, pencils, crayons, etc. and stationery products, such as notebooks, diaries, calculators, etc. The products are generally affordable, high-quality, and are meant for everyday use. Flair’s recent developments in premium collections are noteworthy.

    On the other hand, DOMS Industries boasts a wider variety of scholastic stationery and art materials such as paints, canvas, brushes, and even office supplies. The company caters to both basic and professional artistic needs. The company’s collaboration with Milan-listed FILA has helped them emphasize producing quality materials to fulfil the evolving customer needs.

    Quick look at IPOs

    Before delving into the financials, it is important to learn that both DOMS and Flair made waves in the Indian IPO market in late 2023 to offer investors a chance to tap into the booming stationery market of the economy. Let’s have a head-to-head analysis of their IPOs:

    Listing Date

    Flair – December 1, 2023

    DOMS Industries – December 20, 2023

    IPO Price

    Flair – INR 304

    DOMS Industries – INR 790

    DOMS Industries raised a total of INR 1,200 crore. The issue was a combination of a fresh issue of INR 450 crore and an Offer for sale (OFS) of INR 750 crore. The final issue price was INR 790 per share. Its main objective was to utilise the proceeds from IPO to expand its manufacturing capacity for a wide range of writing instruments, and markers to strengthen its brand presence in the Indian market. It was listed at INR 1,400 per share on the Indian Stock Exchanges which is 77.2% higher than the issue price.

    Flair raised INR 593 crore through a fresh issue of INR 365 crore and an Offer for sale of INR 228 crore. The company plans to invest this capital in a new manufacturing facility for writing instruments in Gujarat with a major focus on international expansion. The final issue price was fixed at INR 304 per share and was listed at 503 which is 65% above the IPO price of INR 304.

    We can say that both DOMS Industries and Flair IPOs offered unique opportunities for investors, and the long-term success will depend on the company’s ability to execute its growth strategies.

    Financial Statement Analysis

    Financial statement analysis

    Let’s have look at the financial numbers of both the companies (As of March 2023):

    MetricsDOMS Industries (in INR crores)Flair (in INR crores)
    Revenue1,086917
    Net Profit 88111
    Fixed Assets309201
    Current Liabilities204155
    Investments47522
    Loans & Advances1,348158

    Takeaways from the above table are as follows:

    • DOMS Industries generally possesses higher revenue and wider market penetration.
    • Flair has narrow profit margins because their focus is on affordable pens and competitive pricing and dependence on sales volume.
    • Additionally, DOMS has a higher inventory turnover ratio because of its global presence as compared to Flairs which showcases strong sales.

    For your knowledge, the inventory turnover ratio (Higher the better) depicts how often a company sells or replaces its inventory over a given period.

    Read Also: What is IEPF? Introduction, Reasons for Transfer, and Process of Claiming Explained

    Conclusion

    Both companies, i.e., Flair Writing Industries Limited and DOMS Industries Limited are excellent choices for stationery and writing needs in India, with their own set of strengths as well as target consumers. Opting between the two completely depends on individual preferences and choices.

    Keep in mind that both companies operate in a dynamic market with several influencing factors. Do proper research and seek professional advice to guide you to your perfect stationery match.

    S.NO.Check Out These Interesting Posts You Might Enjoy!
    1TCS vs Wipro
    2XIRR Vs CAGR
    3Apollo Hospitals vs Fortis Healthcare:
    4MRF vs Apollo Tyres
    5ITC vs HUL

    Frequently Asked Questions (FAQs)

    1. Which company offers a wider range of products?

      DOMS takes the crown here since the company offers products such as art materials and craft supplies that are far beyond writing.

    2. Which brand is more affordable?

      Flair is more affordable than DOMS with competitive pricing across their product range.

    3. Who is the market leader in the game of pens?

      Of course, Flair! Flair was established in the year 1976 and has maintained its legacy in the pen market since then. You must have used the Flair pen in your school / college.

    4. Which company cares more about the planet and gives back to society?

      DOMS Industries focuses more on sustainability and tries to implement eco-friendly practices while manufacturing products.

    5. Which company is leading innovation in stationery-related items?

      DOMS Industries emphasises on quality and premium products whereas Flair prioritizes smooth writing and comfortable grip.

  • Havells Case Study: Business Model and SWOT Analysis

    Havells Case Study: Business Model and SWOT Analysis

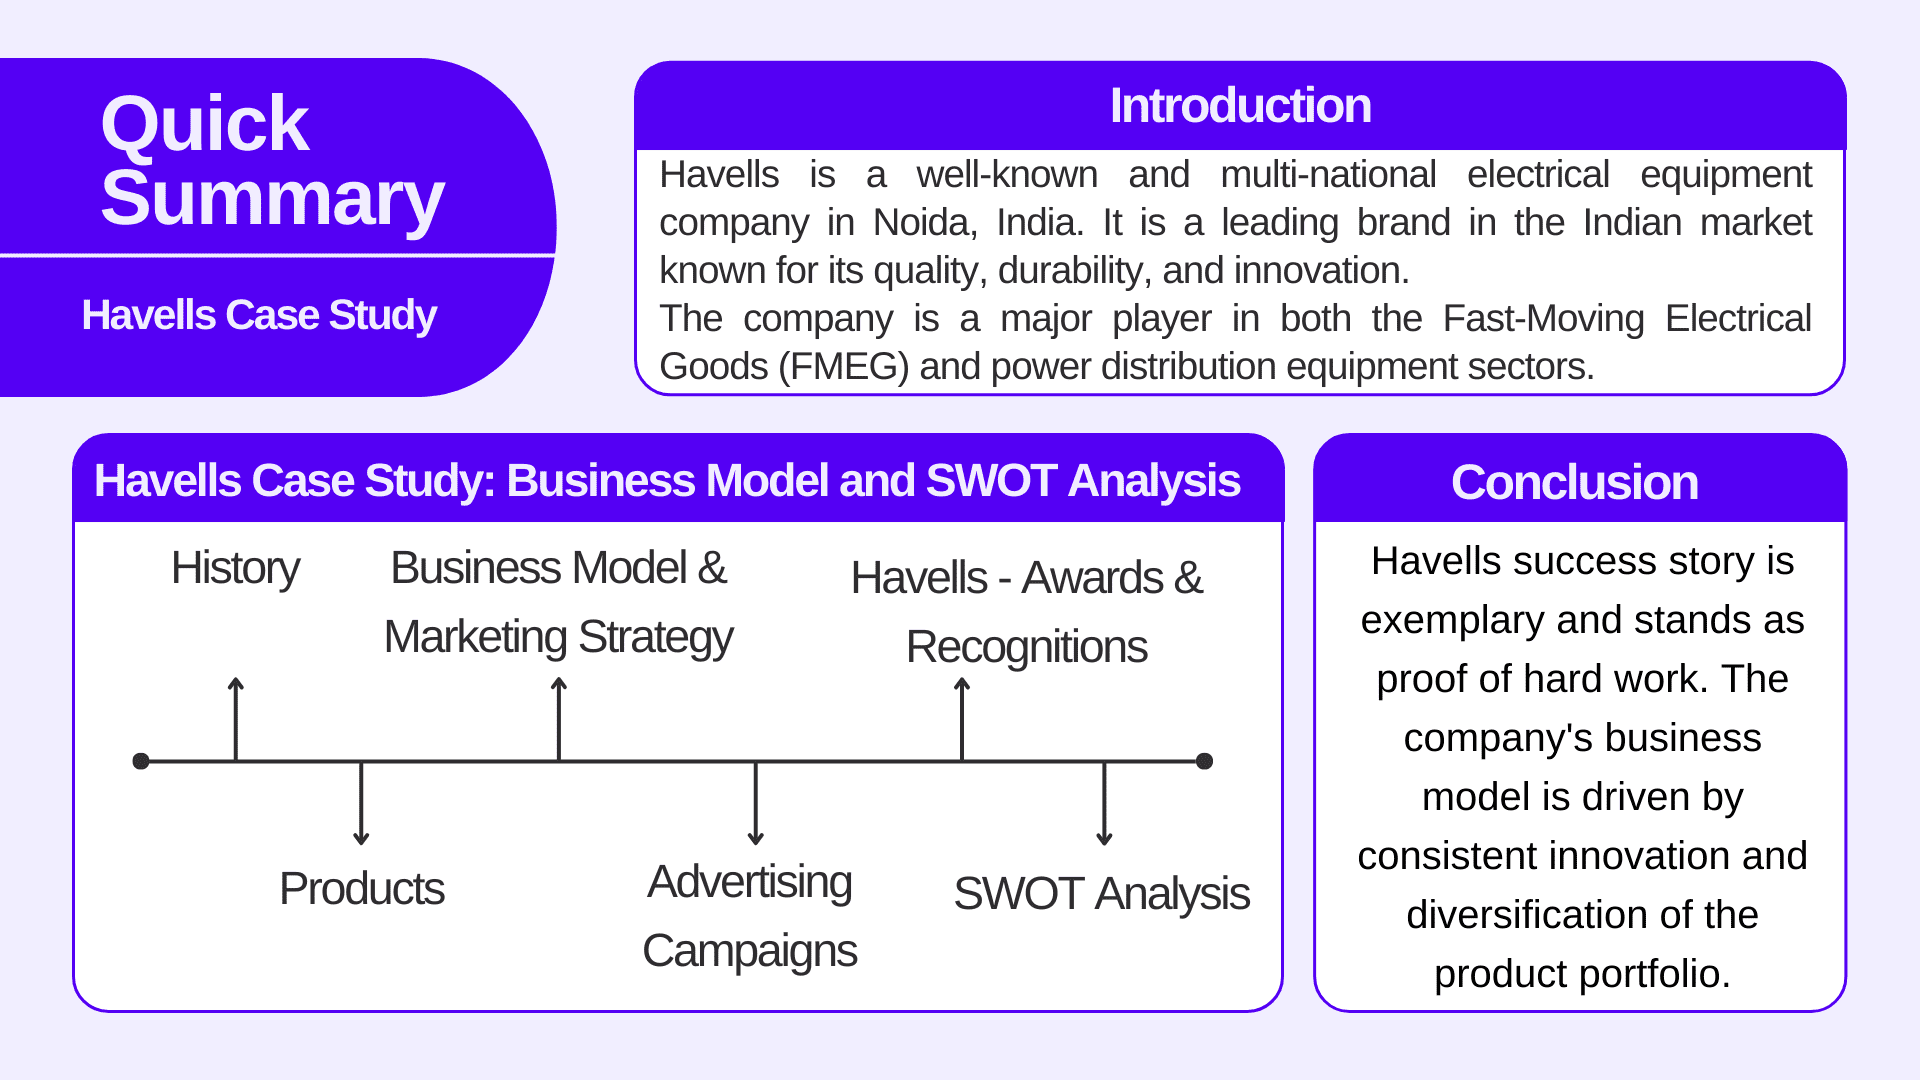
    Havells is a well-known and multi-national electrical equipment company in Noida, India. It is a leading brand in the Indian market known for its quality, durability, and innovation.

    The company is a major player in both the Fast-Moving Electrical Goods (FMEG) and power distribution equipment sectors. Havells’s product portfolio is enormous and fulfils the requirements across residential, commercial, and industrial sectors. Currently, it employs almost 6,822 people and has 15 manufacturing units. It was listed on stock exchanges in the year 2001, and since then it has shown persistent growth in its share price. Its share is currently traded at a price of INR 1,620.

    Havells Case Study

    History of Havells

    Havells holds a rich history. In 1958, seeds of Havells were sown when Haveli Ram Gandhi set up a small electrical trading shop in Delhi. In the year 1971, Qimat Rai Gupta, a distributor of Mr. Gandhi, acquired the company from Haveli Ram and renamed it Havells India Limited. Gupta’s main -focus was on manufacturing rewirable switches and changeover switches. In the 1990s, Havells embarked on a series of strategic acquisitions and expanded its market reach.

    Some of the major acquisitions of Havells are as follows:

    • Year 1994 – ECS – A prominent switchgear manufacturer.
    • Year 1999 – Standard Electricals – A famous brand for industrial switchgear and motors.
    • Year 2001 – Crabtree India – A premium brand for electrical accessories.

    Products of Havells

    Brands of Havells include Lloyd, Crabtree, Standard, Reo, and Havells Studio.

    The product portfolio of Havells is as follows.

    1. Switchgear – Domestic Switchgears, Capacitors, Switches, Industrial Switchgears.
    2. Cables – Power Cables, Flexible Cables.
    3. Lighting and Fixtures – Professional Luminaires, Consumer Luminaires.
    4. Electrical Consumer Durables – Fans, Appliances, Water Heaters.
    5. Others – Motors, Solar, Pump, Water Purifiers, and Personal Grooming Products.
    6. Lloyd Consumer – Air Conditioners, Televisions, Washing Machines, Refrigerators.

    Business Model & Marketing Strategy of Havells

    Marketing strategy of Havells

    Havells emphasises research and development for producing and developing safer, smarter, and sustainable products and understands the needs of the consumers. It has built a long-term strategic relationship with the suppliers and focuses on assuring high-quality and efficient product development, which is supported by vertically and horizontally integrated manufacturing along with the in-house operations.

    The company adopted an omni-channel distribution strategy that is supported by modern technology. The company ensures fast delivery of goods and services through its strong distribution network.

    Havells holds a robust global presence and maintains brand attraction through national advertising, celebrity engagement, digital campaigns, in-shop advertising, etc. Moreover, it provides its customers with after-sales services to maintain long and healthy relationships.

    We can say that the company’s major focus is on innovation, digitisation, and talent. It commits to ethical practices, thereby building brand loyalty and positive community relations. Havells has built a resilient and adaptable business model that allows them to navigate market fluctuations and stay at the forefront of the electrical and home appliance industry.

    Read Also: Eicher Motors Case Study: Business Model & SWOT Analysis

    Advertising Campaigns of Havells

    1. Havells had an ad campaign known as “Hawa Badlegi” that has been used for several years. This campaign tackled various social issues, such as gender equality, environmental awareness, etc., with its emotional stories.
    2. #SwitchToHavells was an interactive social media campaign to encourage users to switch from their electrical products to Havells.
    3. ‘Havells ka Devas’ campaign was launched, turning 100 Havells fans into a Ganesh idol on a billboard to celebrate the festive spirit.
    4. Some of the famous TV commercials of Havells include #ZindagiKiSharing with Havells Smart Home Appliances, Havells Lighting #HarLightMeinDelight, Havells Water Purifiers (Sahi Paani Ka Sign Havells Alkaline).
    5. Havells’s advertisement campaign – ‘Let’s End Darkness’, was launched with several known faces and highlighted the idea of efficient lighting solutions for homes and offices to dismiss physical darkness.

    Havells – Awards & Recognitions

    Year 2022

    • Golden Pin Product Design Award for Freedom Architectural Light.
    • CII Design Excellence Award for Lloyd Elante Washing Machine.
    • Design Wall Awards, Platinum Winner, Delhi.
    • DIA Design Intelligence Award for Vogue Highbay.

    Year 2021

    • India Design Mark 2021 for Silencio Mixer Grinder.
    • India Design Mark 2021 for Puro Storage Electric Water Heater.
    • CII Design Excellence Award 2021 for Freedom Adaptable Architectural Light.
    • Good Design Japan 2021 for Nu Bulb and Lamb.
    • ICSI CSR Excellence Awards FY 2021-2022.

    SWOT Analysis of Havells

    The Havells SWOT Analysis highlights its strengths, weaknesses, opportunities, and threats, showcasing its market position and growth potential.

    SWOT analysis of Havells

    Strengths

    1. Havells offers a wide range of products that includes home appliances, commercial, and kitchen appliances keeping in mind the consumer’s needs and preferences.
    2. Havells has built a strong brand image over the years and is known for quality and reliability in the electronics industry.
    3. Havells’s major focus on innovation accounts for one of the key strengths.
    4. Havells is a global company with a presence in more than 50 countries operating internationally. This provides the company with a diversified revenue stream.
    5. Havells holds a strong distribution network and reaches more than 14,000 dealers in India ensuring market penetration.
    6. Balancing a strong brick-and-mortar network with an omnichannel distribution strategy for easy consumer access.

    Weakness

    1. Havells’s high debt-to-equity ratio at 2.44 as of December 2023 is a point of concern about the company’s financial stability.
    2. Increasing competition from other FMEG companies creates pressure on Havells and can impact the market share and performance.
    3. Havells is highly dependent on the Indian market and generates over 70% of revenue, making it vulnerable to economic fluctuations.
    4. Havells has seen a decline in profit margins, revenue, and total assets in the recent annual reports, causing market concerns.

    Opportunities

    The increasing demand for infrastructure in India can pose an opportunity for Havells to supply electrical and power distribution equipment in the country.

    1. Havells can enter and explore new markets in Asia, Africa, and Latin America for better opportunities.
    2. Development of E-commerce platforms to tap the untouched segment of the market.
    3. Developing and promoting eco-friendly products so that environmental concerns can be addressed will be a great opportunity for Havells to build a brand image.
    4. Havells can also capitalise on India’s ongoing rural electrification drive to target rural customers and increase its product reach.

    Threats

    1. Increasing the cost of raw materials such as copper and aluminium can greatly affect production costs and profit margins.
    2. Innovations from competitors can threaten the existing market share and customer base.
    3. Other local brands offering cheaper electrical products, especially in rural areas can be a challenge for Havells.
    4. Changing government policies and regulations related to energy efficiency or foreign trade can impact the business operations of Havells.

    Read Also: BSE Case Study: Business Model And SWOT Analysis

    Conclusion

    Havells success story is exemplary and stands as proof of hard work. The company’s business model is driven by consistent innovation and diversification of the product portfolio. Havells has a wide distribution network to reach various segments of the company. However, a high debt-to-equity ratio and dependence on the Indian market for revenue can be a matter of concern. Careful financial management can help the company mitigate risks and achieve long-term stability.

    S.NO.Check Out These Interesting Posts You Might Enjoy!
    1ICICI Bank Case Study: Financials, KPIs, Growth Strategies, and SWOT Analysis
    2Vedanta Case Study: Business Model, Financial Statement, SWOT Analysis
    3Nestle India Case Study: Business Model, Financial Statement, SWOT Analysis
    4BPCL Case Study: Business Model, Product Portfolio and SWOT Analysis
    5Apollo Hospitals Case Study : Business Model, Financial Statements, And SWOT Analysis

    Frequently Asked Questions (FAQs)

    1. Who was the founder of Havells?

      Qimat Rai Gupta.

    2. Is Havells a listed Company?

      Yes, the company launched its IPO in 2001.

    3. In which year Havells acquired Crabtree?

      Crabtree was acquired by Havells in the year 2001.

    4. What are the brands of Havells?

      Lloyd, Crabtree, Standard, Reo, Havells Studio.

    5. What is the full form of FMEG?

      FMEG stands for Fast-Moving Electrical Goods.

  • Tata Motors vs Maruti Suzuki? Analysis of Auto Stocks

    Tata Motors vs Maruti Suzuki? Analysis of Auto Stocks

    Passionate about cars and dreaming of buying a new one but cannot afford it for considerable reasons? No worries, you can still invest in auto stocks. In this blog, we will explore the two well-recognised auto stocks: Tata Motors and Maruti Suzuki.

    Tata Motors

    Tata Motors is India’s largest automobile company and is a leading global manufacturer of cars, utility vehicles, buses, trucks, and defence vehicles. It was incorporated in the year 1945 and was a part of the Tata Group which was founded by Jamshedji Tata in the year 1868.

    Some of the world’s most iconic brands, including Jaguar Land Rover in the UK and Tata Daewoo in South Korea, are part of the automotive operations of the group.

    The company is committed to developing innovative and sustainable vehicles for the future of mobility. By operating on a philosophy of ‘giving back to society’.

    Maruti Suzuki

    It is a well-known company in India and has an intriguing history with the evolution of the Indian Automotive industry. In 1981, the Indian Government established Maruti Udyog Limited which was a joint venture with Suzuki Motor Corporation of Japan.

    Maruti Suzuki India Limited is a subsidiary company of Suzuki Motor Corporation, Japan that currently holds almost 58% of the equity of the company. It is one of the largest car makers. The company manufactures and sells passenger vehicles in India and is also the largest exporter of passenger vehicles in India.

    The company believes in value creation and connects well with the customers to understand their needs.

    Maruti Suzuki vs. Tata Motors – A Comparative Analysis

    comparative analysis

    Both Maruti Suzuki and Tata Motors are leading automobile companies catering to the needs of different segments.

    Maruti Suzuki holds a dominant position in the market with a significant market share in the passenger segment. In contrast, Tata Motors has a smaller share but is a leader in the commercial segment.

    Market Capitalisation (As of 30 Jan 2024)

    • Tata Motors – ₹3,15,751 Crore
    • Maruti Suzuki – ₹3,12,817 Crore

    Share Price (As of 30 Jan 2024)

    Below is the Tata motors vs Maruti Suzuki Share price

    • Tata Motors – INR 859
    • Maruti Suzuki – INR 9,952

    Maruti Suzuki has higher profitability and market capitalisation, whereas Tata Motors is facing challenges in the passenger vehicle segment but is profitable in the commercial segment.

    Product Portfolio

    • Tata Motors – Tata Motors offers SUVs like Nexon, Harrier, and Safari. Sedans like Tiago, Altroz, etc.
    • Maruti Suzuki – The company offers fuel-efficient, affordable, compact Hatchbacks and Sedans such as Wagon R, Baleno, Dzire, Alto 800, Swift, etc.
    trends

    The automotive industry in India is currently seeing a rapid transformation, driven by several key trends. Some of the ongoing trends are listed below.

    1. Electrification

    Electrification is undoubtedly the most important trend since the adoption of electric vehicles is consistently increasing due to concerns about climate change and government policies. Experts and industry analysts predict this growth will continue in the coming years.

    2. Autonomous Driving

    The development of self-driving cars is another major trend. While fully autonomous vehicles are still some years away, at-least in India, advancements in sensor technology and artificial intelligence are progressing each day, which could lead to significant changes in car usage.

    3. Connectivity

    Cars are becoming more connected and advanced with features like real-time traffic updates, in-vehicle infotainment systems, etc. This trend is being driven by the Internet of Things (IoT) and 5G networks, allowing cars to communicate with each other.

    4. Shared Mobility

    The rise of ride-sharing services is creating a change in the way people think about car ownership. The car-sharing services are more reasonable, affordable, and convenient alternatives as compared to owning a car. This trend is likely to grow as technology evolves.

    5. Sustainability

    The auto industry is also focusing on providing consumers with more sustainable vehicles by using recycled materials, and reduced emissions in the manufacturing process. This will eventually improve the fuel efficiency.

    Financial Analysis – Tata Motors vs. Maruti Suzuki

    Have a look at the table with an in-depth analysis of the recent financial statements of both the companies:

    MetricsTata Motors (in crores)Maruti Suzuki (in crores)
    Net ProfitINR 3,783INR 3,706
    RevenueINR 106,758INR 37,902
    Total AssetsINR 336,081INR 84,596
    Current LiabilitiesINR 155,027INR 20,107
    Debt-to-equity Ratio2.770.02
    PE Ratio66.9030.51

    From the above table, we can see that:

    • Tata Motors leads with comparatively higher revenue and high net profits.
    • Maruti Suzuki, on the other hand, has a much lower debt-to-equity ratio, which implies a stronger and stable financial position.
    • Both the stocks have relatively high P/E ratios, which reflects the investors’ expectation of future growth.

    Impact of Market Conditions on Auto Stocks

    1. During economic expansion or boom, consumer confidence rises and so does their income, leading to a boost in car sales and stock prices.
    2. Lower interest rates can make car loans affordable, which in turn will stimulate the demand for auto sales. Conversely, higher interest rates can reduce borrowing and dampen sales, affecting the stock price negatively. 
    3. Fluctuations in fuel prices can have a significant impact on consumer car-buying decisions. Rising fuel prices will boost the sales of fuel-efficient cars.
    4. An upgrade in the technology like the development of electric vehicles can create new opportunities for the auto sector and enhance their stock prices.

    Read Also: Mahindra & Mahindra vs Tata Motors: Which is Better?

    Conclusion

    Ultimately, choosing between Tata Motors and Maruti Suzuki depends on your investment goals and risk appetite. Risk-averse investors can avoid auto stocks because of their unpredictability in revenue. Keep in mind to do thorough research before making any kind of investment decision and find which stocks best align with your investment needs.

    Additionally, remember that auto companies operate in a cyclical industry, which means economic growth can significantly influence their sales volume.

    S.NO.Check Out These Interesting Posts You Might Enjoy!
    1Tata Power Vs Adani Power
    2Tata Motors vs Maruti Suzuki
    3Tata Steel vs. JSW Steel
    4TCS vs Wipro
    5IndiGo vs SpiceJet

    Frequently Answered Questions (FAQs)

    1. Which brand saves you more at the pump?

      Maruti Suzuki is well-known for its fuel-efficient engines.

    2. Who zooms ahead in the race for Electric Vehicles?

      Both the auto stocks are actively investing and focusing on EVs and analysing the future growth of this segment.

    3. Is the auto industry a cyclical industry?

      Yes, the auto industry is cyclical as sales can be significantly influenced by economic growth.

    4. Are there any other Indian automakers to consider?

      There are several other stocks, such as Hero Moto Corp, Mahindra & Mahindra, Eicher Motors, Bajaj Auto, TVS Motors, Ola, etc.

    5. What are the biggest challenges faced by the auto sector?

      Some of the biggest challenges the auto sector faces are rising input costs, global shortage of semiconductors, shifts in consumer preferences, etc. 

  • HDFC vs SBI? Comparative Analysis Of Banking Stocks

    HDFC vs SBI? Comparative Analysis Of Banking Stocks

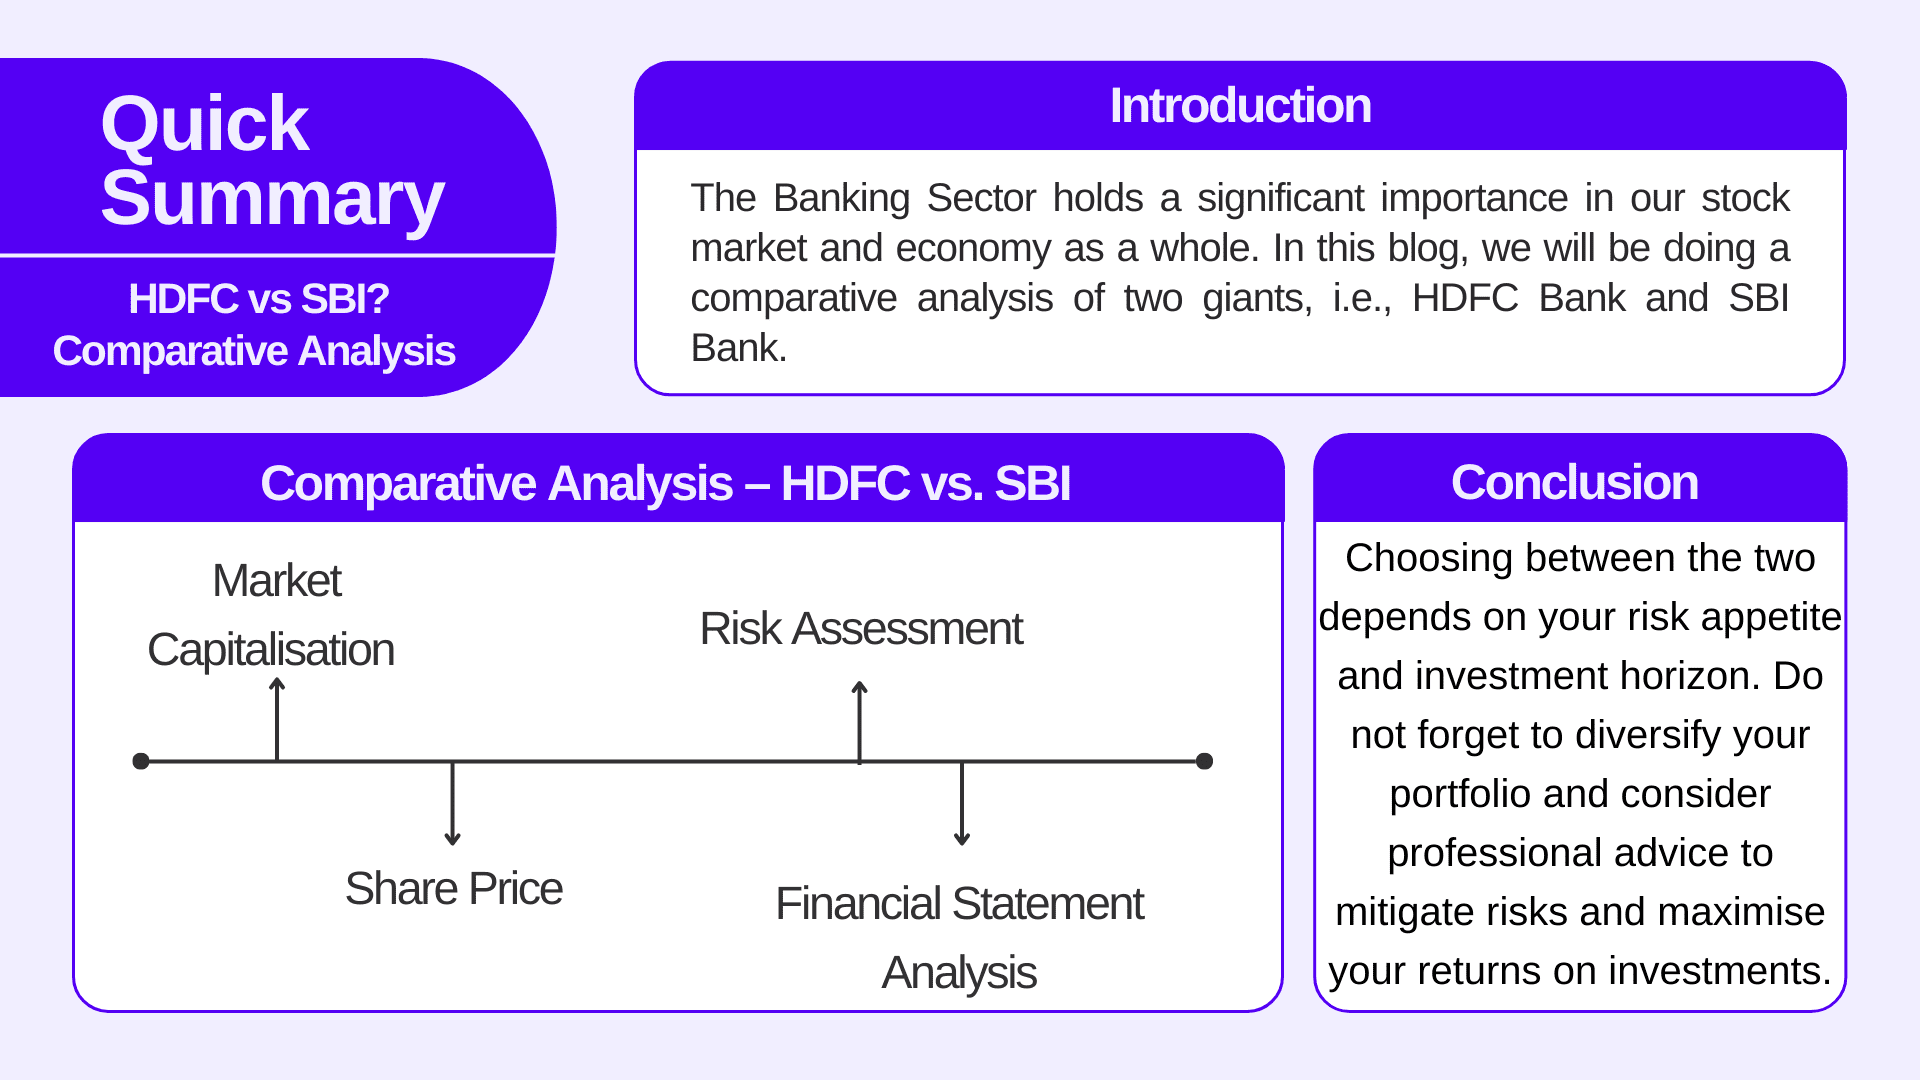
    The Banking Sector holds a significant importance in our stock market and economy as a whole. In this blog, we will be doing a comparative analysis of two giants, i.e., HDFC Bank and SBI Bank.

    HDFC vs SBI Comparative Analysis Of Banking Stocks

    HDFC Bank

    HDFC Bank (Housing Development Finance Corporation ) is a leading private sector bank and was incorporated in August 1994 by HT Parekh. It started its operations as a scheduled commercial bank in January 1995.

    The bank provides a wide range of financial products and services, such as retail banking, wholesale banking etc. and offers services like loans, credit cards, savings accounts, current accounts, investment products, etc.

    As of December 2023, the Bank held 8,086 branches and 20,668 ATMs across 3,836 cities with its headquarters in Mumbai. HDFC Bank has branches in four countries and three representative offices in Dubai, London & Singapore that offer home loan products to NRI citizens and persons of Indian origin. HDFC Bank is listed on the BSE and NSE with the symbol HDFCBANK.

    The Bank’s philosophy is based on five core values: Operational Excellence, Customer Focus, Product Leadership, People, and Sustainability.

    Read Also: HDFC Bank vs Axis Bank

    State Bank of India

    SBI is the largest public sector bank in India and is a titan in the Indian banking landscape with a 1/4th share in the market. SBI is headquartered in Mumbai and holds a rich heritage of over 200 years.

    The roots of SBI trace back to 1806 with the establishment of the Bank of Calcutta, the first joint stock bank in British India. Three separate presidency banks – Bank of Bengal, Bank of Bombay, and Bank of Madras emerged across British India. In the year 1921, the three presidential banks merged to form the Imperial Bank of India.

    In the year 1955, the government of India nationalised the Imperial Bank of India and renamed it as State Bank of India. SBI later acquired various state-associated banks and commercial banks.

    SBI has played an important role in bringing banking services to rural areas. Currently, SBI holds a strong distribution network of 22,405 branches and 65,627 ATMs.

    Read Also: SBI vs ICICI Bank

    Comparative Analysis – HDFC vs. SBI

    Dive into the ultimate SBI and HDFC comparison to explore their market strengths, financial ratios, and growth strategies, helping you make an informed choice between India’s top banking giants.

    HDFC vs SBI

    Choosing between HDFC Bank and SBI Bank is a tough task since both are the leading Indian banks, and each has its strengths. The points mentioned below will give you an overview of them (As of 29 Jan 2024):

    Market Capitalisation

    HDFC Bank – INR 11,04,388 crore

    SBI – INR 5,55,823 crore

    According to the data by NSE, the weightage of HDFC bank is comparatively more than SBI Bank in indices such as NIFTY and NIFTY Bank.

    Share Price

    HDFC Bank – INR 1455

    SBI – INR 623

    Both banks have their separate growth strategies, but HDFC Bank’s focus on digital adoption might give them an edge in the long run.

    Risk Assessment

    Analysing key financial ratios can provide valuable insights into the relative risk profiles of HDFC and SBI Bank. Let’s have a glimpse at how the ratios of both banks look like:

    RatioHDFC SBI
    Net Interest Margin (NIM)3.65%2.38%
    Debt-to-Equity Ratio16.79%13.01%
    Non-Performing Assets (NPA)0.76%2.78%
    Return on Equity (ROE)15.17%5.03%
    Returns on Capital Employed (ROCE)3.10%1.74%
    PE Ratio19.48x8.40x
    As of September 2023

    For your reference, the ratios given in the table are explained below:

    • Net Interest Margin (NIM) – NIM is an important metric for banks since it drives profitability. A higher NIM depicts that a bank can generate more revenue from lending than paying out interest on borrowings. We can say that a high NIM is a sign of a profitable bank.
    • Debt-to-Equity Ratio – D/E ratio measures how much debt a company is using to finance its assets. A high D/E ratio shows that the company’s major funding comes from debt.
    • Non-Performing Asset (NPA) – NPA is defined as loans and advances on which interest or principal payment is overdue. Low NPAs show effective credit risk management.
    • Return on Equity (ROE) – ROE measures the profitability of the company generated from the shareholder’s equity.
    • Returns on Capital Employed (ROCE) – ROCE measures the profitability of the company from total capital (equity and debt) employed by the company.
    • PE Ratio – The PE ratio measures the price paid by the investor relative to per share of earnings.

    From the above ratios, we can interpret that:

    • HDFC Bank shows an overall lower risk profile when compared to SBI. On the other hand, SBI benefits from lower leverage and is trading at a cheaper price than HDFC Bank.
    • SBI vs HDFC profit comparison reveals that both banks have shown robust growth, but their strategies and performance metrics differ significantly.
    • Further, HDFC Bank has lower NPAs, which showcases better asset quality and lower credit risk compared to SBI.
    • SBI displays a lower reliance on debt. However, HDFC Bank has delivered significantly higher returns on equity that reflect investor’s interest and value creation.

    Financial Statement Analysis

    FSA

    Below mentioned points below will help you with an in-depth analysis of the financial statements of both banks:

    1. Net Profit – HDFC Bank holds an edge with a higher net profit of INR 17,718 crore, whereas SBI’s net profit stood at 16,383 crore.
    2. Revenue – Both the stocks have shown robust growth with HDFC Bank’s revenue standing at INR 115,015 crores, whereas SBI’s revenue stood at INR 144,256 crores.
    3. Total Assets – SBI possesses total assets of INR 5,954,418 crore whereas HDFC Bank INR 2,530,432 crore.
    4. Total Liabilities – SBI exhibits a slightly higher level of borrowings, i.e., INR 5,954,418 crores, compared to HDFC Bank 2,530,432. This could be due to SBI’s broader operations.
    5. Investments – SBI holds a larger proportion of investments with INR 1,913,107 crore as compared to HDFC Bank’s investment of INR 511,581 crores.
    6. Loans and Advances – Both the banks allocate a significant portion of their total assets to loans, with HDFC Bank having a bit less concentration at INR 1,661,949 crores as compared to SBI Bank, which stood at INR 3,267,902 crores.

    *All the figures mentioned above are as of the September 2023 quarter.

    Read Also: Blinkit vs Zepto: Which is Better?

    Conclusion

    Predicting the long-term outlook for any company is inherently a tough task and is uncertain because the long-term perspective is subject to change based on unforeseen factors. However, both banks will benefit from the projected growth of the economy, and since SBI is a public sector bank, it is likely that it may benefit from government initiatives focused on financial inclusion and infrastructure development. Not only this, but also both banks need to manage credit risk and NPAs effectively to ensure sustainable growth.

    Last but not least, choosing between the two depends on your risk appetite and investment horizon. Do not forget to diversify your portfolio and consider professional advice to mitigate risks and maximise your returns on investments.

    S.NO.Check Out These Interesting Posts You Might Enjoy!
    1ICICI Vs HDFC Bank
    2Axis Bank vs ICICI Bank
    3PNB vs SBI
    4Bank of Baroda vs SBI
    5PNB vs Bank of Baroda

    Frequently Asked Questions (FAQs)

    1. When was HDFC Bank founded?

      HDFC Bank was founded in August 1994.

    2. When was SBI founded?

      SBI was founded in the year 1921.

    3. Who was the founder of HDFC?

      HT Parekh

    4. Which bank has lower NPAs?

      HDFC Bank.

    5. What was SBI called earlier?

      Imperial Bank of India

  • Paytm Case Study: Business Model and Marketing Strategy

    Paytm Case Study: Business Model and Marketing Strategy

    Paytm logo

    One97 Communications Limited is an Indian multinational technology company started in the year 2000 by Vijay Shekhar Sharma. Paytm, a subsidiary of One97, is an Indian financial services and digital payments company founded in the year 2010.

    This case study of Paytm highlights its evolution from a prepaid mobile and DTH recharge platform to a mainstream player with the launch of wallet services in 2014, marking a key moment in enabling cashless transactions for users.”

    Paytm-Case-Study

    Today, Paytm stands as a one-stop-shop for consumers, offering a plethora of financial and other services that include e-commerce, banking, investments, loans, bus tickets, money transfers, etc.

    The business model of Paytm has driven its total revenue growth from ₹2,802 Cr in FY 2021 to ₹7,990 Cr in FY 2023, achieving a CAGR of 69%.

    In 2017, Paytm piloted bill payment services in Canada and in the year 2018, Paytm partnered with Softbank and Yahoo Japan Corporation to launch PayPay, a leading digital payments and financial services company in Japan.

    Paytm went public with its IPO on NSE & BSE in November 2021 and raised INR 18,300 crs via IPO. The IPO was one of the largest in India, although Paytm’s debut in the stock market faced mixed reactions.

    As of September 2023, there is no identifiable Promoter of Paytm. Have a look at the shareholding pattern of Paytm:

    Shareholding pattern of paytm

    Products and Services of Paytm

    Paytm offers a variety of products and services, such as payment services, financial services, cloud, etc.

    Payment Services

    Payment Services are meant for both consumers and merchants and enable them to make and receive payments seamlessly both online and in-store. Paytm has an overall market share of 40% in payment transactions. Paytm also launched the Paytm Wallet in 2014 and QR code services in 2015. QR Code was later upgraded to an All-in-One QR code in 2020 so that consumers and merchants can have a seamless payment experience while accepting payments from third-party UPI platforms.

    Further, in 2020, Paytm launched soundbox service that gives real-time payment audio confirmation for payment completion. With Paytm’s payment services, consumers can make online bill payments, recharge, and transfer money through the app.

    Commerce & Cloud Services

    Paytm allow consumers to avail of lifestyle commerce services that include booking online tickets, entertainment, gaming, and food delivery within the Paytm app. Merchants can also connect with consumers to improve their business operations. Paytm provides merchants with services such as billing, ledger, vendor management, inventory management, catalogues, etc.

    Paytm also provides software and cloud services to enterprises, telecom companies, digital and fintech platforms.

    Financial Services

    Paytm provide the following financial services to consumers and merchants:

    Mobile Banking Services – Paytm provides mobile banking services through Paytm Payments Bank that includes digital banking products such as current accounts, savings accounts, salary accounts, fixed deposit accounts, and debit cards for individuals, SMEs and corporates.

    Lending – Paytm collaborates with financial institutions to improve distribution, underwriting and collections and provide seamless access to loans to consumers and merchants. Paytm also launched the Paytm Postpaid, which is a buy now pay later (BNPL) product.

    Insurance and Attachment Products – Paytm in collaboration with its insurance partners, provides attachment products like movie and travel ticket cancellations protection. Paytm’s subsidiary company, Paytm Insurance Broking Private Limited provides insurance services that include auto insurance, life insurance and health insurance.

    Wealth Management – Paytm provides wealth management services to consumers through the Paytm app and Paytm Money App. It also launched Paytm Gold, which allows customers to buy digital gold on their platform. Paytm Money app offers investment in mutual funds, equities, and derivatives trading.

    Read Also: What exactly happened to Paytm Payments Bank & why has the RBI banned it?

    Awards & Recognitions of Paytm

    Awards and Recognitions

    Paytm has received multiple awards and recognitions. Some of the major recognitions are:

    • BrandWagon Ace Award for best social media campaign in 2020.
    • ET BFSI Excellence Award for Best Digital Bank of the Year in 2020.
    • India Digital Award by IAMAI for Best Fintech Growth Story and Best Data-Driven Marketing Strategy in 2021.
    • FinTech India Innovation Awards 2023 for Best Fintech Company of the Year in 2022.
    • 8th CFO Vision and Innovation Summit & Awards 2023 for Best Fintech Company of the Year.
    • Quantic 4th Annual BFSI Excellence Awards 2023 for best Wealth Management Company of India.

    Advertising Campaigns

    1. “Kar De Paytm” in the year 2010.
    2. “Zindagi jeene ka naya tarika shuru karo – Paytm Karo” in the year 2015.
    3. “ATM nahi, Paytm Karo” in the year 2016.
    4. “Dimag Khul ke Jee” in the year 2017.
    5. “India Kahe Paytm Karo” in the year 2022.

    Competitive Advantages of Paytm

    1. Paytm was an early entrant into the digital payments landscape and had a first-mover advantage.
    2. Paytm has a wide market of payment services across India with a brand value of US $6.3 billion.
    3. Paytm builds and innovates its technology which helps it to launch products and services rapidly with a high success rate. Paytm has a technology team of over 2,500 members that continuously works to improve the user experience.
    4. Paytm tries to understand the needs of its users and innovates products accordingly.
    5. To engage with customers, Paytm invests in marketing campaigns and other promotional offers.

    Growth Trajectory of Paytm

    Growth of Paytm

    Paytm has shown an impressive growth and expansion journey over the years. It has evolved from a mobile recharge platform to a financial services powerhouse. It claims to have more than 300 million active users. Paytm’s strategic partnerships with HDFC Bank, Uber, Indian Railways, and major E-commerce platforms have helped the company to grow over the years. Cashback and Promotional offers still attract new customers and hold the existing ones. Paytm has moved beyond payment services and has ventured into travel, wealth, credit cards, loans, etc.

    SWOT Analysis of Paytm

    The Paytm SWOT Analysis highlights its strengths, weaknesses, opportunities, and threats, showcasing its market position and growth potential.

    SWOT analysis of Paytm

    Strengths

    1. Paytm is a leading player in the payment sector and enjoys a large user base.
    2. Paytm has strong brand recognition in the fintech sector of India.
    3. Paytm has a diversified product portfolio such as financial services, loans, broking, credit cards, travel, etc.

    Weakness

    1. The lack of profits in the company has raised financial sustainability issues for the company.
    2. Paytm heavily depends on the Indian market for its revenue and any kind of regulatory changes can impact the company’s business operations.
    3. The company faces tough competition from other fintech startups like PhonePe, Google Pay, etc.

    Opportunities

    1. Penetration in the rural area to provide digital payment services can help Paytm grow its business further.
    2. A comprehensive app for seamless user experience can drive the revenue growth of the company.
    3. Tapping into the International markets can help Paytm provide services outside of India, which boosts the company’s revenue growth.

    Threats

    1. Digital payment systems like Paytm are often prone to cyber security risks. Such risks have the potential to significantly alter the user base of Paytm.
    2. Economic downturns can affect consumer spending. This will eventually reduce the user base and revenue growth of the company.
    3. Innovative Competitors and Big Giants like Google Pay and PhonePe could challenge Paytm’s growth.

    Read Also: One MobiKwik Systems Case Study: Business Model, Financials & SWOT Analysis

    Conclusion

    Paytm’s case study provides useful insights into the dynamics of the fintech landscape and cashless economy in India. Paytm’s diversification of services and first-mover advantage have allowed it to create a strong and loyal user base in India. The company should continue to innovate and explore the emerging digital landscape of India for better market positioning and customer engagement.

    S.NO.Check Out These Interesting Posts You Might Enjoy!
    1ICICI Bank Case Study: Financials, KPIs, Growth Strategies, and SWOT Analysis
    2Vedanta Case Study: Business Model, Financial Statement, SWOT Analysis
    3Nestle India Case Study: Business Model, Financial Statement, SWOT Analysis
    4BPCL Case Study: Business Model, Product Portfolio and SWOT Analysis
    5Apollo Hospitals Case Study : Business Model, Financial Statements, And SWOT Analysis

    Frequently Asked Questions (FAQs)

    1. Who founded Paytm?

      Vijay Shekhar Sharma founded Paytm in 2010.

    2. What is the shareholding percentage of promoters in Paytm?

      As of September 2023, holding of promoters is nil.

    3. Paytm faces tough competition from which companies?

      PhonePe, Google Pay, etc..

    4. When was Paytm listed on NSE & BSE?

      November, 2021.

    5. What financial services are offered by Paytm?

      Mobile Banking Services, Loans, Mutual funds, Equity Investments, Credit Cards, etc.

    6. What is the UPI transaction limit through Paytm per day

      Paytm UPI allows you to transfer the maximum amount of Rs 1 lakh in a day.

  • Open Free Demat Account

    Join Pocketful Now

    You have successfully subscribed to the newsletter

    There was an error while trying to send your request. Please try again.

    Pocketful blog will use the information you provide on this form to be in touch with you and to provide updates and marketing.