Burger King, one of the world’s most iconic fast-food chains, has come a long way from a single Miami restaurant to become a global brand known for its flame-grilled burgers and customer centric approach. Over the years, Burger King has been able to differentiate itself from rivals like McDonald’s while adapting to changing consumer preferences.
This Burger King case study offers an in-depth look at the marketing strategies and decisions behind the fast food giant’s success. This case study examines the key aspects of the business, such as marketing campaigns, product innovation, competitive positioning, and global expansion.
Burger King: An Overview
Burger King is one of the most iconic fast food chains in the world. It was founded in 1954 by Keith G. Cramer and Matthew Burns. Originally, it was named as “Insta Burger King” as the restaurant was inspired by the founder’s visit to the original McDonald’s store in San Bernardino, California. They purchased the rights to the two innovative pieces of equipment, known as the “Insta-Machines” and “Insta-Broilers.” These machines were capable of cooking multiple burgers at once, which became the cornerstone of their operations. They had the vision to create their version of a fast food restaurant with a focus on flame grilled burgers, offering a unique flavor as compared to fried burgers.
The company experienced financial difficulties in 1959 and was purchased by James McLamore and David R. Edgerton, the franchise owners of the Miami and Florida branches of the Insta Burger King. McLamore and Edgerton decided to drop “Insta” from the nаme аnd rebranding the chain as simply “Burger King’.”
In 1957, Burger King introduced its signature product known as “The Whopper,” which remains the chain’s flagship item. The Whopper’s introduction helped cement Burger King’s reputation as a major player in the fast food industry.
Through expansions and acquisitions, Burger King’s market size grew, which transformed it into a global brand. Today, it operates in over 100 countries, known for its flame grilled burgers and iconic “Have It Your Way” slogan, which emphasizes customer choice and personalization.
Let’s have a look at burger king marketing strategy, as they played a pivotal role in establishing the brand as one of the top fast food chains globally. Burger King is known for its innovative and bold approach. Burger King has consistently applied creative marketing strategies to differentiate itself from competitors, particularly its main rival, McDonald’s. A key element of its strategy has been the emphasis on flame-grilled burgers, particularly the iconic Whopper and positioning the brand as a premium alternative to fried burgers. Key elements of its marketing strategy include:
Moldy Whopper Campaign: One of the Burger King’s marketing strategies is its willingness to accept controversy and humor as seen in campaigns like “The Moldy Whopper,” which showcased that how its burgers is free of artificial preservatives and have naturally decomposed over time. This unconventional campaign helped draw the public’s attention to the company’s commitment to natural and fresh ingredients.
Whopper Detour Campaign: The “Whopper Detour” campaign used technology to lure customers away from McDonald’s by offering the 1-cent Whoppers to anyone who ordered near a McDonald’s location. The Burger King app redirects the customer to the nearest Burger King outlet from where they can collect their Whopper.
Social Media Strategy: Burger King has also effectively utilized digital marketing and social media by engaging with audiences through witty responses, viral content, and influencer collaborations. This approach has enabled Burger King to stay relevant among younger and tech savvy consumers, also promoting brand loyalty.
Localization of the Menu: Localization is another critical aspect of its strategy. Burger King adapts its menu and marketing campaigns to suit the tastes and preferences of different regions. For example, in India, where a large portion of the population is vegetarian, the brand introduced the Veg Whopper.
Burger King’s marketing strategy has been a blend of creativity, technology, and local market insights, which has helped it craft a distinct identity.
S.NO.
Check Out These Interesting Posts You Might Enjoy!
In conclusion, Burger King has solidified its place as a global leader in the fast-food business through bold innovation, creative marketing and a commitment to quality. From its iconic flame-grilled Whopper to its unconventional campaigns, the brand consistently adapts to changing consumer trends while maintaining its distinct identity. Burger King’s focus on customer preferences, natural ingredients, and digital engagement has allowed it to remain competitive in an evolving industry.
Frequently Asked Questions (FAQs)
What is the target market for Burger King?
Burger King targets young adults, teens, and families who value fast, affordable, and customizable meals, particularly flame-grilled burgers.
What is Burger King’s strategy?
Burger King’s strategy focuses on offering high-quality, customizable burgers, bold marketing campaigns, technological innovation, and menu localization.
What is the story behind Burger King?
Founded in 1954 as “Insta Burger King,” it was rebranded in 1959 after financial struggles. The Whopper, introduced in 1957, became its iconic product.
Who is the CEO of Burger King?
The CEO of Burger King is José Cil (CEO of Restaurant Brands International, the parent company).
Who is Burger King’s biggest competitor?
Burger King’s biggest competitor is McDonald’s, competing globally in the fast-food market.
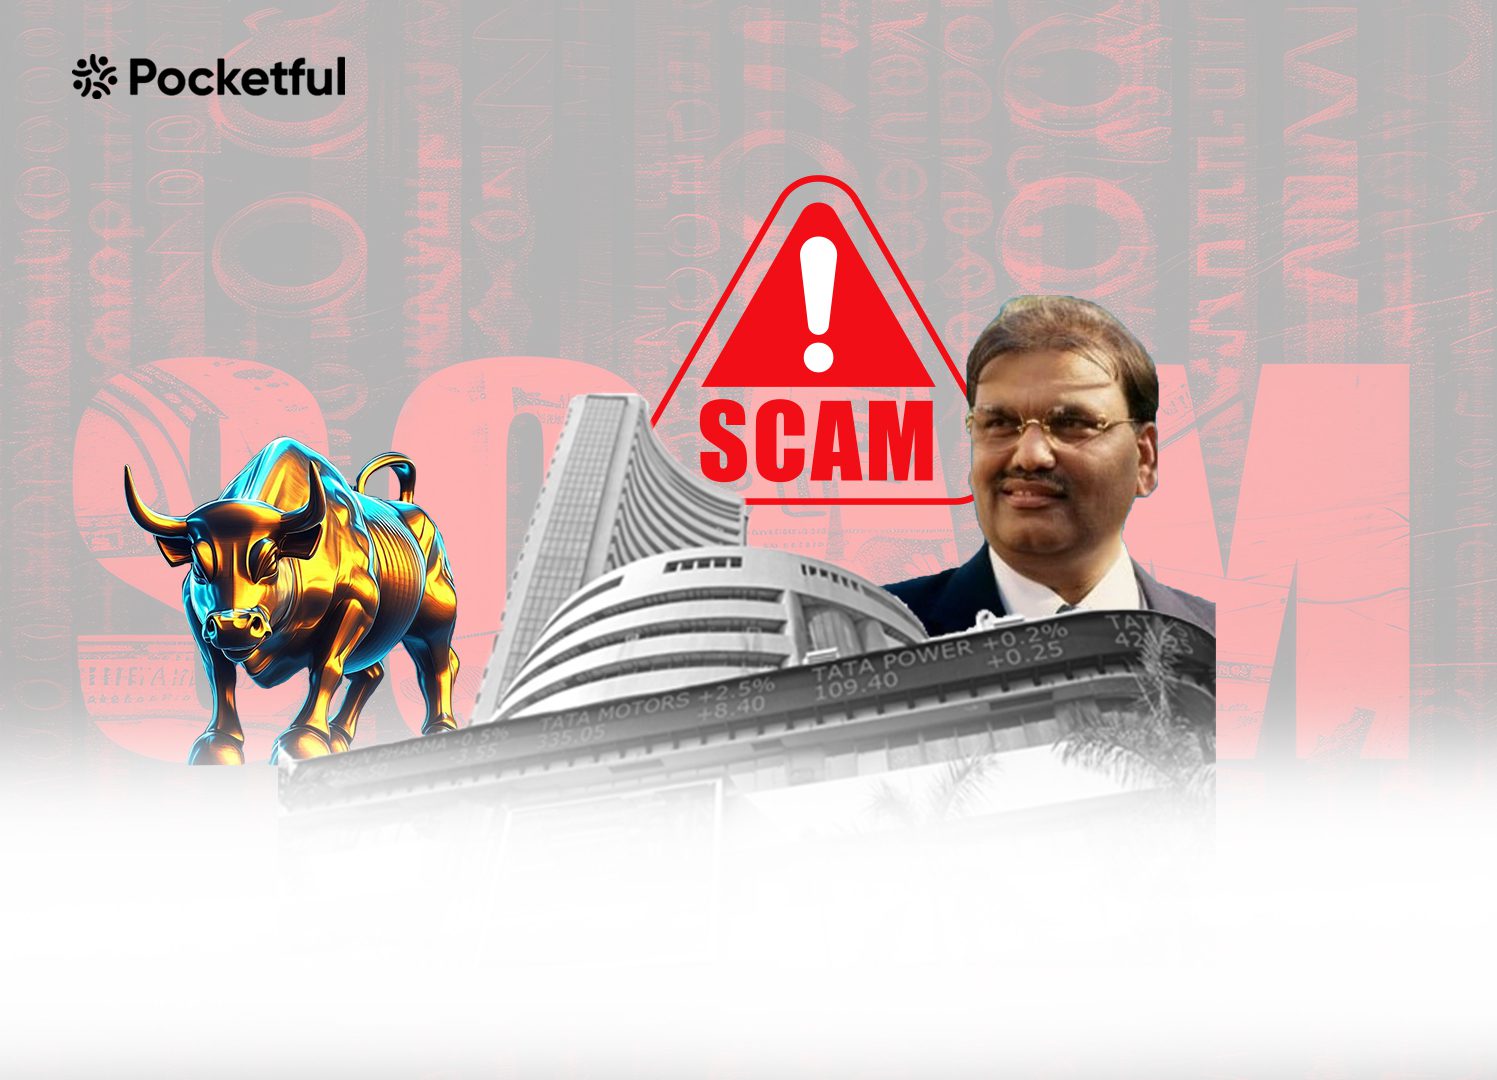
The 1992 Indian Stock Market Scam, being masterminded by Harshad Mehta, stands as one of the biggest financial frauds in India. Its repercussions became highly felt when it came to the Indian economy, regulations to be followed in the stock market, and investor confidence. It showed the weakness in the Indian banking and financial system that forever altered the horizon of Indian finance. This blog goes deep into the intricacies of the Harshad Mehta Scam story, thus including the background of Harshad Mehta, the techniques he used to create the ruckus in the stock market, and the after-effects that followed.
Overview of the Scam 1992
The Harshad Mehta scam refers to the 1992 Indian stock market scam, which featured a sequence of fraudulent trading on the Bombay Stock Exchange (BSE). The scam reportedly resulted in a loss of around ₹4,000 crores (approximately $1 billion) to banks and investors. Due to his charm and connections, Mehta has often been labeled as the “Big Bull,” who allowed his ingenious scheme to inflate and manipulate stock prices with methods such as bank receipts (BRs), creating the illusion of liquidity. He manipulated loopholes in the banking system and regulations to artificially inflate stock prices and thereby amassed a fortune.
Manipulation reached its peak in 1992 when Mehta’s activities were brought out in public, and a stock market crash shook the Indian economy. The scandal resulted in regulatory reforms in the Indian financial sector, bringing immense changes in the way that the stock market was monitored and regulated.
Background of Harshad Mehta
Born on July 29, 1954, in a middle-class family in Mumbai, Harshad Mehta had a humble beginning. He graduated with a degree in commerce and did a number of odd jobs before he became a salesperson in a brokerage firm. His sharp financial acumen and understanding of the stock market soon led him to establish his own brokerage firm, Grow More Research and Asset Management. With a sharp eye for investment opportunities and an impassioned ambition, he rapidly climbed the ranks of the financial world.
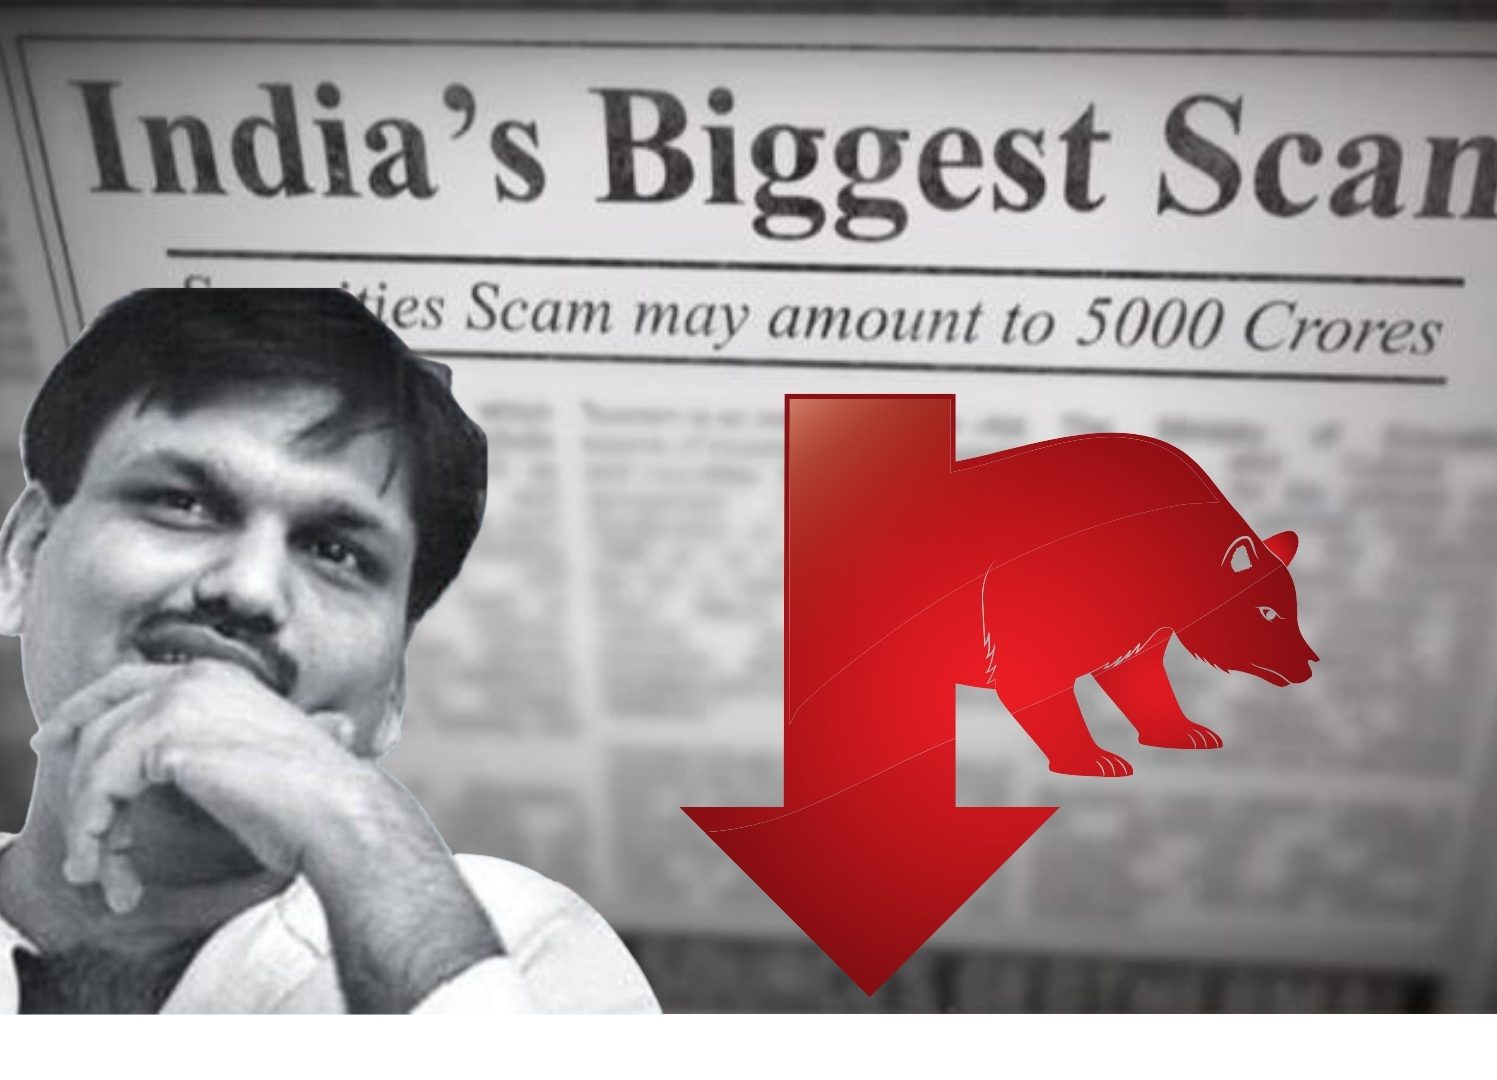
Mehta emerged as a major player in the Indian stock market in the late 1980s and early 1990s. His investments and financial strategies made him famous in the country. He came to be known as the “Big Bull” of the stock market for making bold predictions and wonderful returns. However, this success stood on a shaky platform of unethical practices and deception.
Harshad Mehta Scam Amount in Rupees
The Harshad Mehta scam of 1992 is one of the biggest financial frauds in India’s history. The total amount involved in the scam was around ₹4,000 crores (approximately $1 billion at that time). This massive fraud shook the Indian economy, exposed loopholes in the financial system, and led to major changes in how the stock market and banks operate.
The Harshad Mehta scam was a result of several strategic moves which Mehta undertook to alter the stock prices. Below is a comprehensive case study of how the scam was carried out:
1. Ready Forward Deal
During that time, banks were required to invest a certain amount of their deposits in government securities. Banks in need of funds or liquidity used to transfer these securities among themselves through the “Ready Forward Deal” mechanism. The Ready Forward Deal was a mechanism used by banks to buy and sell securities in exchange for funds with the help of brokers. Harshad Mehta, being a famous broker, used to get cheques issued in his name instead of the bank. When the bank demanded funds in exchange for its securities, he would approach another bank and repeat the same process.
2. Bank Receipts (BRs)
Bank receipts are documents issued by the bank to acknowledge the receiving of funds in exchange for selling the securities. Harshad Mehta manipulated and convinced the banks to issue fake BRs, which were used to raise huge sums of money from banks without any actual underlying securities. Harshad Mehta used these fake Bank Receipts (BRs) to raise high loan amounts from banks without actually owning any securities. He then bought a large number of shares in the market and artificially inflated their prices. The scam led to huge losses for the banks when it finally came to light.
3. Circular Trading
Circular trading refers to a situation where shares are sold and bought between different groups of traders for the sake of creating an artificial case in which the demand for the stock is high. Harshad Mehta used such trading practices to raise the prices of stocks, thus attracting unsuspecting investors.
4. False Information
Mehta also spread false information about various companies to whip up mania and artificially pushed their stock prices much higher than their actual value. The reason behind spreading false information was to generate excitement about certain stocks and modify the market sentiment so that other investors would invest more money into these popular stocks.
5. Key Manipulated Stocks
Mehta targeted a number of key stocks to carry out his plan. Here are a few of them:
ACC (Associated Cement Companies): One of the significant victims of Mehta’s manipulation was ACC. He manipulated the stock price using his influence and contacts, and the stock price increased from ₹200 to over ₹9,000 in a few months. This huge jump in stock prices was due to heavy buying and circular trading, creating a misconception about demand for the stock.
Sterlite Industries: Sterlite Industries is yet another Indian company whose stock price was manipulated by Harshad Mehta. He inflated the price of the stock from INR 30 to INR 1,500 by using the funds borrowed from banks. Artificial demand created through circular trading and heavy buying caused the share price of Sterlite to increase tremendously, though there was no actual change in the real financial health of the company.
Videocon: Videocon, a leading manufacturer of large electricity appliances and electronics, was also targeted by Harshad Mehta. The stock price of Videocon increased from INR 45 to INR 2,000. This price increase caught the attention of other retail investors who believed that the stock was going very well, only to find themselves losing money when the bubble burst.
Key Figures Involved in Scam 1992
Following are the number of key players either involved or not involved knowingly in the Harshad Mehta scam Story:
Harshad Mehta: He was the mastermind behind the scam. His innovative thinking and illegal ways helped him in manipulating the market quite successfully. His strategies exploited the loopholes in the regulatory systems.
S. Venkitaramanan: He was the Governor of the Reserve Bank of India at that time and was duty-bound to monitor and regulate the banking sector. RBI failed to detect the loopholes before the scam happened. He played an important role in introducing reforms after the scam so that such activities would not repeat again in the future.
Sucheta Dalal: Sucheta Dalal was actively involved in unveiling the scam. She was a journalist with the Times of India. In April 1992, she wrote an article disclosing the connection between the high lifestyle of Harshad Mehta and skyrocketing stock prices, which helped the government authorities detect the fraud. Her work uncovered inconsistencies in the stock market and the banking sectors, causing the regulatory bodies to conduct investigations.
P. V. Narasimha Rao: He was the Prime Minister of India when the fraud happened. He was accused of accepting a huge amount of money as a bribe from Mehta in order to get out of the legal cases. Though it was never established in the court, the case provided a political angle to the scam, redirecting the public concern on the strong nexus between politicians and the stock market manipulators.
Apart from these, there were many more characters involved in creating an atmosphere that helped Harshad Mehta flourish, which had a disastrous effect on the Indian stock market.
The Indian stock market and the overall economy were deeply affected due to the Harshad Mehta scam Story. The impacts are as follows:
1. Stock Market Crash
The scam came to light in April 1992 and the public of India witnessed a stock market crash like never before. Indices on the Bombay Stock Exchange (BSE) crashed as the investors panicked and sold their investments. BSE Sensex lost nearly half of its value within weeks, which altogether erased investor wealth worth billions of rupees.
2. Regulatory Reforms
It was in the wake of the scam that the Indian government had to undertake drastic regulatory reforms. SEBI was made more potent, and new regulations to protect investors and increase transparency were introduced. Regulations for initial public offerings and trading practices became stiffer, with the stock market being overseen much more strictly.
3. Erosion of Investor Confidence
The scam significantly eroded investor confidence in the Indian financial system. Many retail investors, having invested their life savings into stocks, suffered huge losses. The negative sentiment due to the scam did not go away for years, and it took a lot of time to build investor confidence.
4. Economic Aftermath
The ripples of the scam extended beyond this as the wider economy felt its aftershocks. Financial institutions suffered enormous losses that resulted in tighter credit conditions and decelerated economic growth. The banking sector was subject to consequential inquiries and reforms focused on strengthening accountability and governance.
Public and Media Reaction
Public and Media response to the Harshad Mehta scam was highly profiled. The news of the scam splashed on the front pages of newspapers for months. Investigations unraveled minute details of Mehta’s fraudulent schemes. The 1992 scam attracted the following reactions:
1. Media Coverage
The scam received extensive media coverage on television news channels and newspapers as they analyzed its implications and the personalities involved. Indeed, the media played a pivotal role in enlightening the public on the scams that, more broadly, contributed to public outcry.
2. Public Outcry
The public reacted with shock and a sense of being betrayed. The investors were betrayed, and across the board, there was a demand for accountability and reform. Protests erupted in cities as people whose lives were affected by the scam demanded justice from authorities.
3. Cultural Representations
Films, documentaries, and even web series have been inspired by the saga of Harshad Mehta scam. As such, his legacy is firmly established as an icon of financial deception. The recent popularity of the web series “Scam 1992” has only sparked renewed interest in the events of 1992, bringing the story to a newer generation.
The Harshad Mehta Scam story is a lesson drawn from Indian financial history. It recounts how vulnerabilities in financial systems can take a tremendous toll when someone with enough ambition uses those loopholes. While his story may feature an individual’s financial success culminating in failure, it goes on to capture the intricacies associated with market manipulation and the need for strong regulations to protect investors.
The lessons from the events of 1992 made the Indian stock market change in crucial ways. Though the scars of this scam may never fully heal, the reforms undertaken after that have enabled the emergence of an even more resilient and transparent financial system.
Frequently Asked Questions (FAQs)
What was the total fraud amount in the Harshad Mehta scam 1992?
The total fraud amount in the Harshad Mehta scam was approximately ₹4,000 crore.
How much money was lost in the Harshad Mehta scam?
The Harshad Mehta scam amount is estimated at around ₹4,000 crore, approximately $1 billion, which includes losses of numerous banks and investors
Who was Harshad Mehta?
Harshad Mehta was the mastermind behind the 1992 Indian Stock Market scam. Mehta manipulated the stock prices by using illegal methods, resulting in a stock market bubble, which finally culminated in huge losses to investors.
How did Harshad Mehta inflate stock prices?
Mehta used the loopholes in the Ready Forward Deal mechanism, fake BRs, circular trading, and fabricated rumors about the stocks, hence artificially inflating the prices.
What were the impacts of the 1992 scam on the Indian economy?
The scam led to a big stock market crash, loss of investor confidence, and reforms in the regulatory system of the financial sector, apart from increased scrutiny of banking practices.
How did the public and media react to the scam?
The public’s response to the scam was characterized by outrage and shock, largely due to the extensive media coverage about the details and after-effects of the scam. Recently, the events of the scam served as a storyline of a web series, which has renewed the public interest in the scam.
Each individual needs to exercise to stay healthy, and if you’re a health nut, then you must be spending a lot of time in the gym. However, comfortable exercise gear is essential, and “Adidas” is one of the first names that pop up when someone talks about sports shoes. Do you know the history of Adidas, one of the most popular shoe brands in the world?
In this blog, we’ll discuss Adidas and show you how it went from being a shoe producer to becoming the most popular sportswear brand worldwide.
Company Overview: Adidas
Adolf and his brother Rudolf Dassler created the Adidas company in 1924 under the name “Dassler Brothers Shoe Factory.” At first, the company’s primary concentration was on producing athletic footwear. In 1949, a dispute between the brothers resulted in the division of the business. Adolf Dassler went on to create Adidas, while his brother Rudolf founded Puma. Adidas shoes became popular when the German team wore them with screw-in studs and won the 1954 Football World Cup. This helped Adidas become a household name. The business became well-known over time when it was chosen as the official footwear partner of the World Cups. Due to fierce competition from Nike in the 1990s, the brand began producing fashion-oriented footwear and sportswear. The corporation has made several significant acquisitions, but the acquisition of Reebok in 2005 is seen as one of the most important ones since it allowed Adidas to compete with Nike and grow their market share in North America. The company established a digital presence and introduced a range of environmentally friendly products manufactured from recycled materials. The firm sold the Reebok brand in 2021 and started concentrating on its leading Adidas brand due to the COVID-19 pandemic and the tough economic conditions.
Adidas’s business Model is essential to its success. The following are the main components of their business model:-
Sponsorships – The company’s brand visibility is enhanced by sponsoring significant global events, such as FIFA and the Olympics.
Endorsements – The company endorses athletes like Mohamed Salah and Lionel Messi, which helps increase the popularity of the brand.
Collaborations – Adidas collaborates with influencers, artists, and celebrities, including David Beckham and Kayne West, to promote its brand.
Digital Marketing – The business uses a variety of hashtags and social media ads to promote its brand.
Event Marketing – Adidas also organizes events in many cities around the globe to engage with its target audience and increase brand awareness.
Customer Loyalty Program – This is another incredibly distinctive aspect of the business, whereby it uses several loyalty programs to reward its devoted customers.
Pricing Policy of Adidas
The company gains market share by utilizing a dynamic pricing strategy. Here is a summary of Adidas’ pricing strategy.-
Limited Edition – Adidas releases limited edition products in collaboration with different celebrities, which generates hype in the market.
Innovative Products – The business also specializes in high-performance footwear that uses cutting-edge technologies, such as 4D printing technology, etc. However, these products are expensive.
Value Pricing – The company also offers value-for-money products to draw mid-range customers and expand its market share.
Seasonal Discount – Adidas uses promotional offers, stock clearance deals, and seasonal reductions to move out of its inventory.
Geographical Pricing – The company’s pricing strategy varies depending on the location. For instance, prices in developed countries will be greater than in less developed countries.
Pricing Segment – Adidas categorizes its products into entry-level, mid-range, and luxury segments.
Conclusion
In conclusion, Adidas is one of the most popular shoe brands in the world. Adidas started operations as the “Dassler Brothers Shoe Factory” and was later renamed Adidas by Adolf Dassler. The company is known all over the world for its athletic apparel and sports footwear. As the leader in the athletic footwear industry, the firm maintains its position by using strategic pricing and marketing approaches. The business has also shifted to manufacturing products using eco-friendly and sustainable items.
S.NO.
Check Out These Interesting Posts You Might Enjoy!
Clothing is more than just fabric but is also a form of expression. Stylish clothing is necessary if you want to appear and express yourselves well at both parties and meetings. There are many different fashion labels on the market, and “Zara” is one of them.
In this blog, we will provide an overview of Zara, including their pricing strategy and business approach.
Zara – An Overview
Amancio Ortega and Rosalia Mera launched the business in Spain in 1975. The company was originally named Zorba and was later renamed Zara. Initially, the company sold fashion clothes at lower prices, similar to the designs of high-end fashion brands. Later, in 1980, the company expanded rapidly in Spain and became a well-known name in the fashion industry. The company efficiently manages its supply chain by manufacturing clothes in small batches, which helps in saving inventory costs. In 1988, the company expanded operations outside Spain and opened its first branch in Portugal. In 1990, the business opened several stores in cities like Tokyo, New York, and Paris. In 2001, Zara’s parent company, Inditex, went public and was listed on the Spanish Stock Exchange. Amancio Ortega, the founder, rose to prominence and became one of the richest persons in the world after the IPO. The company began operating its online store in 2010 to take advantage of e-commerce technology. The company launched the “Join Life” campaign, which reflects the company’s promise to utilize only sustainable fabrics by 2025 and use only eco-friendly materials.
Zara has a fashion-centric business model, and the company changes it according to market trends. The main components of Zara’s business model are as follows-
Supply Chain – The business guarantees that the product reaches the consumer on time because the company has an integrated supply chain, which includes distributors located all over the world.
Product Upgrade – The company reacts to the shifting fashion trends by launching new products in two to three weeks.
Designing of Products – With more than 700 internal designers, the organization produces more than 10,000 designs a year.
Production Policy – Due to the company’s restricted production of the dresses, a high turnover ratio is guaranteed as limited supply creates urgency among customers.
Product Policy – The corporation doesn’t manufacture in large quantities, which allows it to increase production if a new product succeeds and restrict output if a product fails.
Customer Satisfaction – The company requests feedback from customers regularly to enhance the quality of its products. Additionally, the company’s stores must submit daily sales reports to the company’s headquarters.
Limited Advertising – The company opens its store in prime locations in the city, relies heavily on word-of-mouth advertising, and spends very little on product advertising.
E-Commerce – The company has invested in developing its e-commerce platforms to further expand its operations in regions where Zara’s physical stores are not present.
A company’s pricing strategy is an essential component of its business model, especially if it is associated with the fashion industry, which can be extremely competitive. Zara’s pricing strategy is mentioned below:
Affordability – The company’s premium goods are accessible to the general public while still giving their customers a feeling of exclusivity due to restricted production.
Market Pricing – The company adjusts the product’s price according to the nations it operates in. For instance, in developed countries, prices are often higher than in developing countries.
Limited Discounts – Zara only offers discounts after the conclusion of a specific season to clear out their inventory. In general, they do not offer frequent discounts in their stores.
Cost Efficient – Zara has control over the production process, which allows them to reduce costs and increase their profit margins.
Conclusion
Zara is an excellent example of how a regional fashion brand can become one of the world’s leading fashion brands through integrated operations, innovative designs, and effective pricing strategies. The company’s strategy to manufacture products in small batches generates urgency among customers and helps it maintain its exclusive image. The company’s commitment to sustainability and the use of eco-friendly materials will be beneficial to the environment and will also help the brand attract new customers.
Frequently Asked Questions (FAQs)
Who founded Zara?
Amancio Ortega and Rosalia Mera founded Zara in 1975.
Is Zara an Indian company?
Zara is a global fashion brand that is owned by the Spanish fashion company Inditex. Tata’s Trent formed a joint venture with Inditex to run Zara stores in India.
When did Zara start their operation in India?
Zara began operations in India in May 2010 when it opened its first location in New Delhi.
Which company owns Zara?
Inditex is a Spanish company that owns Zara.
Who are Zara’s biggest competitors in India?
Zara’s biggest competitors in India include H&M, Reliance Trends, Zudio, GAP, Vero Moda, Marks and Spencer, etc.
Procter & Gamble Hygiene and Health Care, a subsidiary of Procter & Gamble, has played a vital role in the evolution of hygiene standards in India. This blog aims to present a complete case study on P&G Hygiene and Health Care Ltd., including a company overview, business model, and products it provides.
Procter & Gamble Hygiene & Health Care Ltd. Overview
Procter & Gamble Hygiene & Health Care Limited, an Indian subsidiary of US-based multinational company P&G, was incorporated on 20 July 1964 and is headquartered in Mumbai. The company operates in the FMCG sector in India, and its core operations are manufacturing and selling packaged FMCG products like feminine hygiene and health care products. The company has created a reputation for selling high-quality products to meet the ever-changing needs of consumers. P&G Hygiene and Health Care is one of the best FMCG companies in India.
Business Model of Procter & Gamble Hygiene and Health Care Ltd
Procter & Gamble Hygiene and Health Care Ltd. operates a very robust business model centred around product innovation, brand strength, and wide distribution. This results in the company generating revenue through personal care products, such as sanitary napkins, healthcare items, and beauty products, which amount to around 70% of the sanitary protection segment.
Strong brand loyalty and a portfolio of brands like Whisper and Vicks have contributed to its stable revenues. The company uses both conventional retail channels and e-commerce platforms. This helps ensure a very large outreach and accessibility for consumers across all strata of urban and rural society, further strengthening overall sales performances.
Products Portfolio of Procter & Gamble Hygiene and Health Care Ltd
The company operates in two segments: Health care products and Hygiene products. The hygiene products segment consists mainly of feminine hygiene products and other skin care hygiene products, whereas the health care segment comprises ointments and creams, cough drops and tablets, etc.
As of 2024, the company portfolio includes some very familiar brands such as Whisper, with more than 25% market share in sanitary napkins and Vicks, a popular healthcare product. The beauty segment includes Olay, while Gillette products cover the grooming segment. With over 40 different items in various categories, the company has a wide customer base. The company has such a big customer base mainly due to the firm’s line of women’s hygiene, oral care, and health supplements. P&G’s focus on quality and innovation helps the company build a loyal consumer base.
Market Details of Procter & Gamble Hygiene and Health Care
Financial Statements of Procter & Gamble Hygiene and Health Care Ltd
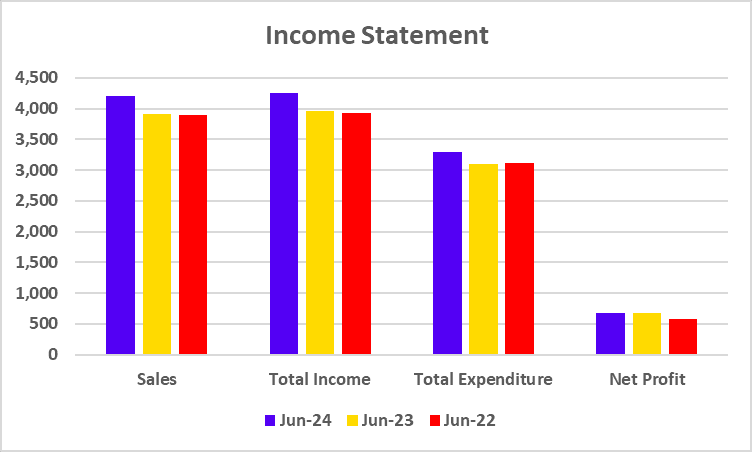
Income Statement
Particulars
June 2024
June 2023
June 2022
Sales
4,205
3,917
3,900
Total Income
4,257
3,958
3,925
Total Expenditure
3,291
3,107
3,123
Net Profit
675
678
575
(The figures mentioned above are in INR crores unless mentioned otherwise)
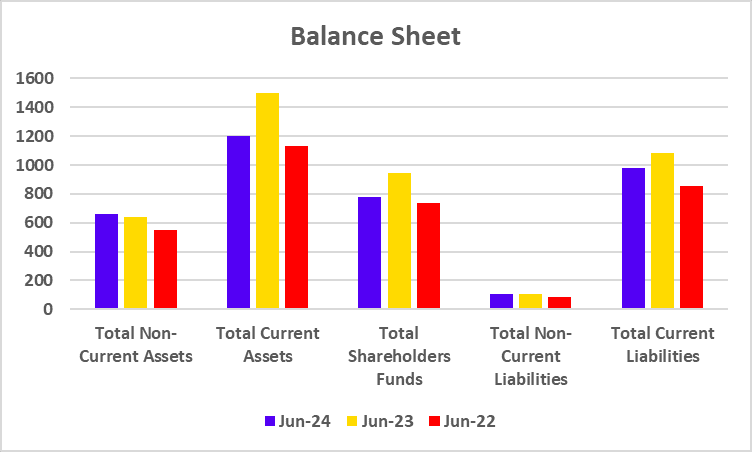
Balance Sheet
Particulars
June 2024
June 2023
June 2022
Total Non-Current Assets
659
642
547
Total Current Assets
1,200
1,496
1,134
Total Shareholders Funds
775
946
738
Total Non-Current Liabilities
103
106
86
Total Current Liabilities
981
1,085
858
(The figures mentioned above are in INR crores unless mentioned otherwise)
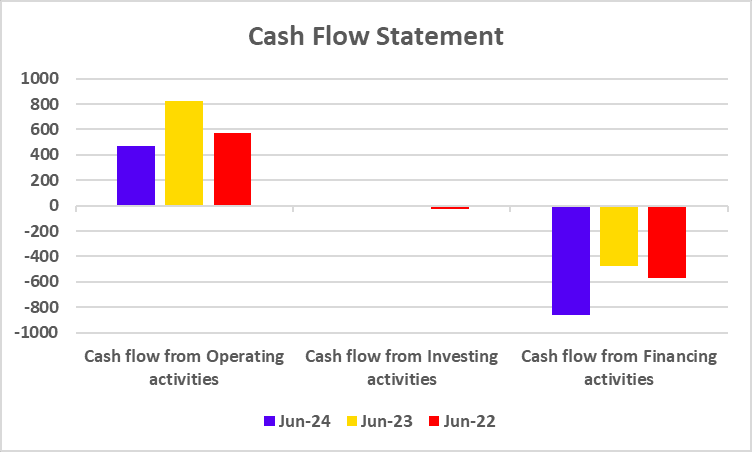
Cash Flow Statement
Particulars
June 2024
June 2023
June 2022
Cash flow from Operating activities
471
825
573
Cash flow from Investing activities
1
-9
-26
Cash flow from Financing activities
-862
-477
-568
(The figures mentioned above are in INR crores unless mentioned otherwise)
Key Performance Indicators (KPIs)
Particulars
June 2024
June 2023
June 2022
Net Profit Margin (%)
16.05
17.30
14.75
Return on Equity (%)
87.11
71.68
78.06
Return on Capital Employed (%)
110.03
80.85
97.31
Current Ratio (X)
1.22
1.38
1.32
EV/EBITDA (x)
52.19
49.99
50.19
SWOT Analysis of Procter & Gamble Hygiene and Health Care Ltd
Strength
Strong Portfolio of Brands: P&G has a broad portfolio of well-known brands around the world, like Whisper and Vicks, that command significant market shares.
Robust R&D Capabilities: The company spends a great amount on R&D, which supports new ideas and the creation of new and better products for its end-users.
Weakness
High Operational Costs: Due to intense competition in these segments, they are experiencing high production and distribution costs, which may affect performance.
Dependence on Mature Markets: Developed countries account for a large portion of P&G’s sales, which makes it susceptible to economic instability in those countries.
Opportunities
Changing Health Constraints: A higher degree of knowledge of hygiene and health will lead to more consumers seeking health-related P&G products.
Expansion in Emerging Markets: Emerging regions are commonly characterized by increased disposable income and, therefore, present a growth opportunity for P&G.
Threats
Regulatory Hurdles: Product safety and environmental concerns have a lot of regulatory rules associated with them that P&G must follow. Strict regulations result in high operating costs and make product development more complex.
Changing Consumer Behaviour: Consumer shifts toward natural and organic products can threaten the existing product lines of the company.
Procter & Gamble Hygiene and Health Care Ltd. stands out due to its strong portfolios of brands, commitment to innovation, and its direction toward sustainability and e-commerce. Even with such harsh conditions coming in the form of intense competition and economic fluctuations, the strategic focus on sustainability and e-commerce development has helped the company grow significantly over the years. Procter & Gamble is in a very great position to continue as a market leader and constantly looks to reach new consumer bases with improved products.
S.NO.
Check Out These Interesting Posts You Might Enjoy!
P&G follows very stringent quality standards through highly advanced research and development as well as aggressive testing on every product.
Is P&G committed to sustainability?
Yes, P&G has a strong commitment towards sustainability. For example, the company aims to use 100% recyclable or reusable packaging by 2030.
What is P&G’s market share in the sanitary napkin category?
P&G has about 25% of the market share in the sanitary napkin category due to its flagship brand, Whisper.
How relevant was P&G’s investment in R&D for the company?
Investments in research and development (R&D) made by P&G led to new product offerings that had positive responses from the market, enhanced customer satisfaction, and strengthened the firm’s competitive advantage.
In what ways did P&G reach out to the consumers regarding the hygiene initiatives?
P&G reached out to consumers by conducting surveys, community programs and social media & feedback pages.
No matter the brand of computer or laptop you own, whether you enjoy playing video games on it or use it for business purposes, most systems are powered by a single US-based manufacturer called “Intel Corporation.”
In this blog, we will delve into an Intel case study, exploring its costs and marketing tactics in Detail.
Intel Overview
Gordon Moore and Robert Noyce, with the help of an investor named Arthur Rock, established Intel in 1968. The company first concentrated on producing memory chips, and in 1971, it unveiled the Intel 4004, the first microprocessor in history. Additionally, they launched the x86 family of microprocessors, which went by the name of Intel’s 8088 chip and was found in nearly all personal computers. The corporation launched a Pentium series of processors during the dot com boom, increasing the value of its brand among customers. The company expanded its product line beyond processors in 2000, adding technologies such as networking, graphics, and mobile computing. AMD is another fierce rival of the corporation in the microprocessor market. The company lost out on a chance to get into the mobile chip business, but thanks to its Xeon processor, it dominated the cloud computing and data center markets. The corporation has purchased numerous companies throughout the world. For example, the company acquired Mobileye in 2017 for $15.3 billion to become a key player in the autonomous driving and advanced driver-assistance systems (ADAS) markets. The company’s CEO unveiled the IDM 2.0 plan in 2020, which calls for the company to manufacture chips for other businesses and consolidate its market position. However, AMD and other players like Apple, with their competitive products, pose a severe threat to the corporation. The headquarters of the corporation are located in California, USA.
The Intel marketing strategy has played a pivotal role in establishing the company as a global leader in the technology sector. The following are some essential components of Intel’s marketing strategies:
Brand Recognition – The business launched a successful marketing effort called “Intel Inside” in 1991, which helped it establish itself as the industry leader. Even today, “Intel” stands for performance and quality.
Segment Marketing – Intel provides various goods to meet the demands of every user. For example, they manufacture processors for laptops and desktops and also make graphic cards for other applications.
Strategic Partnership – The company has partnered with several equipment manufacturers, including Dell, HP, and Lenovo, to supply them with Intel processors.
Digital Marketing – To sell its products, the company also uses digital marketing and collaborates with various tech influencers and reviewers.
Event Marketing – The organization hosts events worldwide on different tech platforms to engage with IT experts, developers, industry professionals, etc.
Pricing Strategies of Intel.
Intel Corporation maintains its leadership position in the market thanks to its pricing methods. The following are their various pricing schemes-
Premium Pricing – High-performance Intel Core i7, i9, and Xeon processors are among the best processors available and are thus priced at a premium.
Segment Pricing – The corporation sets its prices in response to the customers’ requirements. For instance, their mid-range pricing will cover items like i3 and i5 processors; on the other hand, buyers will pay more for their high-end processors, such as K series processors.
Dynamic Pricing – The business has a dynamic price structure and adjusts the prices of its products according to the locations it serves, i.e., offering its products at lower prices in developing nations than in developed ones.
Product-Based Pricing – Intel categorizes its products based on their features and prices them differently. For example, it charges differently for processors than it does for cloud computing and data application solutions.
Finally, Intel has grown from a memory chip producer to the largest microprocessor manufacturer in the world, making it a household name. The company caters to all customer groups by offering high-end processors for gaming and business use, cloud storage, etc. The business is up against fierce competition from recent entrants in the market, such as AMD and Apple. Nevertheless, their marketing approaches have enabled them to establish themselves as the industry leader.
S.NO.
Check Out These Interesting Posts You Might Enjoy!
In today’s fast-paced world, an individual may not find time to visit different stores to buy all the items on his shopping list. What if we told you that there is a superstore that offers everything you need—from groceries to electronics—and that they do it at the most affordable price?
In this blog, we’ll offer an overview of the world’s biggest superstore, “Walmart,” and its marketing tactics.
Walmart Overview
Sam Walton established Walmart in 1962. They established their first location in Arkansas, usually provide their customers with low-cost merchandise, and prioritize effective supply chain management and logistics. In order to fund its expansion, the firm went public in 1970 and was listed on the US Stock Exchange. By the end of the year, it had approximately 250 stores and recorded a $1 billion sale. The company uses cutting-edge technology to manage its supply chain distribution and inventory, and it quickly became one of the USA’s fastest-growing retailers. By 1991, they had opened additional locations in Mexico and Canada, made investments in e-commerce, and developed a website. Walmart grew quickly in the 2000s, entering markets including China, Germany, and the UK, and by that time, they had generated $200 billion in revenue.
Nevertheless, their rare forays into nations like South Korea and Germany proved unsuccessful, forcing them to leave those markets. In order to strengthen their e-commerce operations and market reach, the company purchased Jet.com. In 2018, it also acquired a majority stake in Flipkart. The company was able to grow its online business during the COVID-19 pandemic because most of its physical stores were closed worldwide. At the same time, it introduced contactless shopping and Walmart+, a membership program, to compete with rival Amazon Prime.
The marketing strategy of the company focuses on its core value of offering the lowest price to its customers; a few of its strategies are mentioned below-
Lowest Price – Customers can compare its prices with other stores and see that it continually strives to deliver products at the lowest price.
Promotions and Discounts – The company offers weekly ad circulars with special discounts highlighted in them, as well as online coupons and promo codes.
Loyalty Program – The company provides exclusive discounts and loyalty benefits to its regular customers to keep them as clients for extended periods.
Membership Program – Similar to Amazon, the company offers memberships to its consumers and provides benefits like free shipping and other perks.
Store Experience – The company’s stores have a neat, orderly atmosphere and a variety of amenities. Additionally, their customer service representatives are incredibly polite and helpful to their clients.
Digital Marketing – Walmart’s online marketing team consistently shares interesting information on various social media networks.
Walmart Product Portfolio
The company offers a wide range of products to its customers; the categorization of the products are as follows-
Groceries – The company delivers all types of grocery products, including meat, dairy, snacks, frozen, packaged food, etc., to its consumers. In addition, the corporation provides its clients with private-label brands at affordable prices. Bakery and healthcare products are also available at Walmart locations.
Footwear and Dresses – Besides providing a large assortment of clothing from different brands in their stores, the company also offers private label products in the footwear and clothing categories.
Furniture and Home Décor – A Walmart store also has a variety of other home décor products in addition to furniture.
Electronics – Walmart also offers electrical goods, such as video games, air conditioners, and televisions. Additionally, it sells CCTV and other home security solutions.
Sports Equipment – The company also sells fitness equipment at its stores, like baseball, fishing gear, accessories, and athletic wear.
Finally, it should be noted that Walmart has grown from a bargain retailer to one of the biggest retail chains in the world due to creative marketing strategies and cutting-edge technology. The business has encountered difficulties in a few nations that have forced them to suspend operations. Walmart has a devoted customer base as they have consistently provided the lowest prices on a wide range of products.
Frequently Asked Questions (FAQs)
Is Walmart an Indian Company?
No, Walmart is a US-based multinational retail corporation that operates various retail stores worldwide.
Is Flipkart and Walmart the same company?
No, Flipkart is an Indian online e-commerce platform, and Walmart is a US-based retail store operator. However, in 2018, Walmart acquired a controlling stake of 77% in Flipkart.
Who are the major competitors of Walmart?
Walmart faces intense competition from companies like Amazon, Alibaba, Best Buy, Reliance Retail, Spencer, etc.
Who is the CEO of Walmart?
Doug McMillion is the current CEO of Walmart as of 26 September 2024.
Which company is bigger: Amazon or Walmart?
Walmart recorded $648 billion in revenue for the previous year, while Amazon claimed $575 billion. However, Walmart’s growth rate is only 6%, while Amazon’s is 12%, meaning that Amazon will eventually surpass Walmart.
Apollo Hospitals is touching lives with its mission of delivering compassionate and innovative healthcare, its focus on advanced medical technologies, and its commitment to shaping the future of the healthcare industry while making a meaningful impact on patients’ lives.
In this blog, we will discuss Apollo case study, its business model, and its services. Moreover, we will go over their financial information and conduct a SWOT analysis.
Apollo Hospitals – An Overview
Apollo Hospitals was founded in 1983 by Dr. Prathap C. Reddy with the vision of making quality healthcare available in India. It was a time when Indians often traveled abroad for advanced medical treatments. Apollo made these services available in India, focusing on both quality and affordability. As the nation’s first corporate hospital, Apollo Hospitals is acclaimed for establishing the private healthcare revolution in the country. Apollo Hospitals has emerged as Asia’s primary integrated healthcare services provider and has a strong presence across the healthcare ecosystem, including hospitals, pharmacies, primary healthcare & diagnostic clinics, etc. It has a strategic focus on several areas, including:
Specialized Services: Apollo has developed several specialist healthcare services in cardiology, oncology, neurology, orthopedics, and transplant services. These specialized services attract patients from India and abroad and encourage medical tourism.
Digital Healthcare Services: Apollo recognized the potential of digital healthcare services after COVID-19 and launched its online platform Apollo 24/7, which allows patients to access healthcare services online. The company increasingly focuses on integrating AI, telemedicine, and data analytics to improve patient experiences.
Franchising: Apollo has expanded into tier 2 and tier 3 cities through a mix of owned and franchised hospitals, helping to promote its brand and provide healthcare services in underserved and untapped areas.
Business Model and Services of Apollo Hospitals
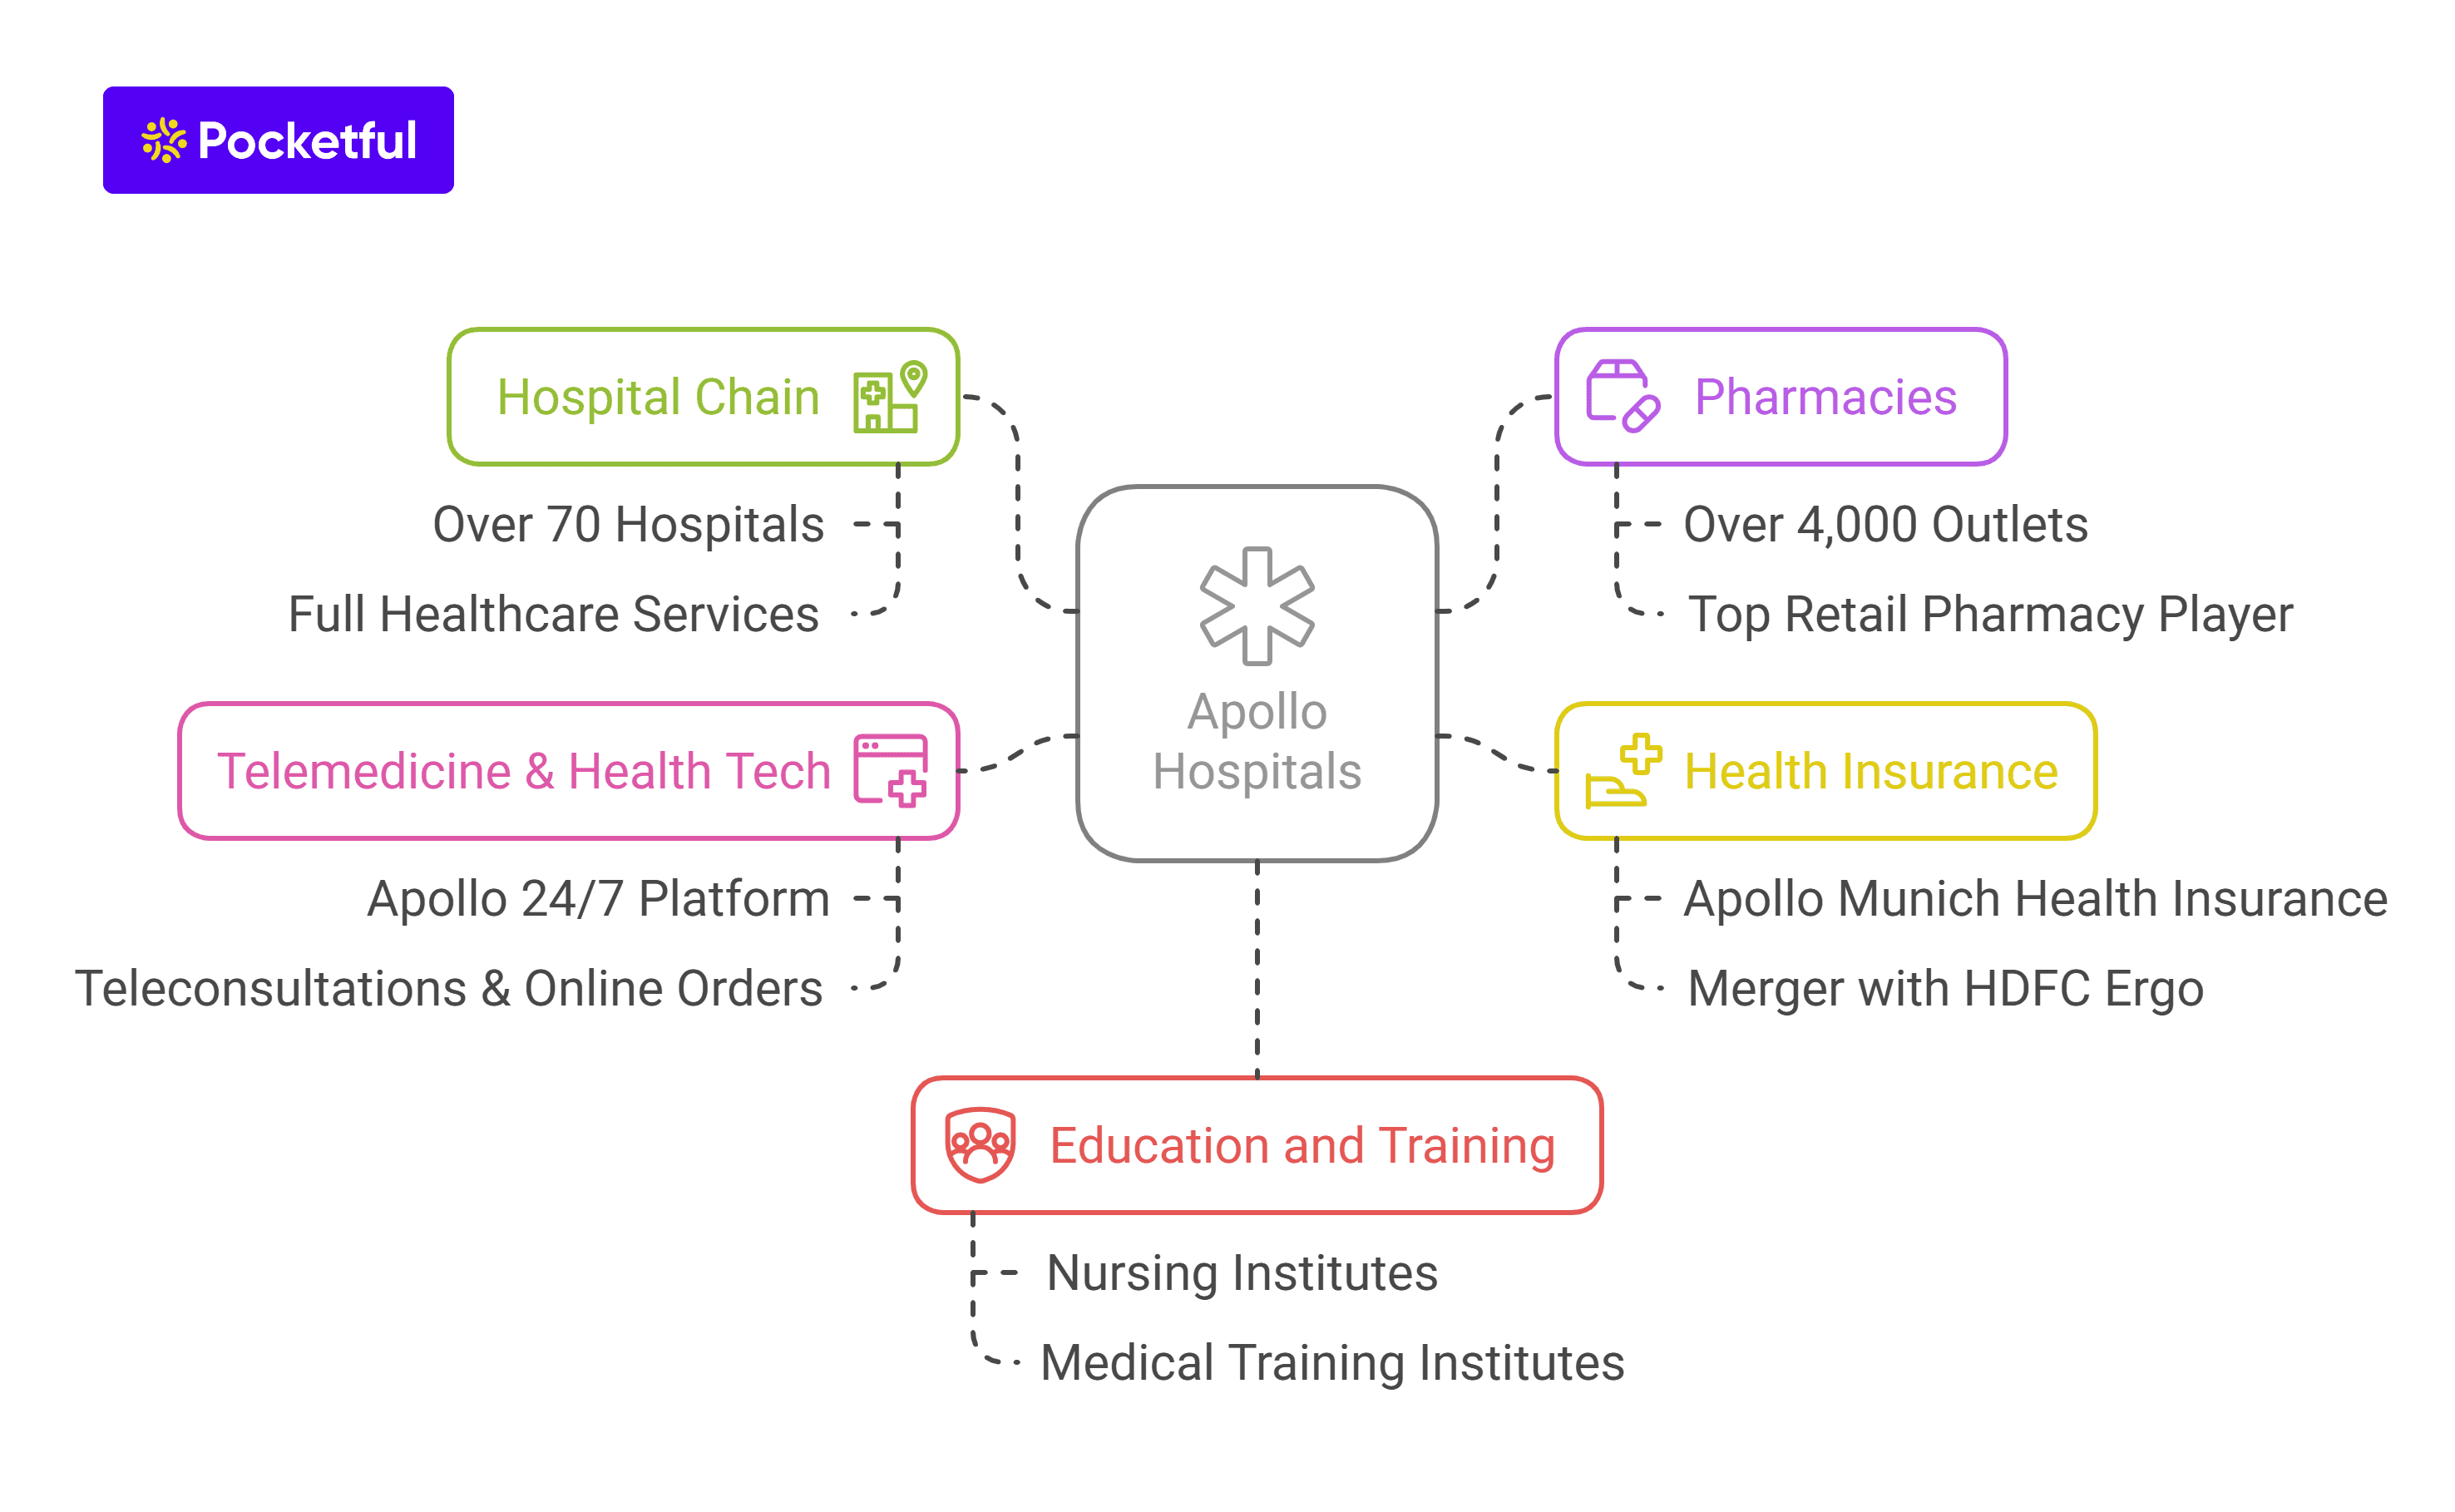
Apollo business model revolves around a multi-specialty healthcare model, offering a wide range of services across hospitals, pharmacies, diagnostics, and even telemedicine, including:
Hospital Chain: Apollo has one of the largest hospital chains in India, with over 70 hospitals across the country. These hospitals provide a full range of healthcare services, from routine health checkups to complex surgeries.
Pharmacies: Apollo’s massive pharmacy chain includes over 4,000 outlets. It is one of the top players in the retail pharmacy sector in India.
Health Insurance: Apollo entered the health insurance business with Apollo Munich Health Insurance, which later merged with HDFC Ergo General Insurance, broadening its impact on the healthcare ecosystem.
Telemedicine & Health Tech: The Apollo 24/7 platform offers teleconsultations, online pharmacy orders, and health monitoring, positioning it as an online health-tech leader.
Education and Training: Apollo has set up numerous nursing and medical training institutes to ensure a constant supply of skilled medical professionals.
Financial Statements of Apollo Hospitals
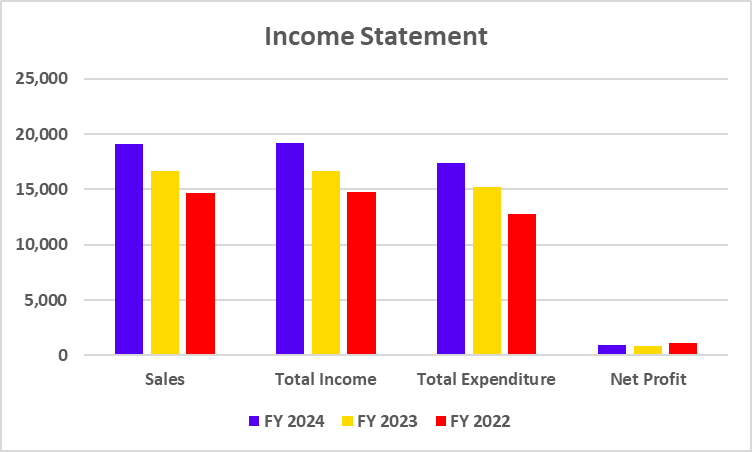
Income Statement
Particulars
FY 2024
FY 2023
FY 2022
Sales
19,059
16,612
14,662
Total Income
19,165
16,702
14,740
Total Expenditure
17,353
15,178
12,784
Net Profit
917
887
1,101
(The figures mentioned above are in INR crores unless mentioned otherwise)
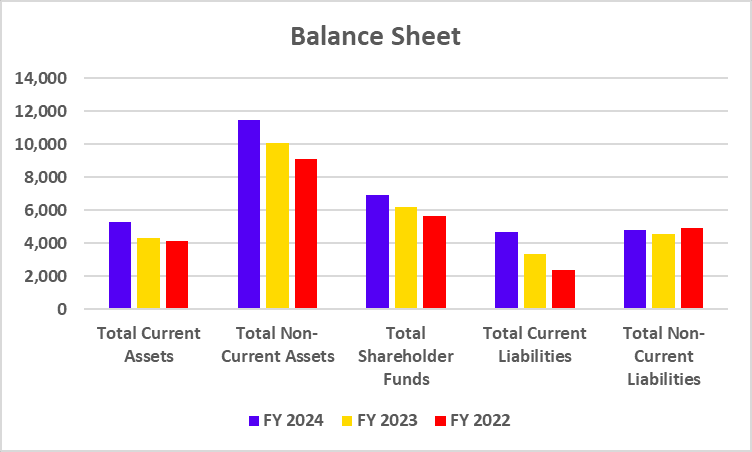
Balance Sheet
Particulars
FY 2024
FY 2023
FY 2022
Total Current Assets
5,280
4,337
4,122
Total Non-Current Assets
11,473
10,091
9,071
Total Shareholder Funds
6,935
6,197
5,623
Total Current Liabilities
4,665
3,325
2,383
Total Non-Current Liabilities
4,768
4,572
4,931
(The figures mentioned above are in INR crores unless mentioned otherwise)
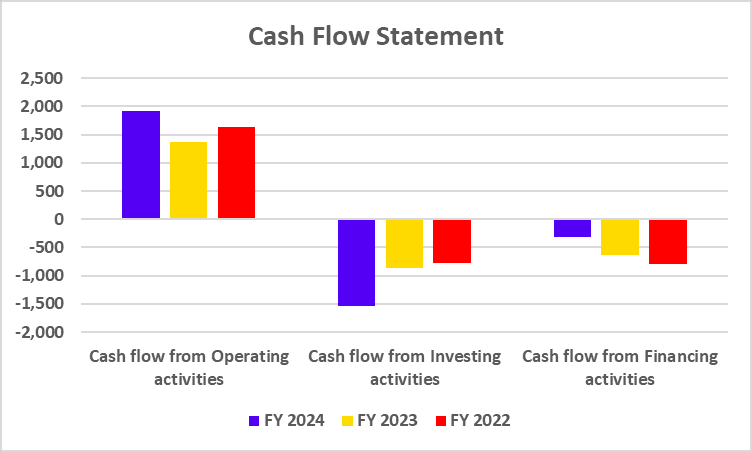
Cash Flow Statement
Particulars
FY 2024
FY 2023
FY 2022
Cash flow from Operating activities
1,920
1,376
1,628
Cash flow from Investing activities
-1,537
-870
-778
Cash flow from Financing activities
-311
-633
-792
(The figures mentioned above are in INR crores unless mentioned otherwise)
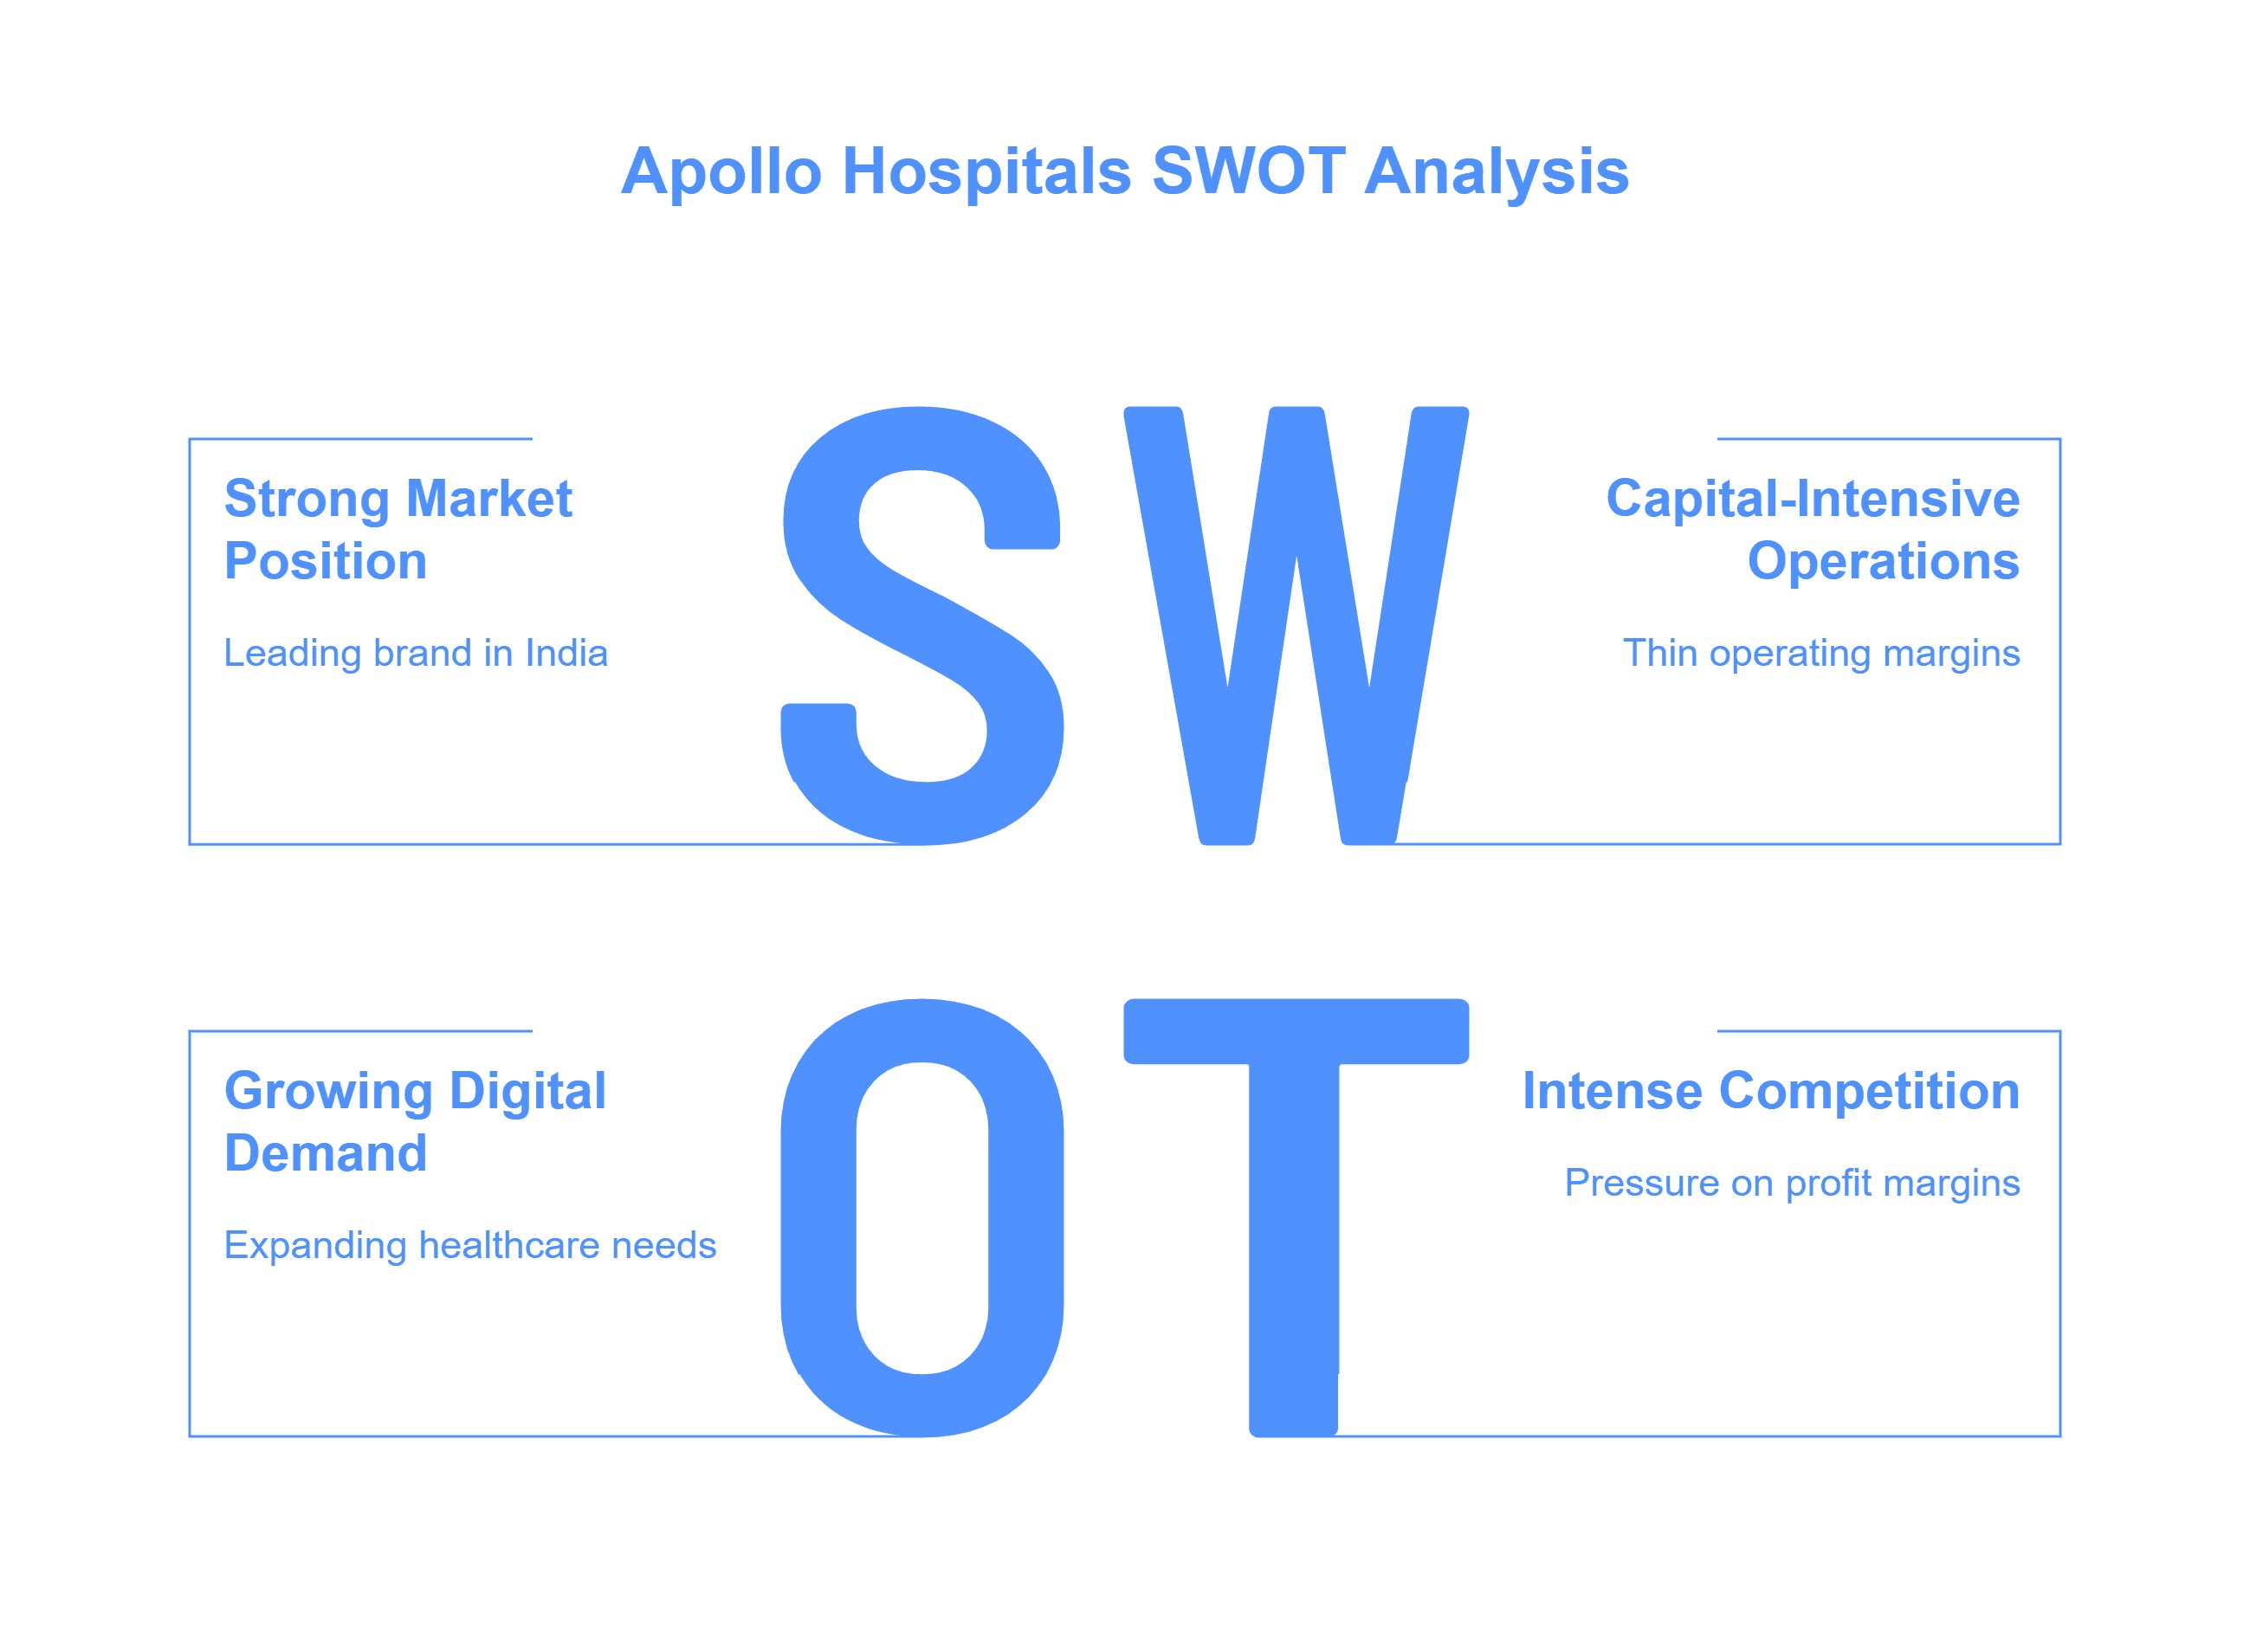
The Apollo SWOT Analysis highlights its strengths, weaknesses, opportunities, and threats, showcasing its market position and growth potential.
Strengths
Apollo Hospitals has a strong market position and brand recognition and is one of the leading hospitals in India with a significant market share.
It has a large network of 70 hospitals across the country, as well as several pharmacies and diagnostic centers.
It has medical expertise and provides healthcare services in key medical fields like cardiology, neurology, and organ transplants.
It is a key healthcare service provider and attracts patients from across the globe due to its low cost and high-quality services.
It has integrated operations across the entire business model, such as hospitals, pharmacies, health insurance, etc.
It has digital health platforms offering teleconsultations and online pharmacy services.
Weaknesses
Apollo Hospitals operates in a capital-intensive industry with significant investments in infrastructure, technology, and skilled personnel, which leads to thin operating margins.
Generally, super specialty and specialty hospitals face the staffing challenge as they continuously require a highly skilled workforce, and it’s challenging to attract, retain, and manage skilled healthcare professionals.
A big portion of revenues is generated through high-end specialized procedures. Hence, it is dependent on premium healthcare services for revenues.
Opportunities
With increasing demand for online healthcare services, Apollo’s digital ventures are expected to grow. The company invests heavily in artificial intelligence (AI) to improve diagnostics and treatment protocols.
Because of the expanding population, there is a growing demand for healthcare services.
The healthcare industry is poised to grow because of medical tourism, which attracts international patients because of its low cost and superior services.
It has formed several partnerships with international medical institutions, further enhancing its capabilities.
Apollo is exploring ways to reduce its environmental impact by adopting sustainable practices such as energy-efficient infrastructure designs and waste management projects.
Threats
The hospital industry is highly competitive as it operates on thin margins. Other hospital chains like Fortis Healthcare, Max Healthcare, and Narayana Health are competing for market share, especially in metro cities.
The healthcare industry is highly regulated; hence, it is subject to intense regulation related to pricing, medications, devices, availability of drugs, and hospital services.
The government’s push for affordable healthcare through schemes like Ayushman Bharat puts pressure on hospital chains to maintain low-profit margins.
Managing operational costs while maintaining high-quality services remains a constant challenge as the industry is capital-intensive, requiring regular investments in medical equipment, technology, infrastructure upgrades, and skilled professionals.
Healthcare is a human resource-intensive sector, and it comes with the challenge of hiring, training, and retaining medical professionals, which is an ongoing and costly process.
The economic slowdown leads to a shift towards affordable public healthcare options rather than premium healthcare.
Apollo Hospitals is a brand in itself known for its world-class healthcare services. It continuously invests in digital innovation, which gives it a competitive edge. However, it faces challenges like high operational costs and competition. However, it also has ample opportunities for expansion because of population outbursts, untapped markets in tier 2 and tier 3 cities, medical tourism, and digital healthcare services. There are stringent regulatory policies in place that should be adhered to as patients are involved, like patient safety, privacy, and data security. These challenges should be handled carefully and are crucial for Apollo’s sustained growth and success.
S.NO.
Check Out These Interesting Posts You Might Enjoy!
Apollo Hospital’s competitive advantage is its strong branding due to its wide hospital network, leadership in specialized healthcare services, integrated healthcare ecosystem, and early implementation of digital healthcare services.
How has Apollo Hospitals adapted to the COVID-19 pandemic?
During the pandemic, Apollo expanded its digital healthcare services through its telemedicine offerings. Also, it provided COVID-19 treatment and vaccination services and strengthened its healthcare infrastructure to meet the surge in demand for critical healthcare.
How can I invest in Apollo Hospitals shares?
One can invest in Apollo Hospitals shares by purchasing them through a stockbroker or an online trading platform. It is listed on both the stock exchanges, BSE and NSE, under the ticker symbol “APOLLOHOSP.”
What are Apollo Hospitals’ key growth strategies?
Apollo’s growth strategies include expanding its hospital network into rural areas along with tier 2 and tier 3 cities, scaling up its digital health services (Apollo 24/7), investing in specialized healthcare services, and attracting international patients through quality services and medical tourism.
Who established Apollo Hospitals?
Apollo Hospitals was founded in 1983 by Dr. Prathap C. Reddy.
Procter & Gamble is a global leader in the consumer goods segment, and it has been changing people’s daily routines for over 180 years. From Tide to Pampers and from Gillette to Head & Shoulders, P&G products have been a part of our everyday lives. You must be thinking about what made P&G maintain its market position after all these years.
In this blog, we will study an interesting case study of Procter & Gamble and analyze their ideas, strategies, and efforts in sustainability that drive success.
Procter & Gamble – An Overview
Procter & Gamble was established by Willian Procter and James Gamble in 1837. Quality proved to be their growth formula, and by the late 19th century, P&G had greatly expanded its list of products. In addition, it launched its first branded product, Ivory Soap, in 1879. That soap was a huge success, distinguished primarily by its purity and buoyancy. The Ivory Soap was aggressively advertised, and within a short period, it became a popular product in the USA. By the early 1900s, P&G was one of the first companies to use marketing and advertising strategies, and it sometimes advertised on the radio to promote some of its products. Over the years, P&G expanded operations and became a household name.
P&G’s operations are focused on product innovation and robust marketing strategies with a deep concern for sustainability. The company spends nearly $1.8 billion on R&D annually just to come up with those innovative ideas that can enhance its products.
P&G has an effective marketing strategy that has made its products popular all across the globe. Let’s look at their marketing strategy in detail:
Product
P&G specializes in the manufacturing and distribution of its wide range of products. These products are categorized into various segments, such as beauty, grooming, health care, fabric and home care, baby, feminine, and family care.
Every product is developed in-house by the company through extensive research and development. The company invests around $1.8 billion annually to innovate and enhance its offerings. For example, Tide, a flagship brand of P&G, is also available as Tide Pods and Tide Free & Gentle.
Another area P&G has considered very crucial is consumer insights. The company uses these insights to understand customer preferences and use advanced analytics to refine product development processes. The data-driven approach enables the company to predict market trends and develop products that suit customer preferences.
Pricing
P&G also uses psychological pricing methods, such as pricing products slightly below whole numbers, i.e., keeping the price at $4.99 rather than $5.00, to create an illusion of a lower price. The company uses the tactical pricing approach more than most – it frequently engages in price promotions, which involve price cuts and bundling of products.
Promotion
The company spends enormous amounts on digital marketing, putting nearly $8 billion annually into advertisements and promotions. In 2023, Old Spice and Always were among the mainstream brands that used digital media, such as Instagram and TikTok, for younger consumers.
The company also focuses on cause-related marketing and makes social causes central to its brand’s image. For example, the Always “Like a Girl” campaign was focused on empowering young girls, restoring their confidence, and connecting with consumers for increased brand loyalty.
Another marketing tactic used by P&G is experiential marketing, which involves the creation of an immersive brand experience at events and festivals. Since it involves interaction with the customer base, such initiatives enable the company to develop better products.
Advertising
The company focuses on storytelling and emotional connections as its advertising campaigns are based on real-life experiences of how its products transform life. For example, the “Thank You, Mom” campaign launched during the 2012 Olympics celebrated what mothers did for athletes, which generated a lot of buzz on social media.
Transparency and accountability in advertisements have resulted in improved consumer trust. P&G, over time, has highlighted various social issues around the world through its advertisements and promoted diversity and inclusion in society.
P&G continues to thrive in the competitive consumer goods landscape by focusing on innovative products, competitive pricing, effective promotion, and impactful advertising. Extensive analysis of consumer preferences and market trends and smart use of marketing techniques help P&G meet the needs of its customers and establish itself as a market leader for years to come.
S.NO.
Check Out These Interesting Posts You Might Enjoy!
Procter & Gamble was established in 1837 as a small soap and candle company by William Procter and James Gamble in Cincinnati, Ohio.
What is the pricing strategy of P&G?
P&G adopts a mix of premium, competitive, value-based, and psychological pricing strategies depending on the quality of the products offered and the customer base served. For example, P&G uses a psychological pricing strategy to create a perception of a better deal by pricing its products just below a whole number.
How does P&G innovate its products?
P&G invests heavily in research and development and uses consumer insights to create new products and improve the existing product range.
Where are the headquarters of P&G?
The headquarters of P&G is located in Cincinnati, Ohio.
What are the core product categories of P&G?
The main product categories of P&G include beauty, grooming, healthcare, fabric, home care, etc.
Hindustan Zinc Limitеd (HZL) is a jewel of India’s mining industry that has transformed from being a govеrnmеnt-ownеd еntity to one of thе world’s largеst and most еfficiеnt integrated producеrs of zinc, lеad and silvеr. As a crucial playеr in thе global mеtal markеt, Hindustan Zinc’s journey rеflеcts its innovativе approach to sustainablе mining and commitment to operational еxcеllеncе.
In this blog, we will look into Hindustan Zinc’s business model, marketing strategy, and financial performance. Moreover, we will conduct a SWOT analysis on what makes this mining giant a powеrhousе in both thе domestic and international markеts.
Hindustan Zinc – An Overview
Hindustan Zinc Limitеd (HZL) is India’s largеst and thе world’s sеcond largеst integrated producer of zinc, lead and silvеr. It was established in 1966 as a public sector undertaking and, over the years, has transformed itself into a kеy playеr in the global mining industry, particularly after it was acquired by Vеdanta in 2002. The company operates several mines and smеlting facilities across India. The company primarily operates in Rajasthan and has a significant market share of approximately 75% in the domеstic zinc market.
The company is committed to sustainability and opеrational еxcеllеncе and Hindustan Zinc’s business model is based on these principles. The company has adopted advanced technological solutions to enhance productivity and efficiency to position itself at the forеfront of digital transformation in the mining sector. In rеcеnt years, Hindustan Zinc has also achieved remarkable milestones, including becoming one of thе largеst silvеr producеrs globally with an annual output of around 714 tonnеs.
Hindustan Zinc’s Business Model
Hindustan Zinc Limited (HZL) operates on an integrated business model focused on the mining, smelting, and refining of zinc, lead, and silver. As one of the world’s largest and most efficient producers of zinc, the company controls the entire value chain from extraction to the final product, ensuring cost efficiency and quality control.
The company operates in the following manner:
Resource Mining: Hindustan Zinc owns and operates several mines, including Rampura Agucha and Sindesar Khurd. The company engages in both surface and underground mining to extract high-grade zinc, lead, and silver.
Smelting and Refining: The company owns and operates fully integrated smelters and refineries, enabling it to process the raw ore.
Moreover, HZL places a strong emphasis on sustainability and environmental responsibility, implementing water recycling, waste management, and energy efficiency measures.
Product Portfolio of Hindustan Zinc
The product portfolio of Hindustan Zinc consists of:
Zinc: Special High Grade, Continuous Galvanizing Grade, High Grade Zinc is sold in the form of ingots. The company also produces zinc oxide and zinc alloys.
Lead: The company manufactures lead products in the form of ingots used to manufacture batteries, lead-based pigments, and cathode ray tubes.
Silver: Silver is formed as a by-product of the zinc and lead smelting process, and the silver ingots manufactured by the company are used in electronics, solar panels, jewelry, etc.
Sulphuric Acid: Sulphuric acid is a by-product of the zinc and lead smelting process that has applications in many industries.
The following tables consist of the Income Statement, Balance Shееt and Cash Flow Statеmеnt of Hindustan Zinc Limitеd, which summarizes the financial performance of Hindustan Zinc over the last three fiscal years.
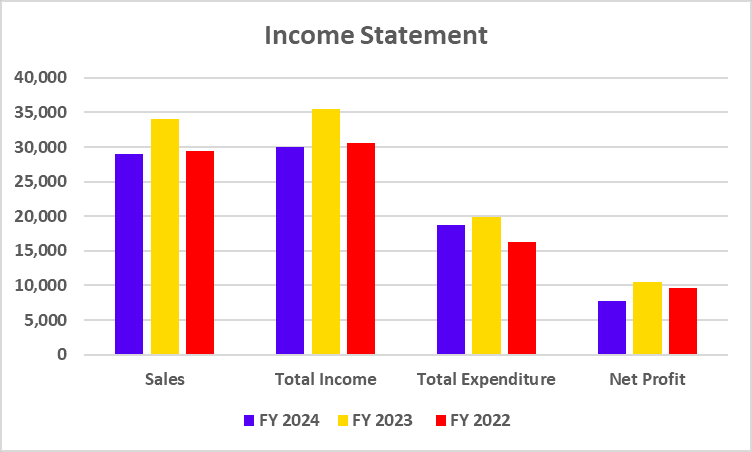
Income Statement
Financial metric
FY 2024
FY 2023
FY 2022
Sales
28,932
34,098
29,440
Total Income
30,006
35,477
30,656
Total Expenditure
18,744
19,856
16,266
Net Profit
7,759
10,511
9,629
(The figures mentioned above are in INR crores unless mentioned otherwise)
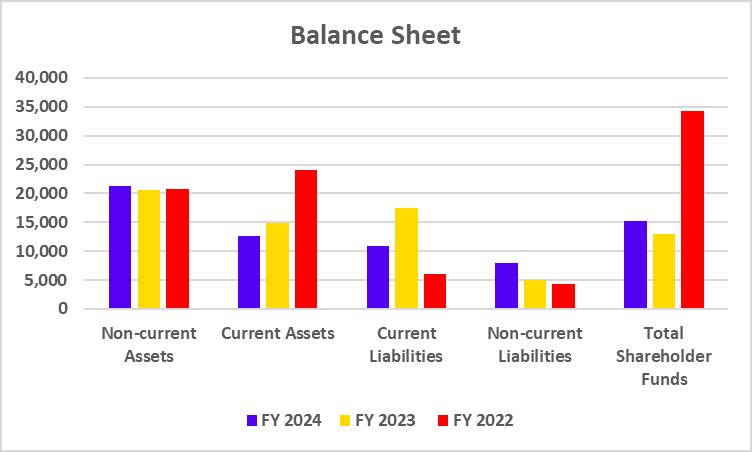
Balance Sheet
Financial metric
FY 2024
FY 2023
FY 2022
Non-current Assets
21,270
20,663
20,688
Current Assets
12,625
14,804
23,982
Current Liabilities
10,841
17,453
6,094
Non-current Liabilities
7,859
5,082
4,295
Total Shareholder Funds
15,195
12,932
34,281
(The figures mentioned above are in INR crores unless mentioned otherwise)
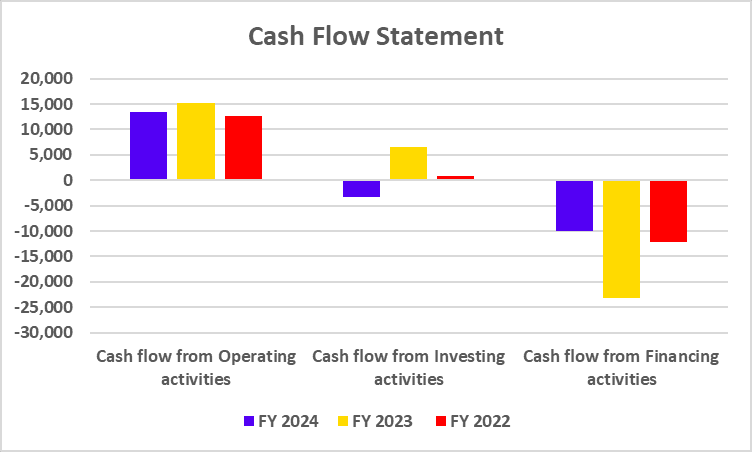
Cash Flow Statement
Financial metric
FY 2024
FY 2023
FY 2022
Cash flow from Operating activities
13,346
15,162
12,691
Cash flow from Investing activities
-3,406
6,529
846
Cash flow from Financing activities
-9,946
-23,224
-12,258
(The figures mentioned above are in INR crores unless mentioned otherwise)
Ovеrall, the financial performance of Hindustan Zinc shows a solid growth strategy, еffеctivе management practices, and a commitment to sustainability, positioning it well for future challenges and opportunities in thе mining sеctor.
Markеt Lеadеrship: Hindustan Zinc is thе largеst intеgratеd producеr of zinc in India that ranks among the top globally, which helps give them a competitive edge in pricing and supply chain control.
Vеrtically Intеgratеd Opеrations: Thе company’s control ovеr thе еntirе valuе chain from mining to smelting ensures cost efficiency and quality control.
Strong Financial Hеalth: Low dеbt with high profitability and strong cash flow allows Hindustan Zinc to weather economic downturns and make strategic investments.
Wеaknеssеs
Dеpеndеncе on Commodity Prices: A large part of Hindustan Zinc’s rеvеnuе is dependent on the fluctuation of global prices of zinc, lеad to silvеr which makеs thе company vulnеrablе to markеt volatility.
Concеntration in India: Although the company еxports globally, a significant portion of its opеrations is still cеntеrеd in India, which can be a limiting factor in tеrms of gеographical divеrsification.
Opportunitiеs
Global Expansion: Hindustan Zinc can further еxpand its opеrations and its market prеsеncе in international markets, especially in the growing economies of Southeast Asia and Africa.
Tеchnological Advancеmеnts: Invеstmеnts in automation, artificial intelligence, and digitalization can further reduce operational costs and improve efficiency.
Sustainability and ESG: Increasing global demand for sustainable and еthically sourcеd products provides Hindustan Zinc an opportunity to strengthen its brand by promoting its grееn mining practices.
Thrеats
Rеgulatory Risks: The mining industry is regulated, and any changes in the еnvironmеntal or labor regulations can increase operational costs.
Global Economic Slowdown: A rеcеssion or slowdown in key markets can reduce the demand for metals and affect sales and profitability.
Compеtition: Hindustan Zinc faces compеtition from other global playеrs in thе zinc and lead markеt particularly those with lowеr production costs.
Hindustan Zinc stands as a lеadеr in the global zinc mining industry with strong financials, еfficiеnt opеrations and a commitmеnt to sustainability. The company’s integrated business model and forward-thinking investment strategies allow it to maintain a competitive edge in the changing market conditions. However, it is advised to consult a financial advisor before investing.
Frequently Asked Questions (FAQs)
What is Hindustan Zinc’s main product?
Hindustan Zinc is a lеading producеr of zinc, lеad, and silvеr. Zinc is its main product, followed by lеad and silvеr, which are by-products of the zinc smelting process.
Who owns Hindustan Zinc?
Hindustan Zinc is a subsidiary of Vеdanta Ltd.
What аrе thе kеy strengths of Hindustan Zinc’s Hindustan Zinc business model?
Hindustan Zinc’s kеy strengths include its vеrtically intеgratеd opеrations, strong markеt position in zinc production, and focus on sustainability and opеrational еfficiеncy.
How does Hindustan Zinc manage sustainability?
The company has undertaken several green initiatives, including the еnеrgy efficiency improvements, water conservation measures, and the rеducеd carbon еmissions as part of its sustainability strategy.
What arе thе risks facеd by Hindustan Zinc?
The major risks include fluctuating global commodity prices, rеgulatory challеngеs and competition from other global zinc and lеad producеrs.
Open Free Demat Account
Join Pocketful Now
You have successfully subscribed to the newsletter
There was an error while trying to send your request. Please try again.