In a world where personal care is of utmost importance, few brands have made a lasting impact comparable to Gillette. Founded by the visionary King Camp Gillette, this company has been a leading manufacturer of shaving products for more than a century. The company has evolved to become a household name in India.
In this blog, we will analyze Gillette’s history, business model, and product range and do a SWOT analysis.
Gillette India Company Overview
Gillette India is a subsidiary of the global giant Procter & Gamble (P&G). It was founded in 1984 as Indian Shaving Products Limited. However, its parent company has a long history dating back to 1837. In 2000, Gillette expanded its portfolio by merging with Duracell and Wilkinson Sword India. Both the products were highly successful and contributed to the company’s growth. The company has successfully cemented its dominant position in the Indian shaving product market over the years. It has captured a large part of the market by offering products that suit Indian consumer preferences. Today, Gillette India is known for its excellent shaving products in the country. The brand’s products are easy to find in retail stores, and consumers remember the brand well.
Business Model & Services Provided By Gillette India
The company specializes in the production of branded packaged fast-moving consumer goods, focusing on the grooming and oral care sectors. It is a prominent FMCG company that holds the two iconic brands in its portfolio, Gillette and Oral-B, both of which are recognized as global leaders in their respective markets.
Gillette’s business model revolves around selling razors at minimal or even negative profit margins while reaping profits primarily from the sale of replacement blades. The company sells razors, razor blades, stylers, shaving gel, shaving cream, and after-shave products. The major brands owned by Gillette include Fusion5, Mach 3, Guard 3, etc.
Read Also: Colgate Palmolive India Case Study
Financial Statements of Gillette India
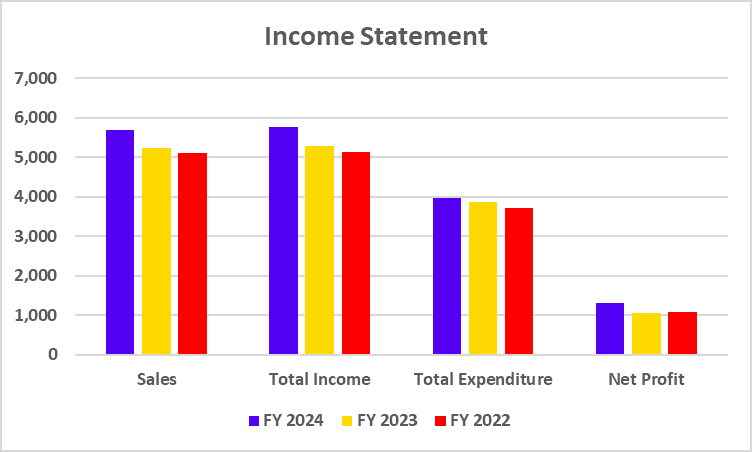
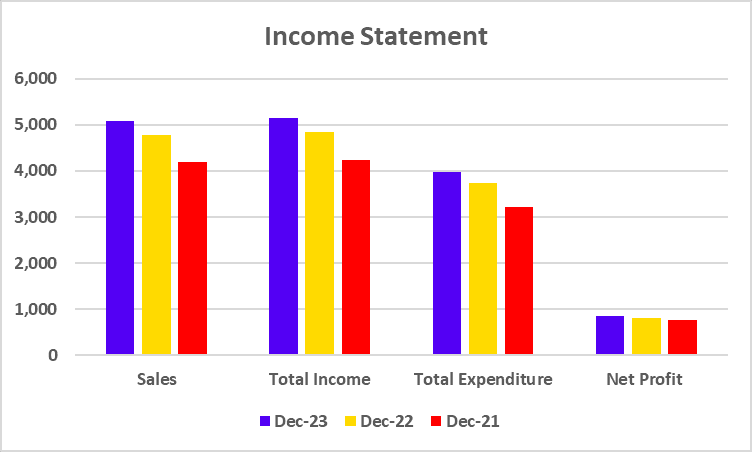
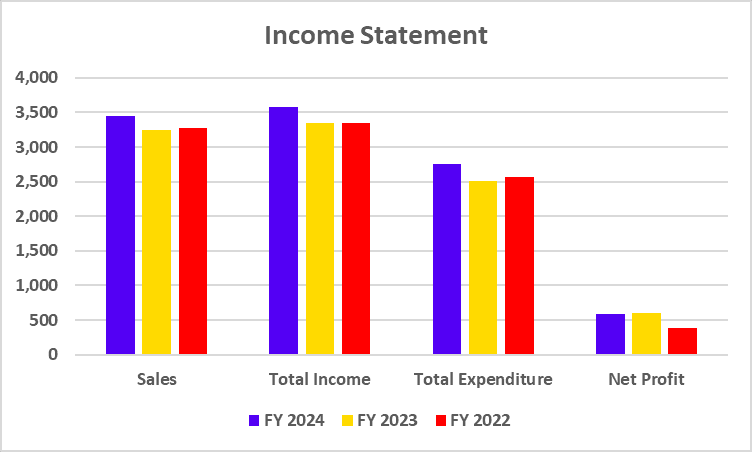
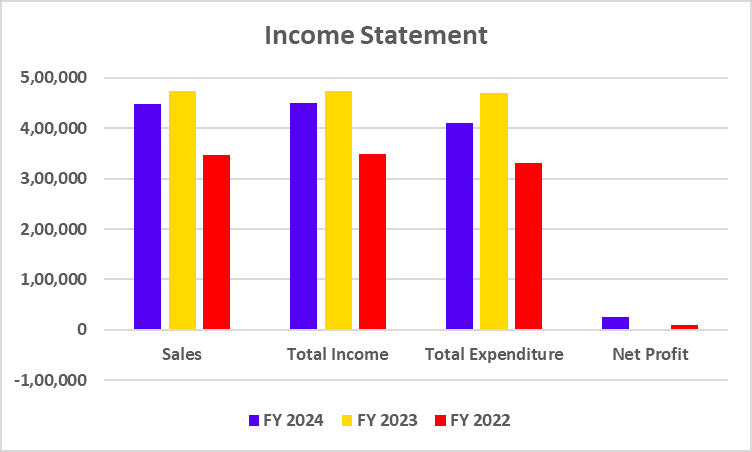
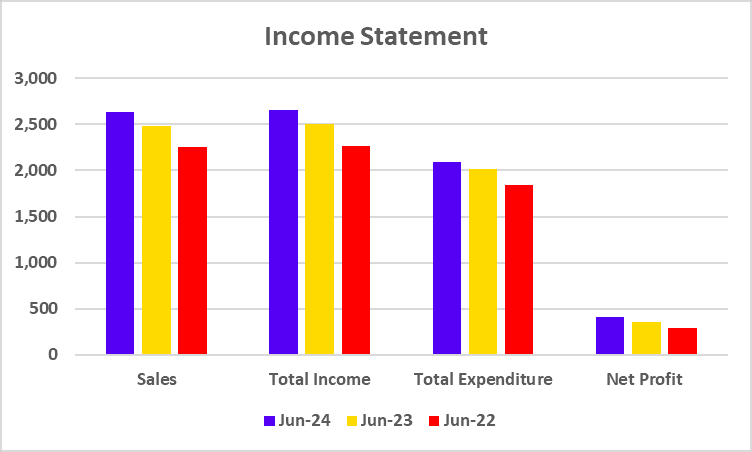
Income Statement
| Particulars | June 2024 | June 2023 | June 2022 |
|---|---|---|---|
| Sales | 2,633 | 2,477 | 2,256 |
| Total Income | 2,659 | 2,499 | 2,263 |
| Total Expenditure | 2,088 | 2,018 | 1,842 |
| Net Profit | 411 | 355 | 289 |
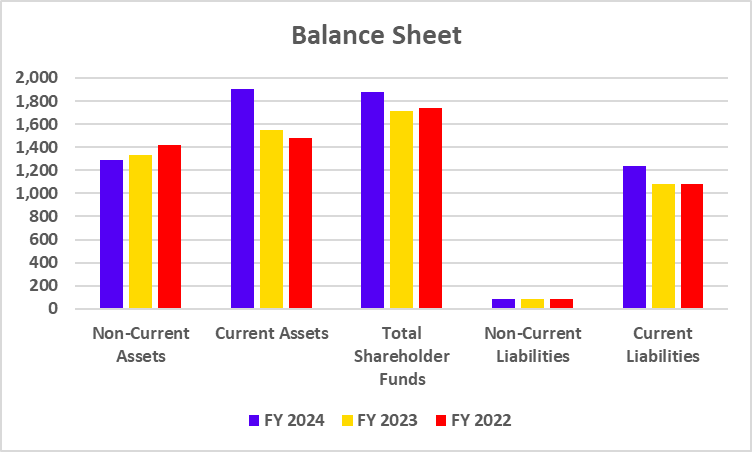
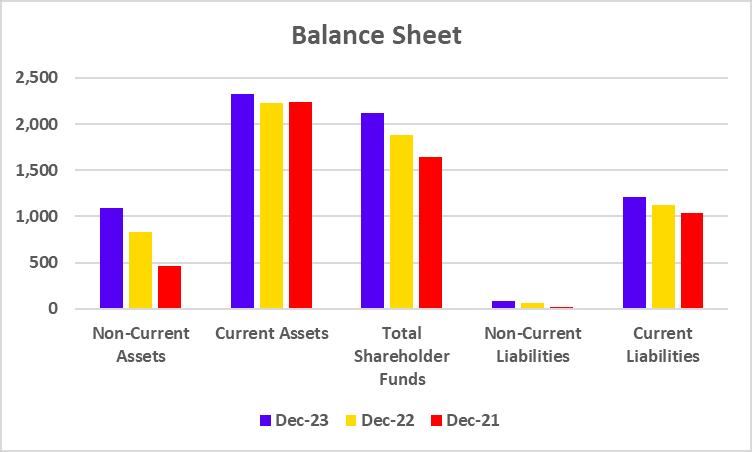
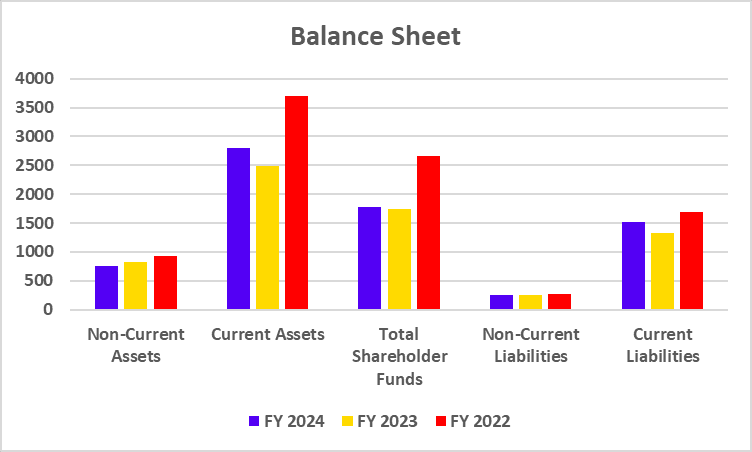
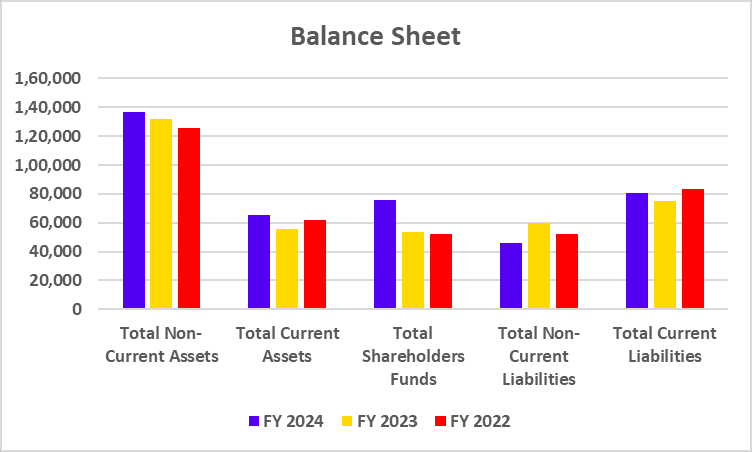
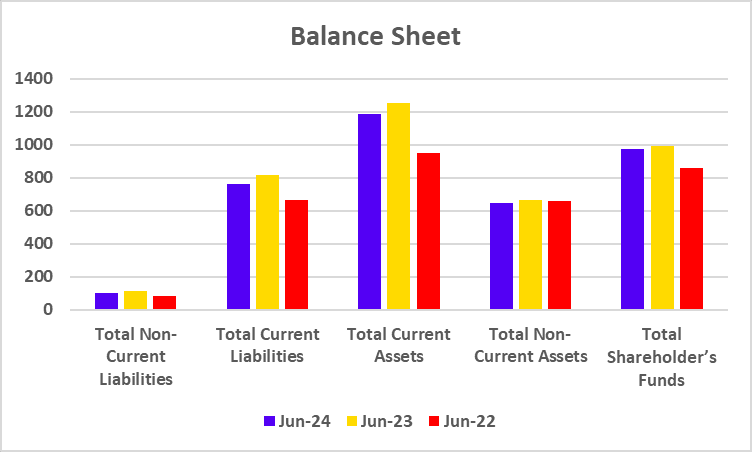
Balance Sheet
| Particulars | June 2024 | June 2023 | June 2022 |
|---|---|---|---|
| Total Non-Current Liabilities | 100 | 111 | 83 |
| Total Current Liabilities | 759 | 816 | 664 |
| Total Current Assets | 1,187 | 1,250 | 952 |
| Total Non-Current Assets | 644 | 666 | 656 |
| Total Shareholder’s Funds | 971 | 989 | 861 |
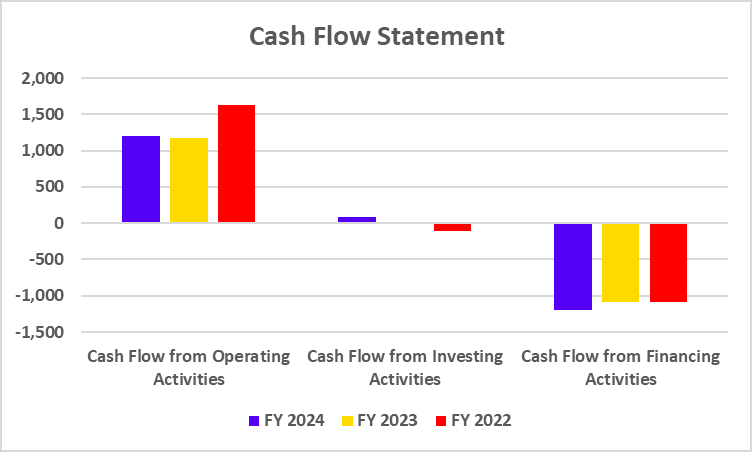
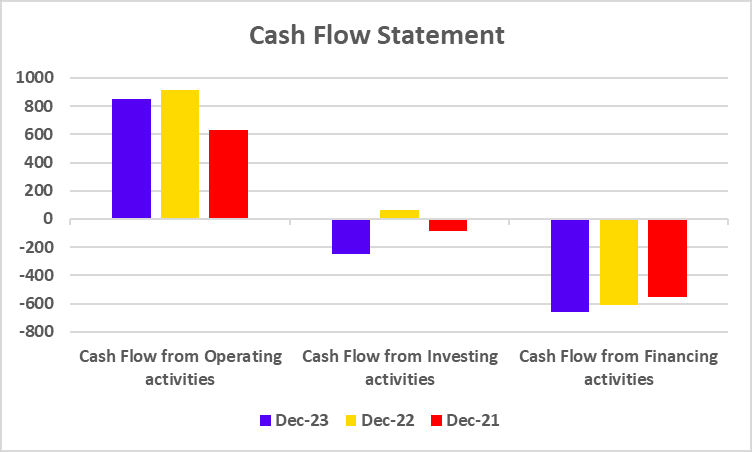
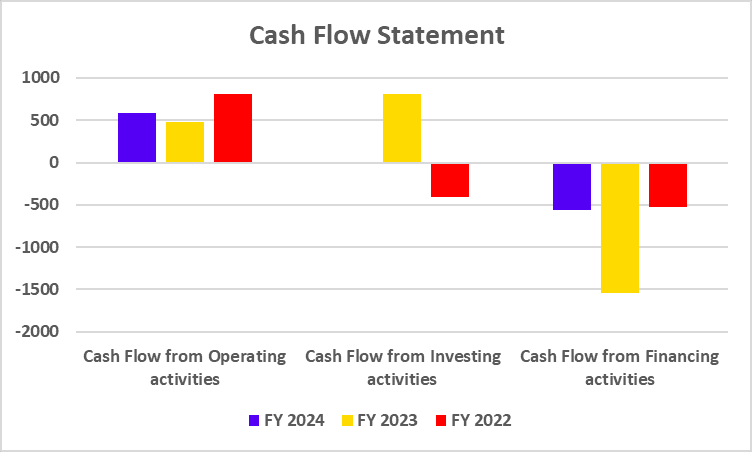
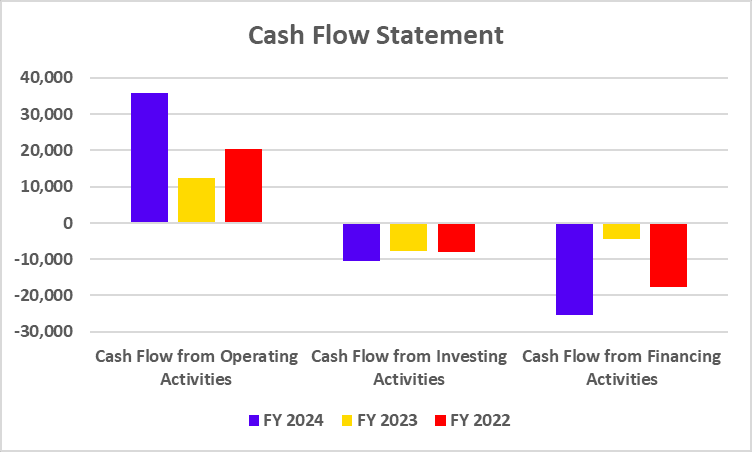
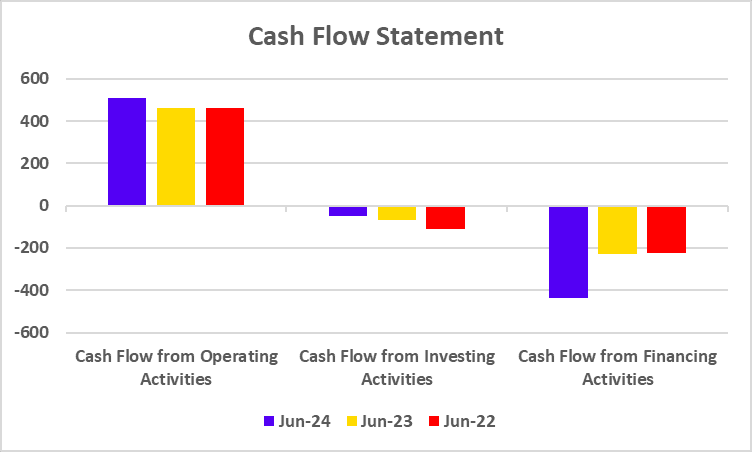
Cash Flow Statements
| Particulars | June 2024 | June 2023 | June 2022 |
|---|---|---|---|
| Cash Flow from Operating Activities | 509 | 462 | 461 |
| Cash Flow from Investing Activities | -49 | -66 | -112 |
| Cash Flow from Financing Activities | -439 | -231 | -224 |
Key Performance Indicators
| Particulars | FY 2024 | FY 2023 | FY 2022 |
|---|---|---|---|
| Operating Profit Margin (%) | 21.68 | 19.40 | 18.69 |
| Net Profit Margin (%) | 15.63 | 14.35 | 12.82 |
| ROE (%) | 42.38 | 35.96 | 33.59 |
| ROCE (%) | 53.26 | 43.68 | 44.66 |
| Debt-to-Equity | 0 | 0 | 0 |
Read Also: Castrol India Case Study
SWOT Analysis of Gillette India
Strengths
- Gillette is a renowned global brand that is celebrated for its enduring commitment to quality that meets customer needs and preferences.
- As a subsidiary of Procter & Gamble, Gillette leverages a vast distribution network that enables it to reach both urban and rural markets effectively.
- The company is known for its innovative shaving products, including disposable blades and multi-blade cartridges.
Weaknesses
- Gillette products, especially the premium range, tend to be on the pricier side when compared to other brands in the market.
- The company’s business model depends on disposable products, which makes it unsustainable in the long run.
- Gillette still earns a large part of its revenue from razors despite expanding its product line. This makes the company vulnerable to market changes and shifts in consumer behavior.
Opportunities
- India’s grooming market is growing rapidly, with more men buying personal care products. Gillette can take advantage of this emerging trend and expand its lineup of grooming products.
- The growing demand for women’s grooming products presents a significant opportunity for Gillette. By placing a stronger emphasis on the Gillette Venus range, the company can expand its presence and secure a large share of the women’s market.
- Given the growth of e-commerce and digital platforms, Gillette has an opportunity to enhance its online sales channels and connect with a broader audience.
Threats
- The shaving products market is fiercely competitive, with competitors providing comparable products and implementing aggressive pricing strategies.
- Alterations in import duties, fluctuations in raw material prices, or shifts in government regulations regarding consumer goods can significantly affect the profitability of the company.
- Emerging technologies and innovations in the shaving industry have the potential to challenge Gillette’s market dominance.
Read Also: Nestle India Case Study
Conclusion
Gillette, a well-known name in the shaving industry, has a robust foundation in innovation, exceptional brand recognition, and a commanding market presence. Nonetheless, the company is grappling with numerous challenges, such as fierce competition, environmental issues, and the possibility of changing consumer preferences. To retain its position as a market leader, Gillette must prioritize product innovation, broaden its product offerings, and tackle environmental challenges. The company can achieve long-term success by using its strengths and addressing its weaknesses in the competitive market. It is advised to consult a financial advisor before investing.
Frequently Asked Questions
When was the first Gillette razor launched?
The first Gillette safety razor was launched in 1903.
What are some of Gillette’s competitors?
Gillette’s main competitors include Schick, Wilkinson Sword, and Harry’s.
Where is the headquarters of Gillette?
The headquarters of Gillette are in Boston, United States.
What are Gillette’s current market price and market capitalization?
Gillette’s current market price is INR 9,006, and its market capitalization is INR 29,351 crores as of 18 September 2024.
What is Gillette’s slogan?
The company’s famous slogan is “The Best a Man Can Get.”