Searching for a bank that offers you all the services you need at your fingertips and also provides a safe place to park your hard-earned money. Its commitment to innovation and technological advancements has transformed the way banking is conducted.
In this blog, we will discuss the specifics of Indusind Bank Ltd, its business model, products, and services, and do a SWOT analysis.
Overview of IndusInd Bank Ltd.
The IndusInd Bank was established by Srichand P. Hinduja, a renowned Indian businessman. In 1994, it was granted a banking license by the RBI and issued an IPO in 1997. Beginning in 2000, the bank began to spread across the country. In 2001, the bank introduced mobile banking services and ‘IndusNet,’ its internet banking platform. The bank expanded its operations into rural and semi-urban areas when it purchased Bharat Financial Inclusion Limited later in 2019. The bank operates more than 2900 ATMs and more than 3000 branches in India. The organization’s headquarters is in Mumbai.
Business Model of IndusInd Bank Ltd.
The bank is continuously developing innovative financial products and is leveraging technology to increase its efficiency. The bank has forged several strategic alliances with other financial organizations to increase the variety of products it offers and market share. The principal revenue stream for the bank is interest income obtained from the different kinds of loans it has granted, such as personal, house, and auto loans. In addition to this, they receive fees for providing debit cards, credit cards, currency, and other services.
Products & Services of IndusInd Bank Ltd.
The bank serves both corporate and retail clientele. They provide savings, current, fixed, and recurring deposit accounts, and various lending services, such as home and auto loans, to retail clients. They provide a range of credit facilities for working capital, term loans, overdrafts, etc., to large corporate clients and SMEs. In addition, the bank provides its clients with foreign exchange services, financial consulting services, and customized asset management services for high-net-worth individuals.
Read Also: Rupay Case Study: Features, Timeline, Types, Growth, and Comparison
Market Details of IndusInd Bank Ltd.
| Current Market Price | INR 1,463 |
| Market Capitalization (In Crores) | INR 1,13,987 |
| 52 Week High | INR 1,694 |
| 52 Week Low | INR 1,329 |
| Book Value | INR 807 |
| P/E Ratio (x) | 12.8 |
Financial Statements of IndusInd Bank Ltd. Case Study
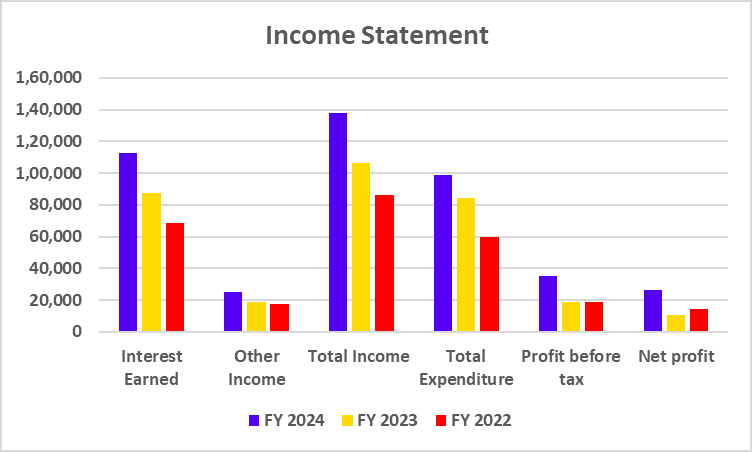
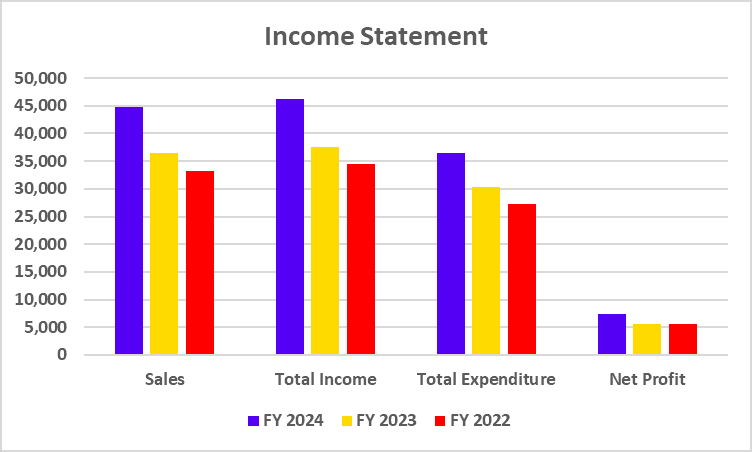
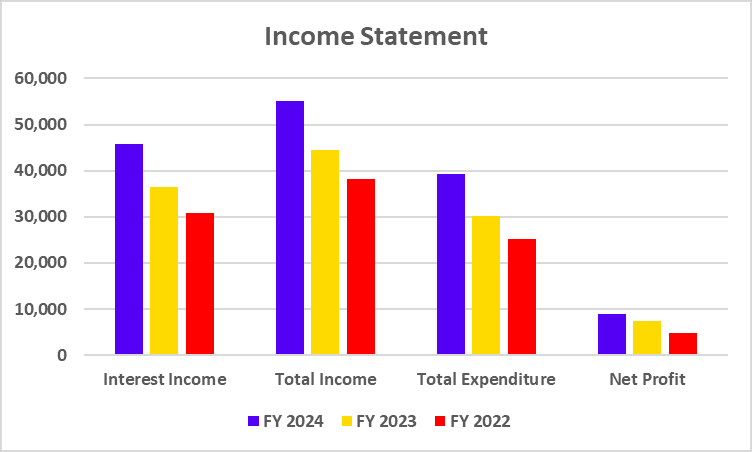
Income Statement
| Particulars | FY 2024 | FY 2023 | FY 2022 |
|---|---|---|---|
| Interest Income | 45,748 | 36,367 | 30,822 |
| Total Income | 55,143 | 44,540 | 38,230 |
| Total Expenditure | 39,279 | 30,121 | 25,132 |
| Net Profit | 8,977 | 7,443 | 4,805 |
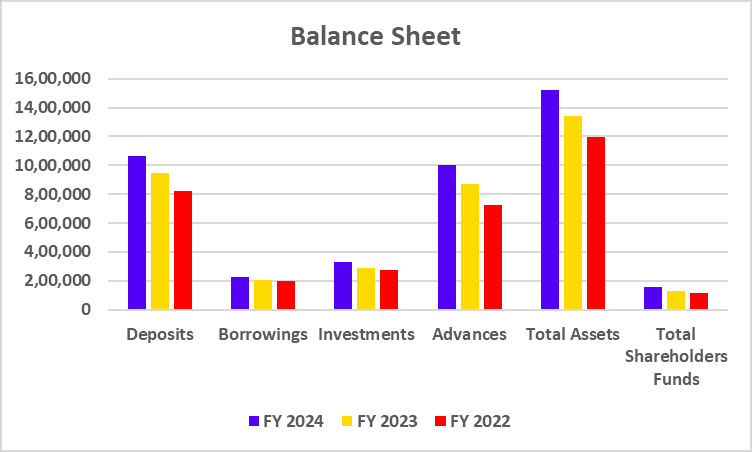
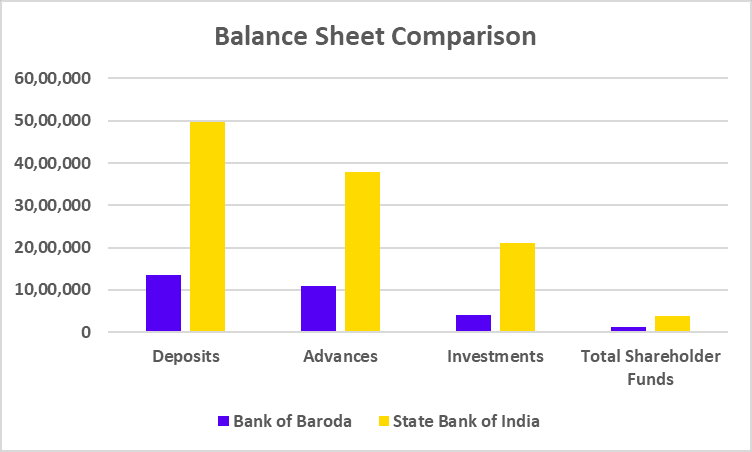
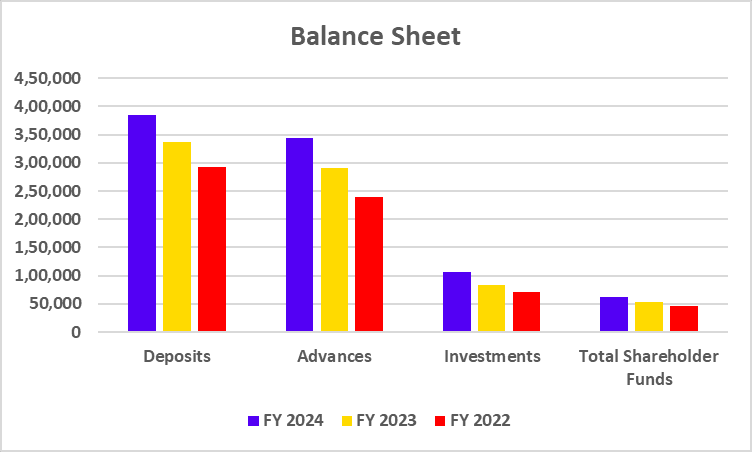
Balance Sheet
| Particulars | FY 2024 | FY 2023 | FY 2022 |
|---|---|---|---|
| Deposits | 3,84,585 | 3,36,120 | 2,93,349 |
| Advances | 3,43,298 | 2,89,923 | 2,39,051 |
| Investments | 1,06,486 | 83,075 | 70,929 |
| Total Shareholder Funds | 62,030 | 53,882 | 46,928 |
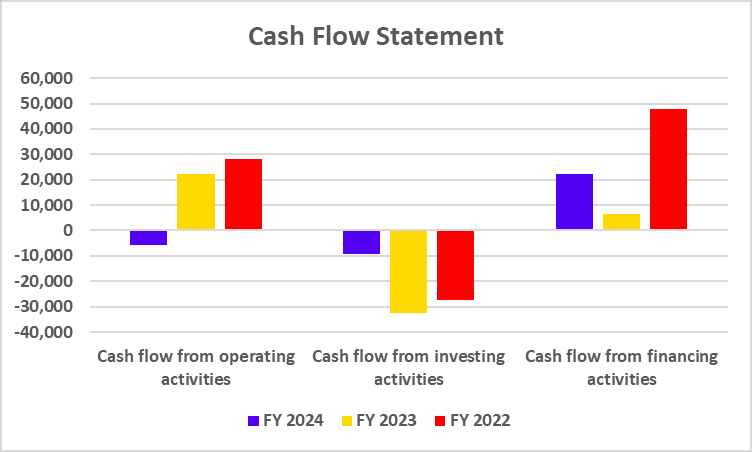
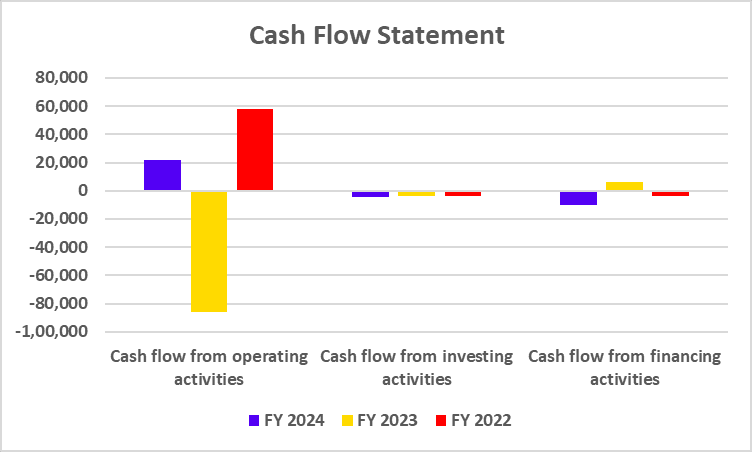
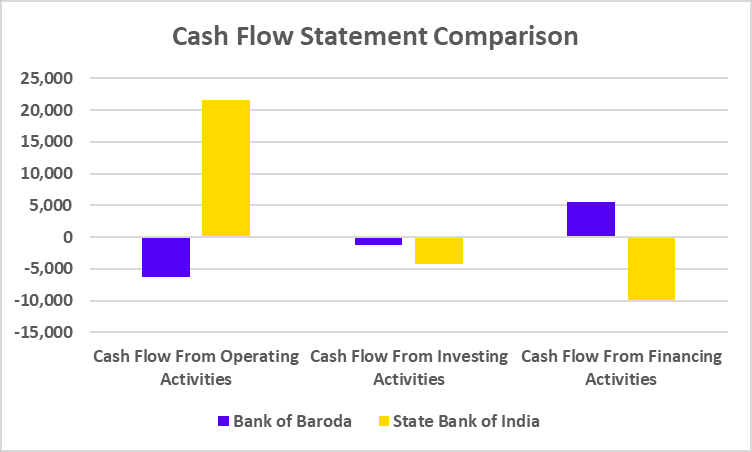
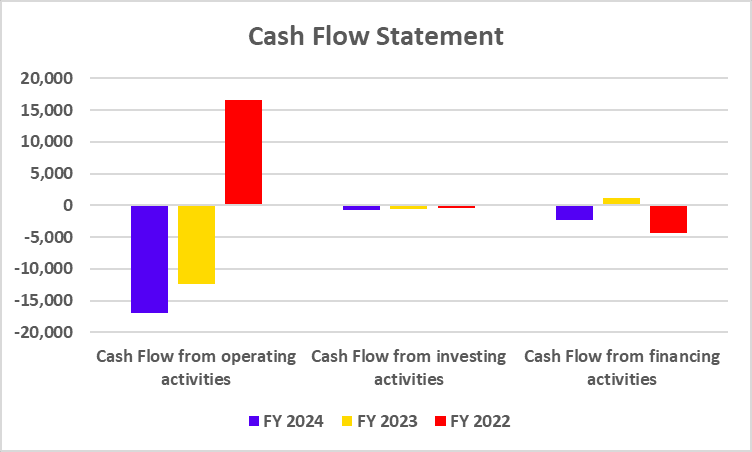
Cash Flow Statement
| Particulars | FY 2024 | FY 2023 | FY 2022 |
|---|---|---|---|
| Cash Flow from operating activities | -16,924 | -12,442 | 16,672 |
| Cash Flow from investing activities | -711 | -560 | -406 |
| Cash Flow from financing activities | -2,241 | 1,114 | -4,302 |
Key Performance Indicators (KPIs)
| Particulars | FY 2024 | FY 2023 | FY 2022 |
|---|---|---|---|
| Net Interest Margin (%) | 4 | 3.84 | 3.73 |
| Net Profit Margin (%) | 19.62 | 20.46 | 15.58 |
| Return on Equity (%) | 14.26 | 13.60 | 10.06 |
| Return on Capital Employed (%) | 3.20 | 3.27 | 3.36 |
| CASA | 37.87 | 40.08 | 42.72 |
Read Also: Case Study on Procter & Gamble Marketing Strategy
SWOT Analysis of IndusInd Bank Ltd.
Strengths
- Brand Image – Indusind Bank has established a strong brand image and is seen as a dependable bank.
- Diversified Product Portfolio – The bank provides a range of products to its clientele, including loans, investment services, and several kinds of savings accounts.
- Loan Book – An indication of the company’s strong financial standing is the expansion of its loan book on an annual basis.
Weakness
- Market Share – The bank’s market share is comparatively smaller than that of the other participants in the industry.
- Limited Geographical Reach – The bank’s limited geographical presence limits its potential for growth because it has concentrated on specific regions of the nation.
- Wholesale Borrowing – Most of the bank’s borrowing comes from wholesale borrowing, which raises borrowing costs.
Opportunities
- Cross-Selling – The bank can sell other financial products to exploit cross-selling opportunities, which will boost their earnings.
- Digital Inclusion – The bank may take advantage of this growth in internet usage by adding additional digital products.
- Rural Areas – The bank can increase its market share by reaching out to untapped semi-urban and rural areas.
Threat
- Competition – IndusInd Bank faces fierce competition from well-established government and private banks.
- Cyber Security Risk – Since banks rely on digital technologies to store their data, any type of cyberattack will compromise the bank’s integrity.
- Government Policies – Since the Indian banking sector is so heavily regulated, any changes to the laws could have an impact on the bank’s operations.
Conclusion
Within the Indian banking sector, the IndusInd Bank has made a big name for itself. The bank responds to the evolving digital technology landscape by providing its clients with innovative financial products. IndusInd Bank can increase its market share by expanding its operations in rural and semi-urban areas. However, one should speak to a financial advisor before making investment decisions.
Frequently Asked Questions (FAQs)
Who is the current MD and CEO of IndusInd Bank?
Mr Sumant Kathpalia is the current MD and CEO of IndusInd Bank as of 13 September 2024.
Is Indusind Bank a profitable bank?
IndusInd Bank is profitable as it has declared net profits of 8,977 crores in FY 2024 and 7,443 crores in FY 2023.
Where is the headquarters of Indusind Bank situated?
The headquarters of IndusInd Bank is situated in Mumbai.
IndusInd Bank is a large-cap or mid-cap company?
IndusInd Bank is classified as a large-cap firm by market capitalization as of 13 September 2024.
When was Indusind Bank Limited established?
Mr S.P. Hinduja established the IndusInd Bank in 1994.