In 2025, with rapid technological advancement, one trending industry that you may want to have in your portfolio is the drone industry. These stocks are becoming popular because of their diversified applications across agriculture, defense, and logistics, among others, and strong government support is being given through initiatives like the Production-Linked Incentive (PLI) Scheme.
In this blog, let’s look at the best drone stocks in India and the reasons to invest in them.
Overview of the Drone Industry
Drone stocks in India have showcased a new emerging sector at the juncture of technology, aviation, and industrial applications. Unmanned Aerial Vehicles (UAV) are pioneering ways to move forward in industries like agriculture, infrastructure, logistics, and defense. People who intend to invest in this sector get lured by the disruptive innovative capabilities and the potential of transformation across sectors that are labor-driven or dependent on conventional methods.
Top 8 Best Drone Stocks in India
The best drone stocks based on market capitalization in 2026 are:
| S.No. | Top Drone Company Stocks in India (as per Market Capitalization) |
|---|---|
| 1 | Hindustan Aeronautics Ltd (HAL) |
| 2 | Bharat Forge Ltd |
| 3 | Zen Technologies Ltd |
| 4 | RattanIndia Enterprises |
| 5 | Paras Defense & Space Technologies Ltd |
| 6 | IdeaForge Technology Ltd |
| 7 | DCM Shriram Industries Ltd |
| 8 | Droneacharya Aerial Innovations Ltd |
Market Capitalisation Table of Best Drone Stocks in India
The drone stocks have been listed in descending order based on their market capitalization in the table below:
| Company | Market Capitalization (In crores) | Share Prices (In INR) | 52 Week High Price (In INR) | 52-Week Low Price(In INR) |
|---|---|---|---|---|
| Hindustan Aeronautics Ltd (HAL) | 3,27,710 | 4,900 | 5,166 | 3,046 |
| Bharat Forge Ltd | 60,631 | 1,268 | 1,626 | 919 |
| Zen Technologies Ltd | 14,486 | 1,604 | 2,628 | 945 |
| RattanIndia Enterprises | 7,878 | 57.0 | 83.0 | 37.4 |
| Paras Defence & Space Technologies Ltd | 5,995 | 744 | 972 | 401 |
| Ideaforge Technology Ltd | 2,315 | 536 | 720 | 301 |
| DCM Shriram Industries Ltd | 1,453 | 167 | 215 | 142 |
| Droneacharya Aerial Innovations | 154 | 64.4 | 152 | 58.0 |
Best Drone Stocks in India 2026 – An Overview
The best drone stocks in India are given below, along with a brief overview of the services they provide:
1. Hindustan Aeronautics Ltd (HAL)
Hindustan Aeronautics Limited is one of the pillars of India’s aerospace industry, with experience in aircraft and helicopter design, manufacturing, repair, upgrade, and related component designing and manufacturing. TAPAS (Tactical Airborne Platform for Aerial Surveillance) is being developed to perform intelligence, surveillance, and reconnaissance roles. Traditionally a partner to major aerospace companies worldwide, HAL has significantly enhanced India’s defense capability.
2. Bharat Forge Ltd
Bharat Forge Limited is an Indian MNC that operates in the forging, automotive, energy, and defense industries. It was founded in 1961 by Nilkantharao A. Kalyani. Kalyani Strategic Systems Limited (KSSL) is a subsidiary of Bharat Forge that recently launched “BHARAT 150” with a maximum take-off weight of 150 kg and a range of up to 200 km. Having its headquarters in Pune, India, the group has managed to build a brand synonymous with engineering excellence and innovation in manufacturing critical components for both automotive and aerospace industries alike.
3. Zen Technologies Ltd
Zen Technologies Ltd. was incorporated in 1993 and is one of the leading companies dealing with drones. The company offers counter-drone systems to detect and disrupt the communication system of the enemy drone. Another key offering is combat training solutions for the defense and security forces. It identifies itself as a major contributor in the field of defense and has over 40 products being used all over the globe. Zen Technologies has built strong R&D capabilities and has over 150 patents.
4. RattanIndia Enterprises
RattanIndia Enterprises is contributing to the drone industry via its subsidiary NeoSky. The company plans to offer drones as a service and product to its target audience. NeoSky works on tapping drone technology for various diverse applications, starting from agriculture, infrastructure monitoring, and logistics. With a strong focus on innovation and efficiency, the company aims to use UAVs to solve most modern-day problems across different sectors. It visualizes itself as playing a definitive role in the country’s evolving drone ecosystem.
5. Paras Defence & Space Technologies Ltd
Paras Defence & Space Technologies Ltd is amongst the most prominent companies in the defense and space sectors, and it has a basket of hi-tech solutions. Business offerings range from defense electronics, aerospace and space systems, communication systems, electro-optic devices, and defense and space components. Paras Aerospace Pvt. Ltd. is its subsidiary, which is involved in drones, drone services, and associated technologies. It also has a subsidiary named Paras Anti-Drone Technologies Pvt. Ltd., which develops RF & microwave systems and subsystems to counter UAVs and more. With a strong focus on innovation and quality, Paras Defense builds up India’s defense capabilities and makes vital contributions to India’s growing space exploration ventures.
6. Ideaforge Technology Ltd
Ideaforge Technology Ltd. is one of the apex companies in the domain of unmanned aerial systems, commonly known as drones in India. This company is known for its rugged and versatile UAV products currently being used in the domains of defense & homeland security and industrial applications.
It has been able to build a credible name based on innovation, picking up complex challenges in surveillance and reconnaissance and maintaining a clear lead over others in India’s drone industry.
7. DCM Shriram Industries Ltd
DCM Shriram Industries Ltd. was founded in 1990 and has operations in sugar, alcohol, industrial fibers, etc. Recently, the company acquired a 30% stake in Zyrone Dynamics, a Turkish drone company. The company aims to manufacture drones in India. DCM Trishul and DCM Kailash are the two prototypes developed by the company for surveillance and heavy-lifting requirements.
8. Droneacharya Aerial Innovations Ltd
Droneacharya Aerial Innovation Ltd is one of the firms known for bringing drone solutions to India’s fast-emerging UAV Sector. The company provides services with applications in a wide range of industries, from agriculture and infrastructure to surveillance and disaster management. With a strong core philosophy of bringing in innovation and exceptionally strong technological expertise, Droneacharya envisions improving operational efficiencies and safety standards across industries.
Comparative Study of Drone Stocks
Performance of Drone Stocks
The table below shows the Best Drone Stocks based on 6-month and 1-year returns.
| Company | 6 Month Return | 1 Year Return |
|---|---|---|
| Hindustan Aeronautics Ltd (HAL) | 69.33% | 161.02% |
| Bharat Forge Ltd | 32.73% | 86.48% |
| Zen Technologies Ltd | 83.70% | 129.90% |
| RattanIndia Enterprises | -4.64% | 88.24% |
| Paras Defence & Space Technologies Ltd | 83.05% | 101.53% |
| Ideaforge Technology Ltd | 6.35% | -30.71% |
| DCM Shriram Industries Ltd | 31.13% | 120.66% |
| Droneacharya Aerial Innovations Ltd | -27.66% | -7.10% |
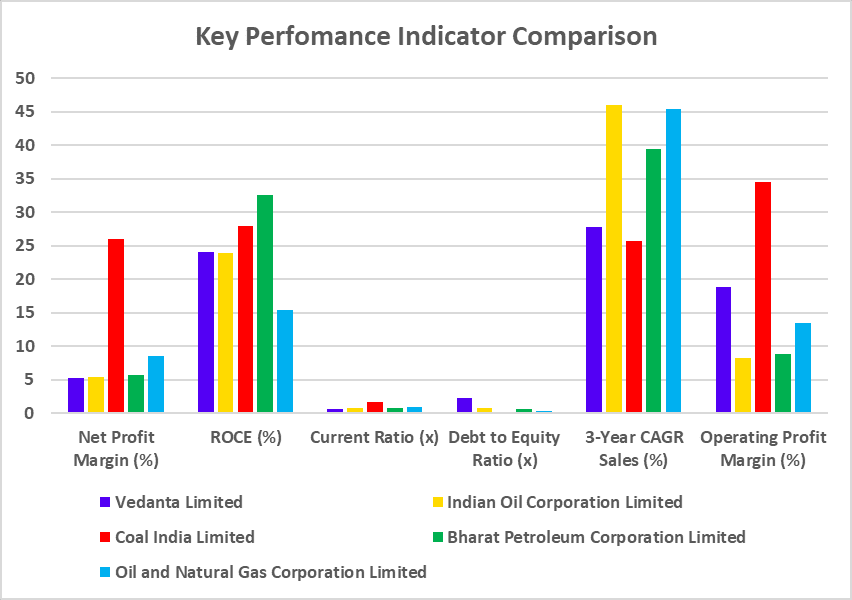
Key Performance Indicators
| Company | Net Profit Margin (%) | ROCE (%) | TTM EPS | TTM P/E (x) | P/B (x) |
|---|---|---|---|---|---|
| Hindustan Aeronautics Ltd (HAL) | 25 | 24.49 | 113.96 | 46.77 | 9.23 |
| Bharat Forge Ltd | 5.76 | 13.3 | 20.43 | 79.25 | 10.51 |
| Zen Technologies Ltd | 29.5 | 46.3 | 15.22 | 88.91 | 25.36 |
| RattanIndia Enterprises | 7.56 | 36 | 3.08 | 25.47 | 15.5 |
| Paras Defence & Space Technologies Ltd | 11.86 | 9.8 | 8.77 | 159.1 | 12.19 |
| Ideaforge Technology Ltd | 14.41 | 9.6 | 11.07 | 75.84 | 5.43 |
| DCM Shriram Industries Ltd | 5.52 | 20.6 | 13.26 | 16.96 | 2.4 |
| Droneacharya Aerial Innovations Ltd | 17.56 | 11.65 | 2.58 | 55.79 | 4.7 |
Benefits of Investing in Drone Stocks
The benefits of investing in drone stocks are:
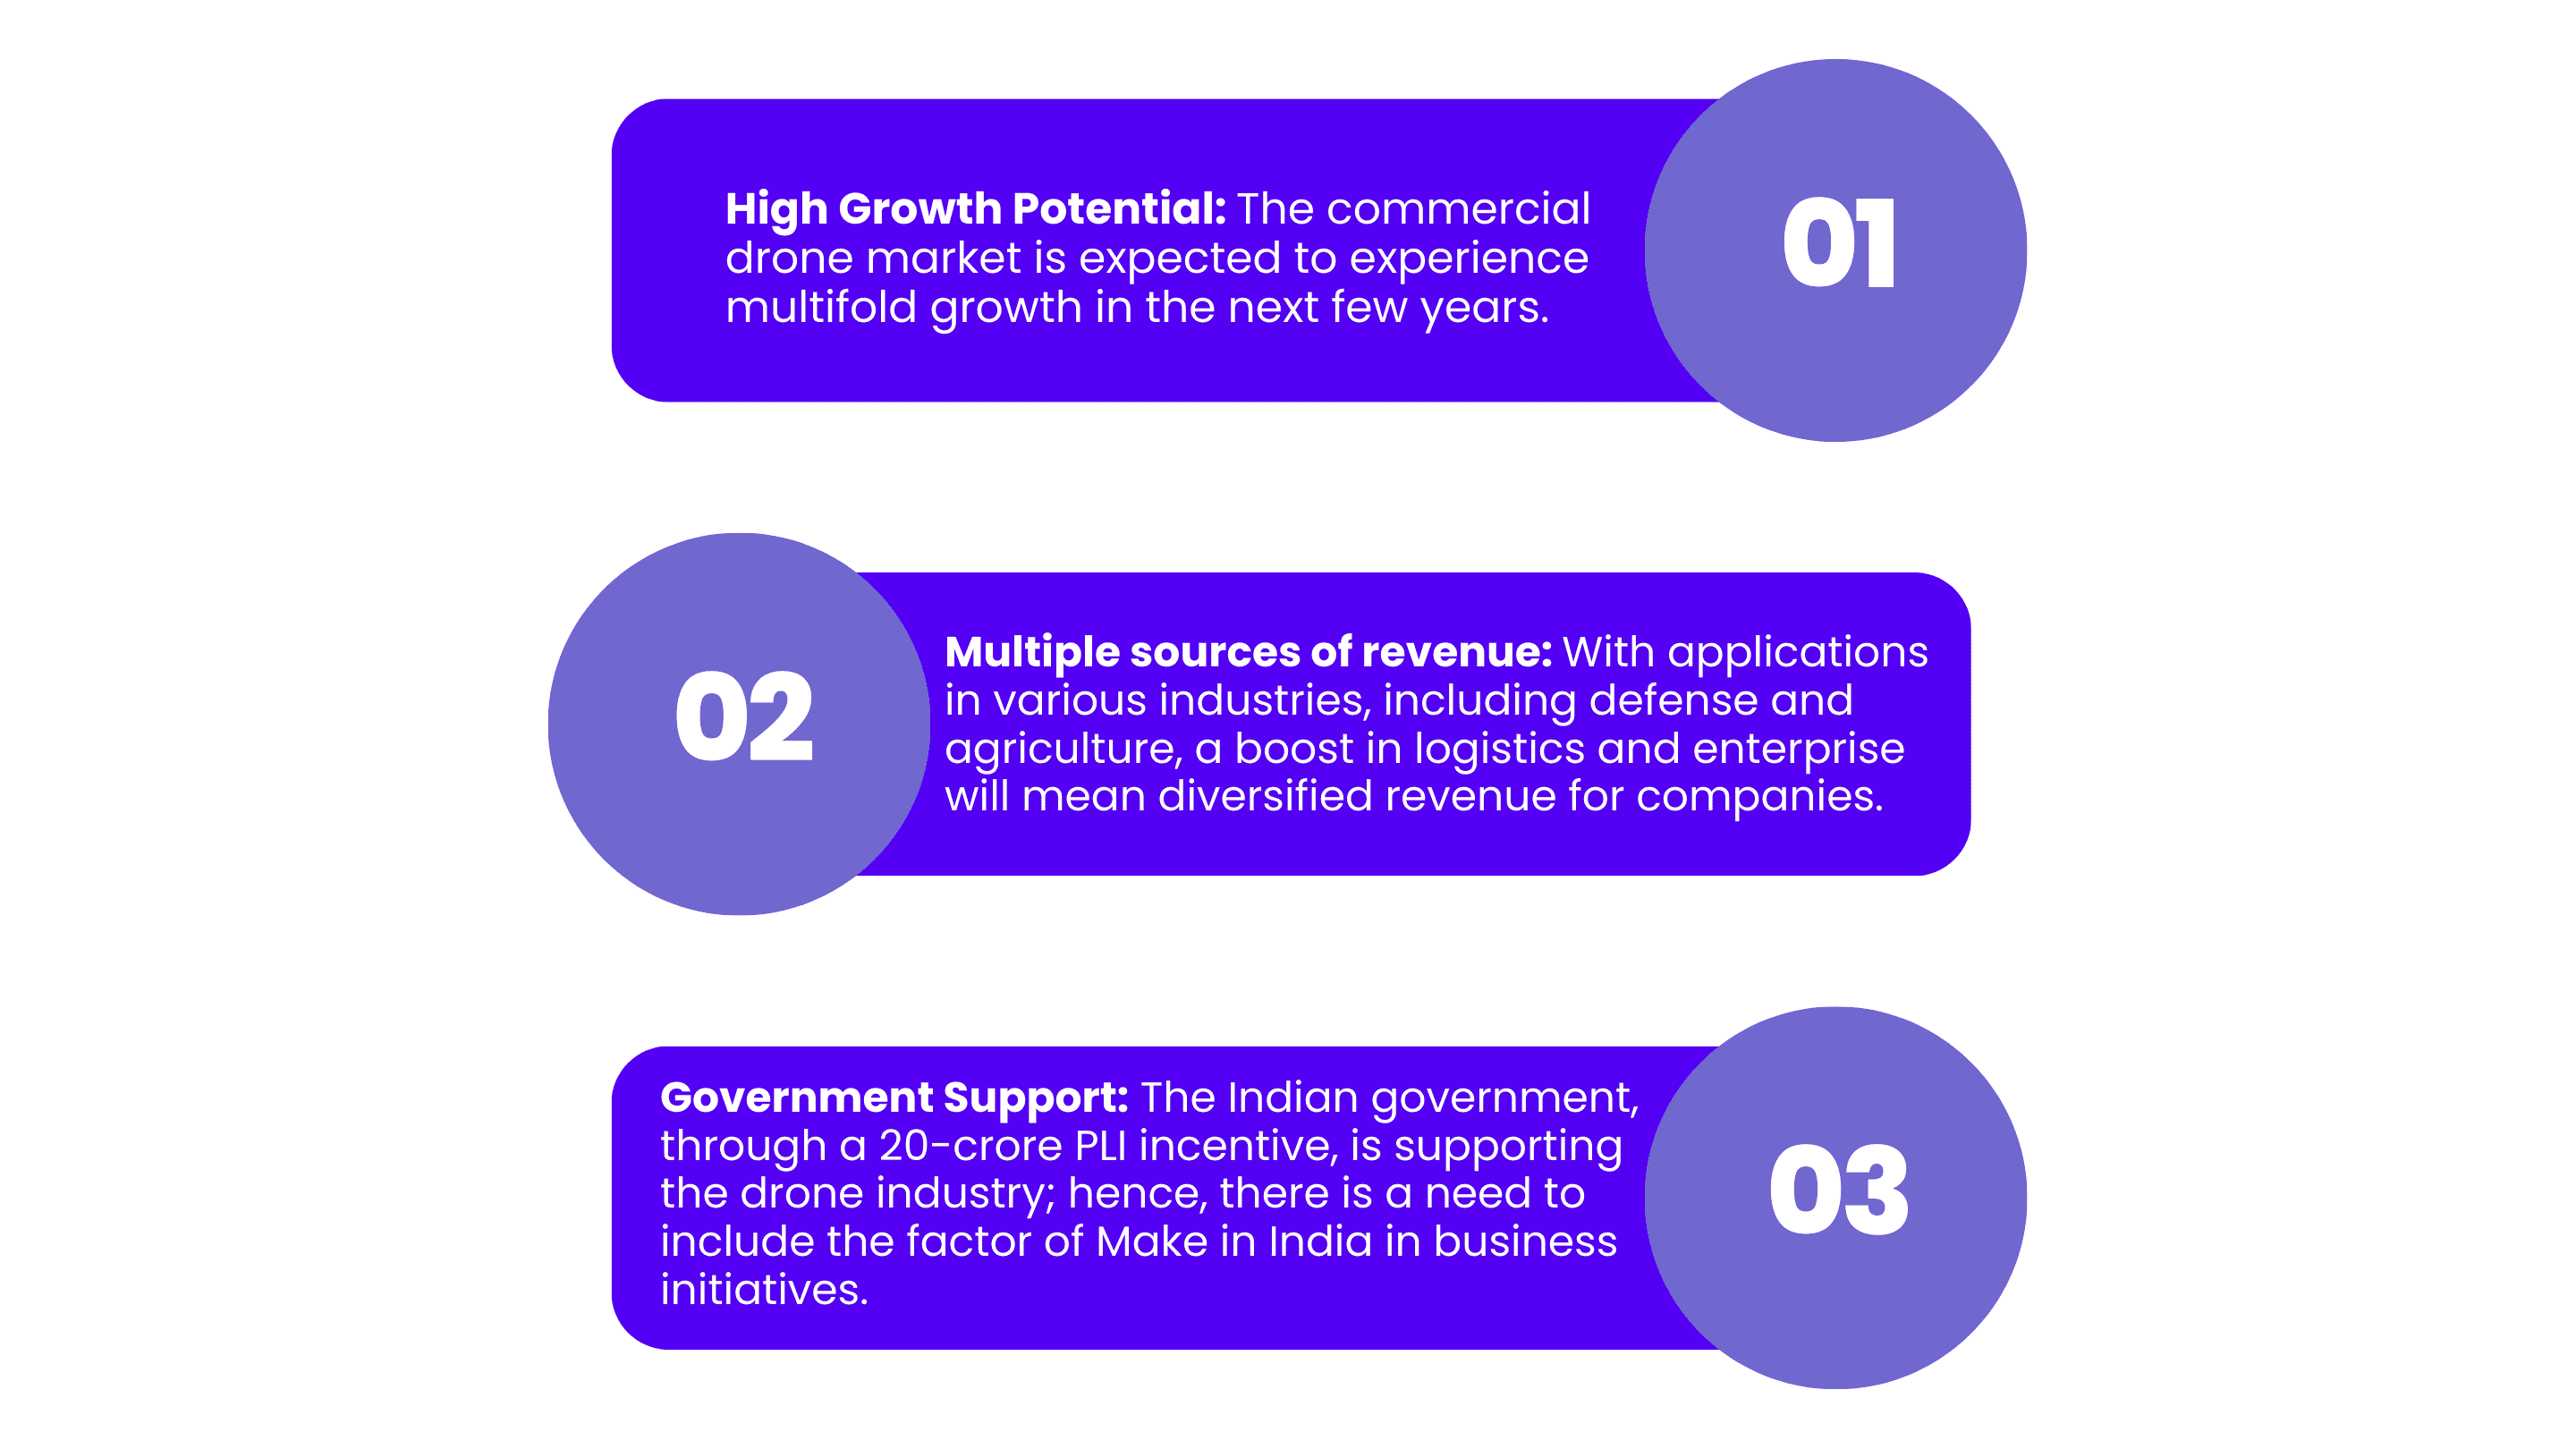
- High Growth Potential: The commercial drone market is expected to experience multifold growth in the next few years.
- Multiple sources of revenue: With applications in various industries, including defense and agriculture, a boost in logistics and enterprise will mean diversified revenue for companies.
- Government Support: The Indian government, through a 20-crore PLI incentive, is supporting the drone industry; hence, there is a need to include the factor of Make in India in business initiatives.
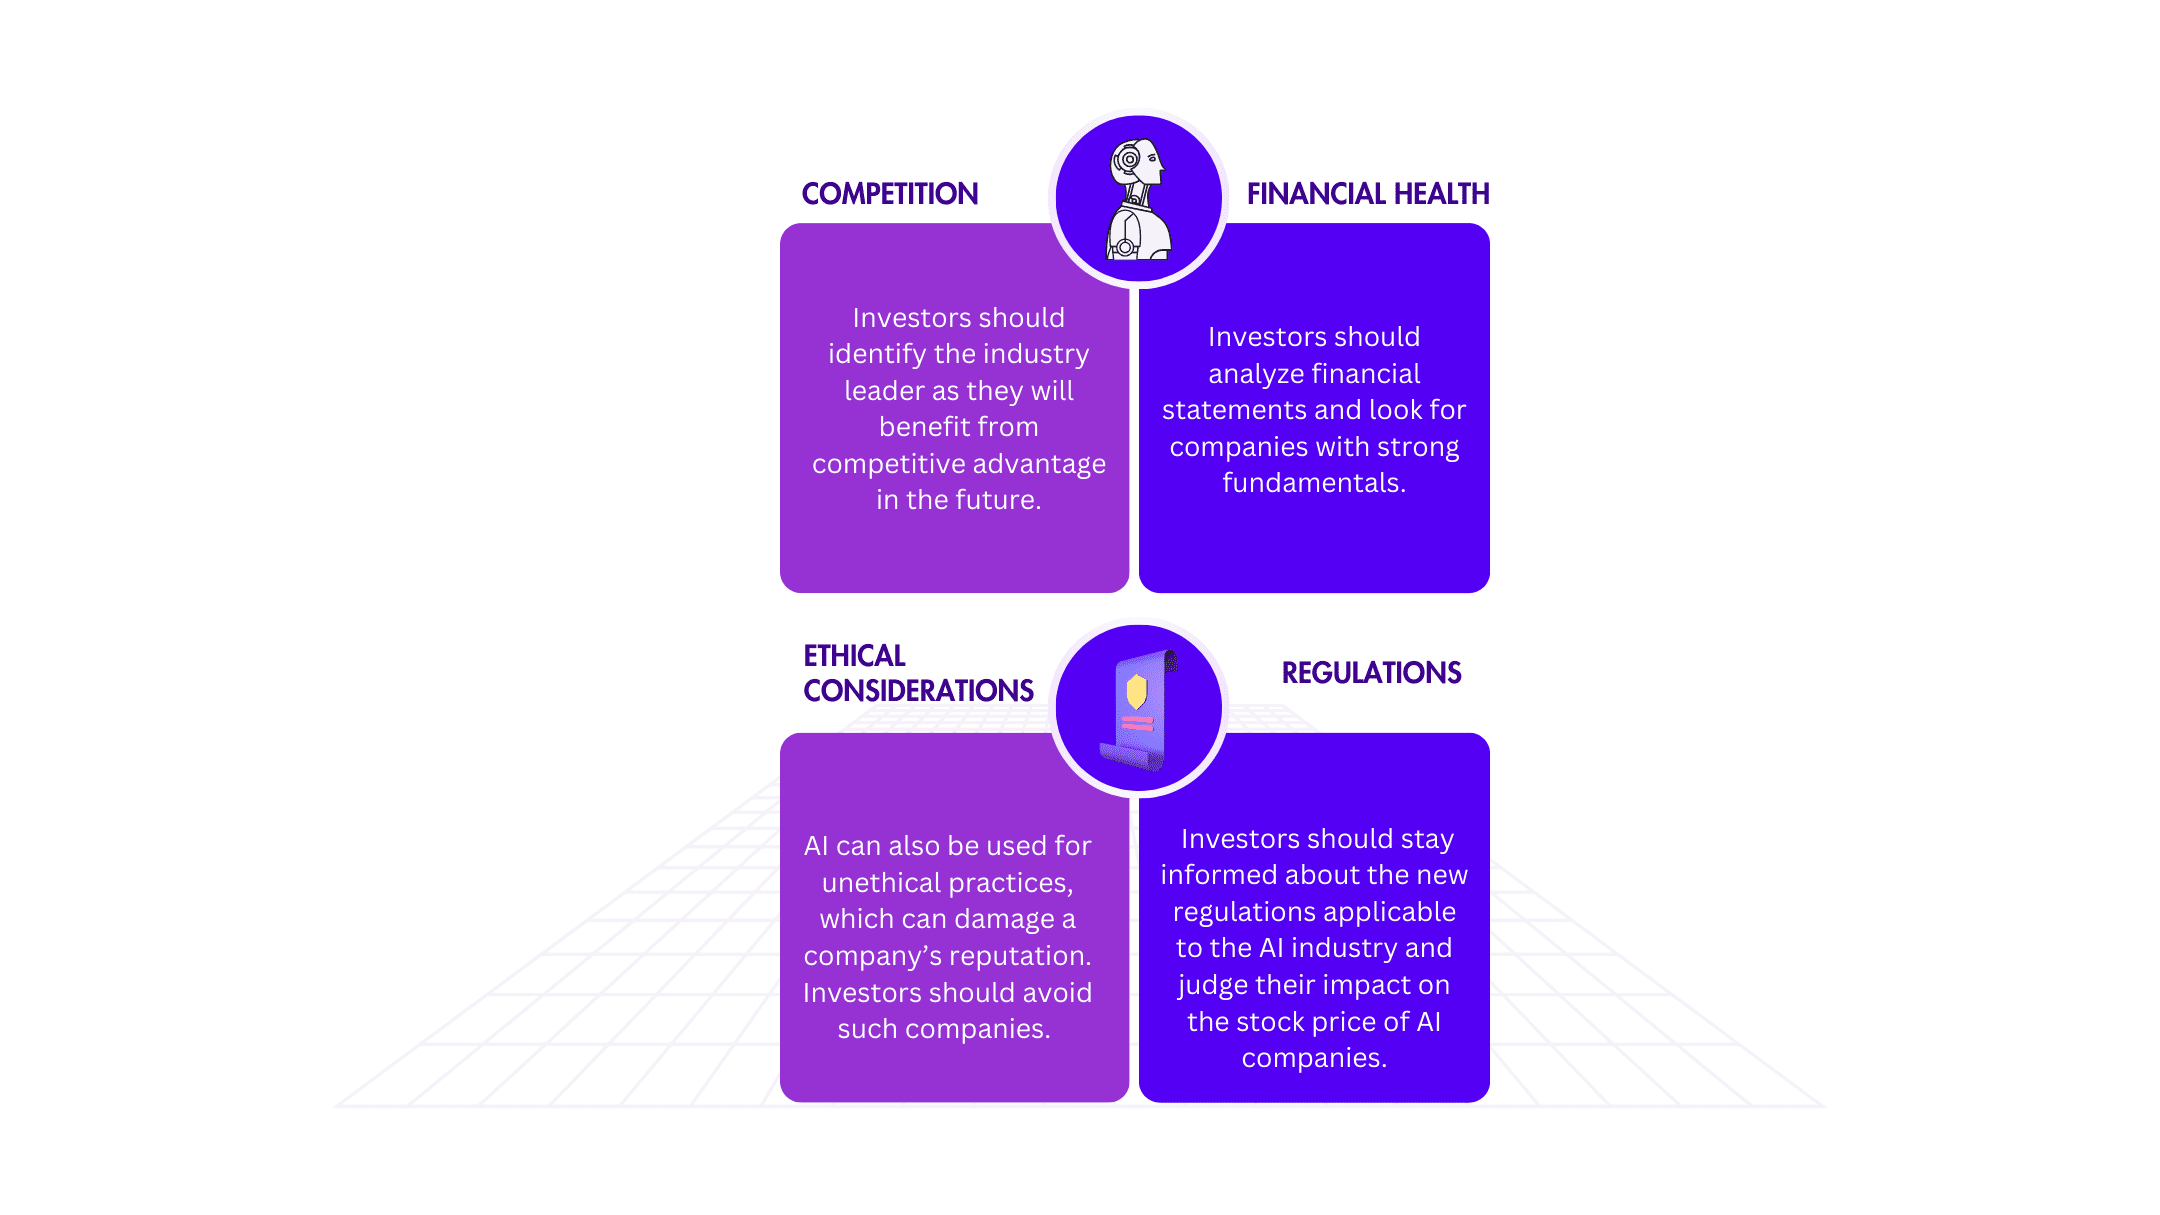
Factors to Consider Before Investing in Drone Stocks
An investor must consider the following factors before investing in drone stocks:
- Regulatory Environment: An investor must know the regulatory frameworks that govern the drone industry in India. This might have a big impact on access to markets and profitability.
- Market Potential: Growth prospects of sectors that are increasingly adopting the use of drones, such as agriculture, logistics, and surveillance.
- Competitive Landscape: An investor must understand the competitive environment for drone manufacturers and service providers to understand a company’s relative placement in the markets.
- Financial Health: Look at the revenue growth, profitability, and leverage levels of drone companies to check the viability of investment decisions.
Future of Drone Stocks
With the support of the government, like the Drone Shakti scheme and performance-linked incentives, the future of India’s drone market remains bright. The INR 80 crore market will likely touch INR 12,000-15,000 crore by 2026. The sectors that are seeing the entry of drones range from agriculture and defense to healthcare and e-commerce. Heavy investments by Reliance and Adani Enterprises convey the potential of the drone industry in India. Based on these factors, India will become a global drone hub by 2030.
Conclusion
The Indian drone industry holds huge potential across various industries because of the rapidly advancing capabilities of UAVs and the expansion of regulatory frameworks. Companies are working on stretching the efficiency of drones in agriculture, infrastructure, surveillance, and many other areas.
As the investment and adoption take off together, it is predicted that with the further evolution of drone technology, there will be a creation of jobs, modernization of industries, and sustainable development. India’s drone sector does seem promising for investors; however, one should consult a financial advisor before investing.
Frequently Asked Questions
What are the top drone stocks in India?
Some of the top drone stocks in India include Hindustan Aeronautics Ltd, Droneacharya Aerial Innovations, and Paras Defense & Space Technologies Ltd.
Why should one consider investment in drone stocks in India?
The drone industry is rapidly growing, with a lot of support coming from the government and diversified applications.
What should one look at while considering investing in drone stocks?
Consider looking into financial performance, technology, regulations, market demand, and management expertise.
What are the future prospects of the drone industry in India?
The drone industry is expected to grow at a CAGR of 22.15% from 2024-2030.
Has the government come up with any specific initiative in favor of the drone industry in India?
Through the Production-Linked Incentive (PLI) scheme, support is provided for the manufacturing and growth of the drone industry.