Volatility is a concept we’ve all encountered. It is a statistical measure of the dispersion from the mean, or to put simply, indicates the tendency to change.
In financial markets, we have Historical Volatility and Implied Volatility. Historical Volatility reflects past price movements, but what exactly is Implied Volatility, and can traders leverage it in trading?
In this blog, we will deep dive into Implied Volatility and explore its use cases in trading.
What is Implied Volatility?
Implied Volatility (IV) is a fundamental concept in options trading and financial analysis, offering a forward-looking perspective on market expectations. It reflects the forecast of future price fluctuations of an underlying asset, derived from the current prices of options.
Key points about Implied Volatility

- Unlike historical volatility, which is calculated based on past price movements, IV is forward-looking.
- IV is not directly observable but is derived using option pricing models such as the Black-Scholes model.
- The formula of IV involves equating the market price of the option to the theoretical price given by the model and solving for volatility.
- IV can be influenced by several factors such as market sentiment, economic events, supply & demand, etc.
- Traders can use IV in:
- Options Trading: Traders use IV to price options. Higher IV leads to higher option premiums because the potential for significant price swings increases the value of the option. Higher IV gives the opportunity to Option sellers (expensive options), and Lower IV gives the opportunity to Option buyers (cheaper options).
- Risk Management: By understanding IV, traders can gauge the level of risk and uncertainty in the market.
Did you know?
There is a term ‘Volatility Smile’, which is a pattern observed in the IVs of options across different strike prices. Generally, options that are deep in-the-money (ITM) or out-of-the-money (OTM) have higher IVs than those at-the-money (ATM), forming a curve or “smile” when plotted on a graph.
Factors Affecting IV
Implied Volatility can be influenced by various factors, including market sentiment, upcoming events, and macroeconomic conditions. Traders and investors closely monitor such factors to anticipate changes in IV and adjust their strategies accordingly.
Factors That Cause IV to Rise:
- Market Uncertainty: IV tends to rise during periods of market uncertainty or stress. Events like economic downturns, geopolitical tensions, and natural disasters can increase uncertainty, leading to higher IV. For example, during the 2008 financial crisis, IV across many assets spiked due to increased market fear and uncertainty.
- Earnings Announcement:IV typically increases before the earnings announcements of companies. Traders anticipate significant price movements based on the results, driving up the IV.
- Economic Data Releases: Important economic reports (e.g. GDP data, employment figures) can cause IV to rise as traders anticipate the impact of these data on the markets.
- Central Bank Announcements: Announcements or policy changes by central banks, such as interest rate decisions, often lead to higher IV as market anticipates changes in monetary policy. An example is an upcoming RBI meeting with potential interest rate changes.
- Corporate Events: Mergers, acquisitions, or other major corporate events can lead to increased IV due to the anticipated impact on the stock’s price.
Factors that cause IV to fall
- Resolution of Uncertainty: IV tends to decrease once uncertainty is resolved, such as after earnings announcements, economic data releases, or central bank meetings.
- Market Stability: During periods of market stability and lower volatility, IV generally decreases. Stable economic conditions and positive market sentiment contribute to lower IV.
- Decreased demand for Options: Lower demand for options can lead to decreased IV. This may happen when market participants expect less volatility or when there is a general lack of interest in options trading. Example – A decrease in trading volume for options on a particular stock can lead to a decline in IV.
Calculation of Implied Volatility (IV)
Implied volatility (IV) is not calculated using a direct formula but rather derived from an option pricing model. The most commonly used model for this purpose is the Black-Scholes model.
IV is the volatility input in the Black-Scholes formula that equates the theoretical option price to the current market price of the option.
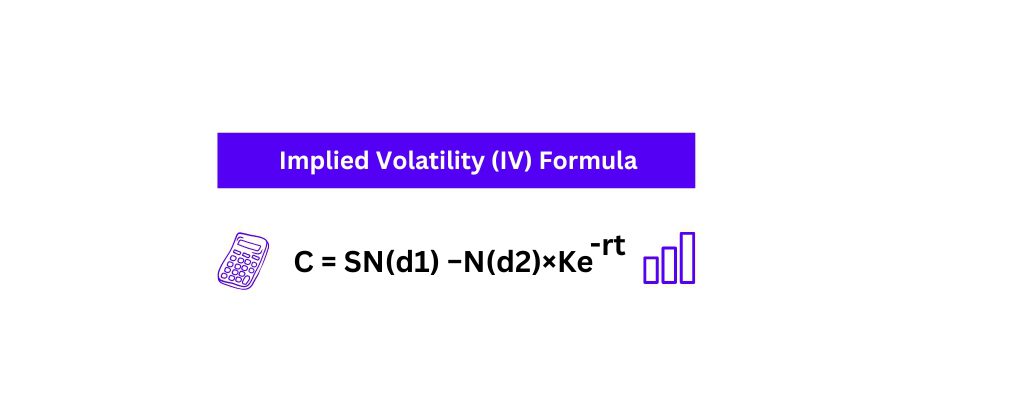
The formula is: C = SN(d1) −N(d2)×Ke-rt
Where:
- C is the Call option price.
- S is the current stock price or spot price.
- N is the normal distribution.
- d1 and d2 are probability factors that are used to calculate the value of a call option.
- K is the exercise or strike price.
- e is the exponential term.
- r is the annualized risk-free rate (generally yield of a govt. bond).
- t is the time for the option to expire.
Historical Volatility vs. Implied Volatility
Historical Volatility provides a record of past price behavior, while Implied Volatility offers a glimpse into market expectations for the future, making it a critical tool for options traders and risk managers.
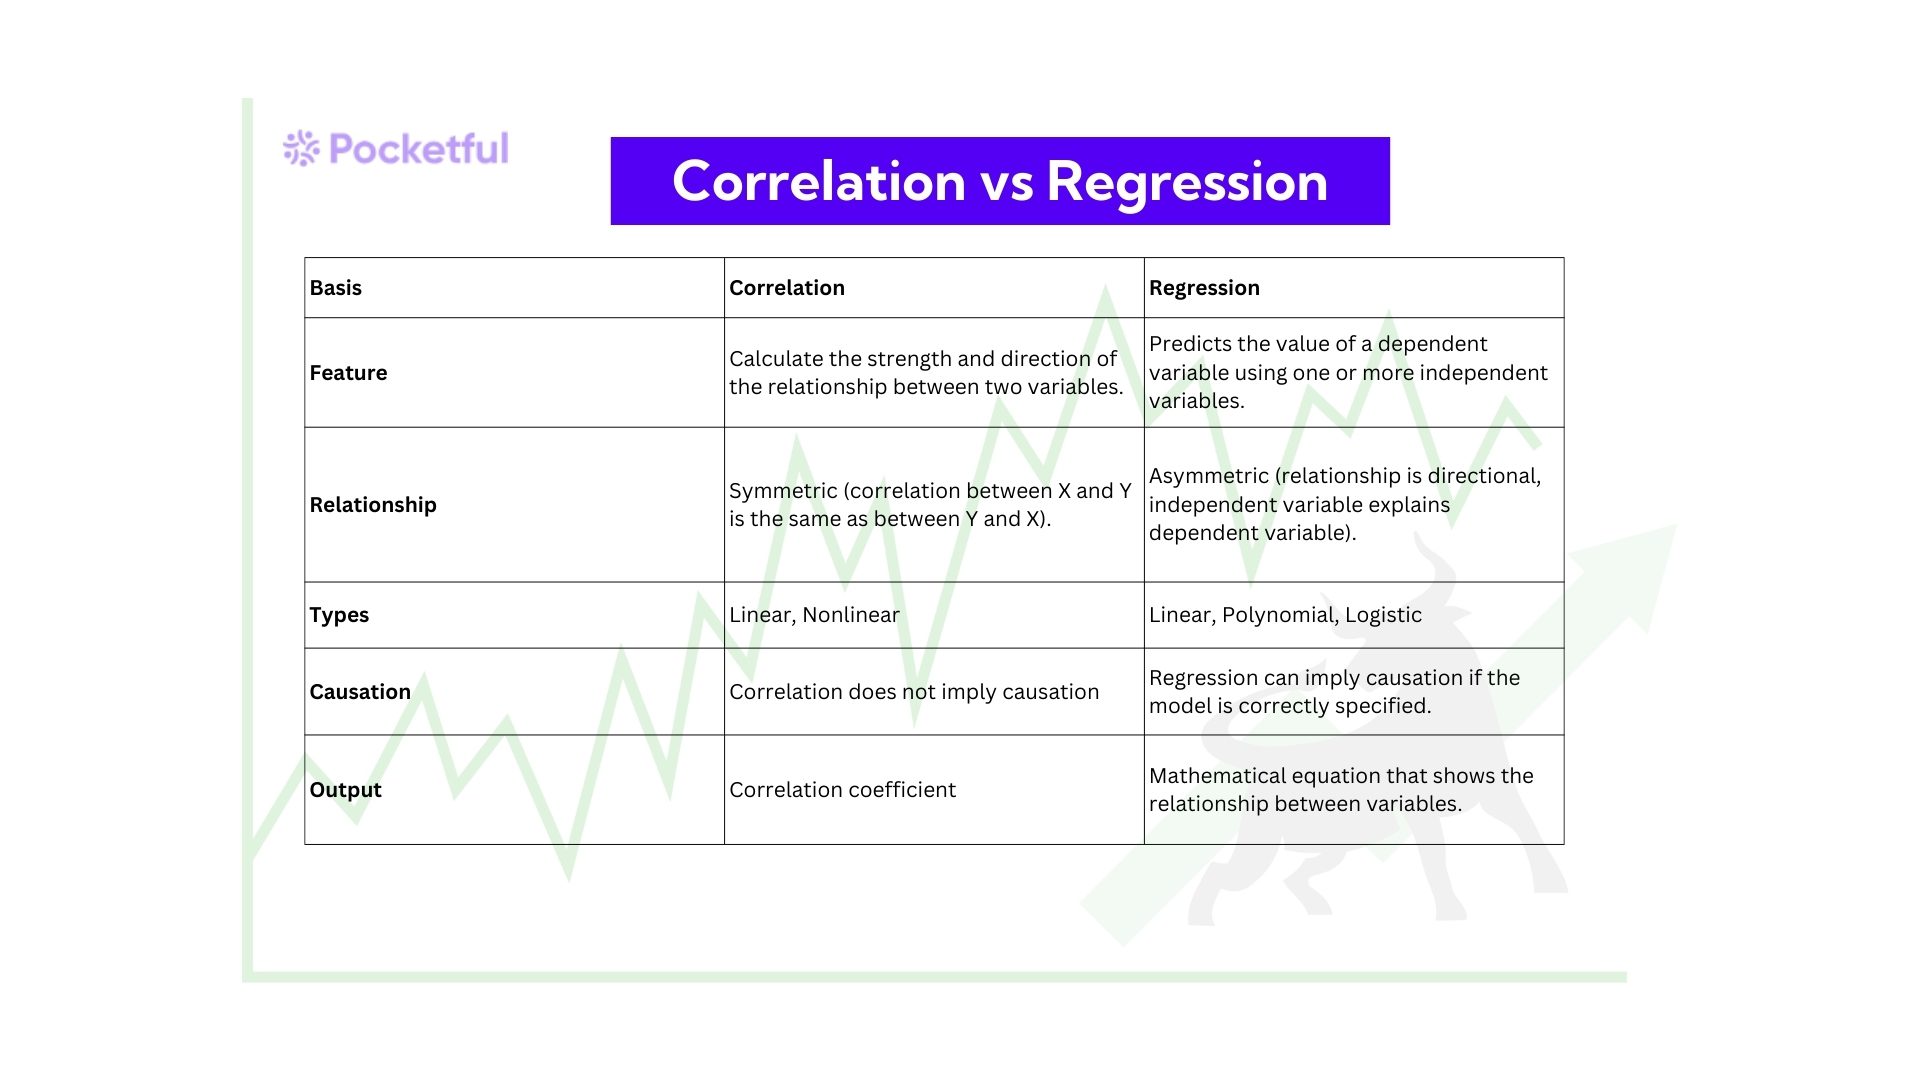
Key Differences:
| Particulars | Implied Volatility | Historical Volatility |
|---|---|---|
| Nature | Forward-looking, based on market expectations. | Backward-looking, based on past price data. |
| Calculation | Derived from current option prices and models. | Using statistical analysis of historical prices. |
| Usage | Used to price options, gauge market sentiment, and predict future volatility. | Used to analyze past price movements and assess historical risk. |
| Interpretation | Represents the market’s forecast of future price fluctuations. | Represents actual past price fluctuations. |
Implied Volatility & Vega
Implied Volatility (IV): As we explained above, the IV is the market’s forecast of a likely movement in an asset’s price and is derived from the price of options. It is forward looking and represents the market’s expectations of future volatility.
Vega: Vega is one of the Greeks in options trading, representing the sensitivity of an option’s price to changes in the IV of the underlying asset.
Key points:
- Vega measures the rate of change of the option’s value with respect to a 1% change in IV.
- It applies to both call and put options.
- Generally, Vega is higher for at-the-money options and decreases as options move further in- or out-of-the-money.
- Vega is also higher for longer-dated options compared to shorter-dated ones.
Relationship Between Implied Volatility and Vega
- Sensitivity: Vega directly measures how sensitive an option’s price is to changes in IV. If Vega is high, a small change in IV will result in a significant change in the option’s price.
- Impact of IV Changes: When IV increases, the price of options (both calls and puts) with positive Vega will increase. Conversely, when IV decreases, the prices of options with positive Vega will decrease.
- Time to Expiration: Vega is higher for options with longer times to expiration. This is because there is more time for the underlying asset’s price to experience significant volatility.
- Moneyness Impact: Vega is maximized when the option is at-the-money (the strike price is close to the current price of the underlying asset).
Read Also: Option Chain Analysis: A Detail Guide for Beginners
Conclusion
Implied Volatility (IV) is a crucial concept in the world of options trading. It measures the market’s expectation of volatility and represents the forecast of a likely movement in a security’s price.
Implied Volatility and Vega (Option Greek) are intertwined, as Vega measures how sensitive an option’s price is to changes in IV. This relationship is crucial for options traders to assess and manage the impact of volatility on their positions.
By incorporating IV into trading and risk management strategies, traders can better navigate the complexities of options trading and make informed decisions.
Frequently Asked Questions (FAQs)
What is Implied Volatility?
Implied Volatility (IV) is a metric that reflects the expectations of future volatility of the underlying asset’s price. It indicates the anticipated magnitude of price fluctuations.
Can Implied Volatility (IV) be negative?
No, IV cannot be negative because it represents the market’s expectation of volatility, which is essentially a non-negative value.
How does Implied Volatility change over time?
IV tends to change in response to market conditions, upcoming events, and changes in supply and demand for options. It often increases during periods of market uncertainty or ahead of significant events and decreases when markets are stable.
What is automation in Implied Volatility?
Automation involves using algorithms and software to calculate, monitor, and analyze IV in real-time.
Which automation tools are available for the Implied Volatility?
There are several tools available for automation. Python, with libraries like QuantLib, can be used for options pricing and volatility calculations. For simpler setups, Excel with VBA offers the capability to create dynamic option pricing models. Additionally, dedicated software platforms such as MATLAB, R, and various trading software solutions provide built-in functions for IV calculation and analysis, making them robust options for professionals in the field.