Most traders in India start with the 20-day or 50-day moving average. These tools are simple, but they have one weakness. They move at the same speed whether the market is trending strongly or just going sideways. This is why they often lag in a good trend and give false signals in a choppy market.
In today’s blog, we explain what KAMA is, how its formula works, how to calculate the Efficiency Ratio, and the strategies traders can use on Nifty, Bank Nifty, and individual stocks.
What is Kaufman Adaptive Moving Average
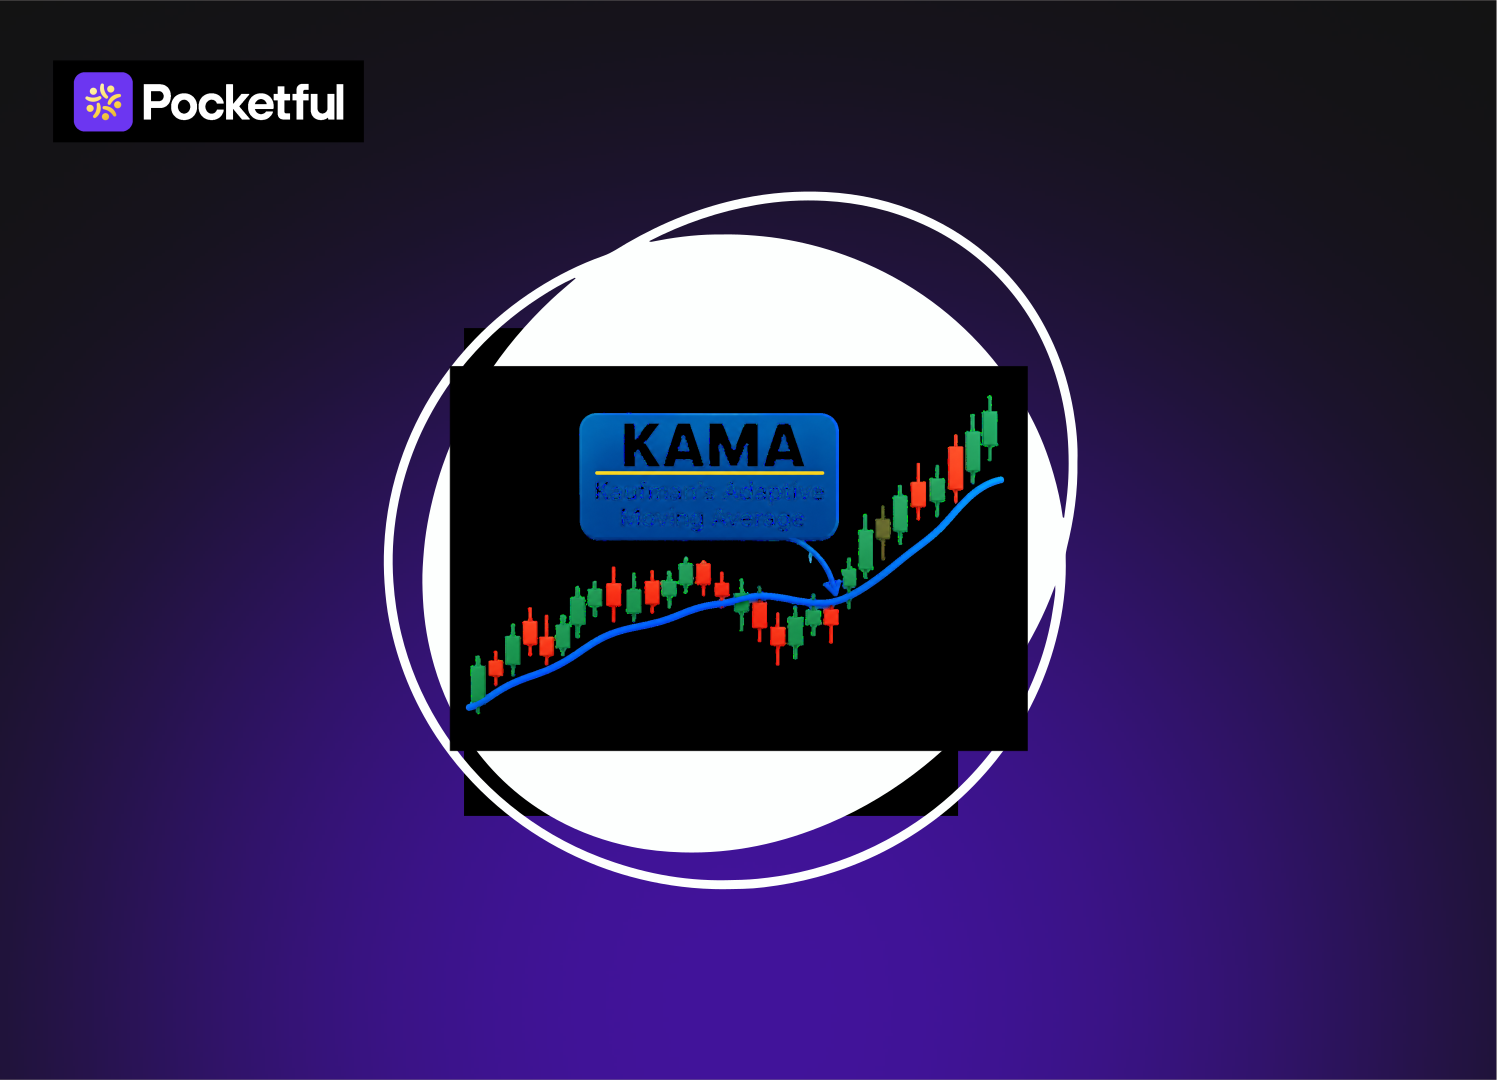
KAMA is a moving average that changes its speed depending on how the market is behaving. It was created by Perry Kaufman and works differently from the usual moving averages that traders use on Indian charts, like the 20-day or 50-day SMA and EMA.
The Basic Idea
A regular moving average has a fixed speed. If you pick a 20-period average, it treats a sideways market and a strong trending market in the same way. This causes problems. In a trending market, it can be slow, and in a choppy market, it keeps giving false signals.
Kaufman Moving Average tries to solve this problem. It speeds up when price moves smoothly in one direction and slows down when it moves up and down without a clear direction.
How does the KAMA Indicator Work?
KAMA depends on a measure called the Efficiency Ratio (ER). It checks how much of the price movement is actual progress and how much is just noise.
- Efficiency Ratio = Net price change ÷ Total price movement over a chosen period.
- If the stock moves steadily upward, the ratio is close to 1. This means a clear trend.
- If the stock keeps jumping up and down and ends near where it started, the ratio is close to 0. This means a noisy market.
The ER is then used to adjust a smoothing constant. A high ER makes KAMA behave like a fast moving average. A low ER makes it behave like a slow one.
The common default settings are 10 periods for the efficiency ratio, 2 for the fast smoothing, and 30 for the slow smoothing.
Formula
KAMA is calculated in three steps.
Find the Efficiency Ratio, then you convert it into a smoothing constant, and finally you put that into the KAMA equation.
KAMA (today) = KAMA (yesterday) + SC * (Price – KAMA (yesterday))
Here, SC is the Smoothing Constant, which is worked out like this:
SC = [ER * (Fast SC − Slow SC) + Slow SC]^2
Where:
- Fast SC = 2 / (2 + 1) = 0.6667
- Slow SC = 2 / (30 + 1) = 0.0645
The first KAMA value has no previous value to build on, so most platforms start it with a simple moving average or with the closing price of that day.
Components of the Formula
Price: This is usually the closing price of the stock or index for the period.
KAMA (yesterday): The previous KAMA value.
- Efficiency Ratio: It is the main part, and a number between 0 and 1 that tells how trending the market is.
- Slow SC: The slowest speed KAMA can move at. With the default setting of 30 periods, it behaves like a slow EMA during rough market phases.
- Smoothing Constant (SC): The final weight given to the latest price. A larger SC means KAMA follows the price closely. A smaller SC means it barely moves. The result is squared so that the line becomes much slower in noisy markets and cuts out more false signals.
- Efficiency Ratio period: The number of candles used to measure the trend. The default is 10.
Read Also: What is the Power of Compounding?
How to Calculate Efficiency Ratio
ER = Direction / Volatility
Direction is the absolute difference between today’s close and the close 10 periods ago. Volatility is the sum of the absolute price changes for each of those 10 periods.
Example: A stock closed at ₹100 ten days ago and ₹110 today. During these 10 days, the daily moves added up to ₹25
- Direction = (110 – 100) = ₹10
- Volatility = ₹25
- ER = 10 / 25 = 0.4
An ER of 0.4 means the market moved in a mixed way, with some trend and a fair amount of noise.
How to Read the ER
- ER close to 1: Price moved almost in a straight line. KAMA becomes fast.
- ER close to 0: Price went up and down and made little progress. KAMA becomes slow.
KAMA Strategies
1. Price and KAMA Crossover
This is the easiest way to use KAMA. For the buy signal, the price closes above the KAMA line, and for a sell or exit signal, the price closes below the KAMA line.
2. KAMA Slope Strategy
In this strategy, the direction of the line matters more than the crossover.
- If KAMA is rising, the trend is up, and traders look only for buying opportunities.
- If KAMA is falling, the trend is down, and traders look only for selling opportunities.
- If KAMA is flat, the market is moving sideways, and most traders stay out.
For example, on a daily Nifty chart, you may decide to take long trades only when KAMA is sloping upward.
3. Two KAMA Crossover
In this method, two KAMA lines with different settings are used together.
- A fast KAMA (for example, ER period 10) and a slow KAMA (for example, ER period 30).
- Buy when the fast KAMA crosses above the slow KAMA.
- Sell when the fast KAMA crosses below the slow KAMA.
4. KAMA with RSI
If you combine KAMA with a momentum indicator, it helps confirm the signal.
- It is a buy when the price is above a rising KAMA, and RSI is above 50.
- It is a sell when the price is below a falling KAMA, and RSI is below 50.
5. KAMA with Volume
A breakout above KAMA with higher-than-average volume is usually more reliable than one with weak volume. Traders in stocks and Bank Nifty often use this to avoid weak moves that fade quickly.
Conclusion
It is a great indicator for traders who wish to have a moving average that moves with the market rather than remaining fixed. It adjusts the speed by the Efficiency Ratio, and it closely follows the trends during strong trends, and it remains calm during sideways phases, which can help reduce false signals. Before trading with real money, test the settings on past data of the stocks or indices you follow. Start with a simple crossover or slope method and then move forward as you gain experience.
| S.NO. | Check Out These Interesting Posts You Might Enjoy! |
|---|---|
| 1 | How to Calculate Stock Volatility in Excel? |
| 2 | Nifty Options Profit & Loss Formula – Calculate P&L |
| 3 | What is a Basis Point (BPS)? |
| 4 | Explainer on Liquidity Ratios: Types, Importance, and Formula |
| 5 | Best SWP for Monthly Income in India |
Frequently Asked Questions (FAQs)
What are the default settings of KAMA?
The common default settings are 10 for the Efficiency Ratio period, 2 for the fast smoothing, and 30 for the slow smoothing.
How is KAMA different from EMA?
An EMA has a fixed speed, while KAMA changes its speed depending on the Efficiency Ratio, which helps KAMA reduce false signals in sideways markets.
Can KAMA be used for intraday trading?
Yes. Traders use it on intraday charts of Nifty, Bank Nifty, and liquid stocks, as well as on daily and weekly charts.
Is KAMA a leading or lagging indicator?
KAMA is a lagging indicator. It reacts after the price has moved, but it lags less than a normal moving average during strong trends.
Is KAMA enough to trade on its own?
No single indicator is reliable on its own. KAMA works better when combined with other tools and proper risk management, including a stop-loss.