There are several technical analysis tools available that can completely transform a trader’s performance. Traders typically use many complex technical tools to better grasp a stock’s price bullish momentum. However, a bullish trend can be predicted by a simple pattern known as the Opening White Marubozu pattern.
In this blog, we will provide you with information about the Opening White Marubozu pattern, its features and interpretation. We will also discuss the advantages and disadvantages of using this pattern.
What is the Opening White Marubozu Pattern?
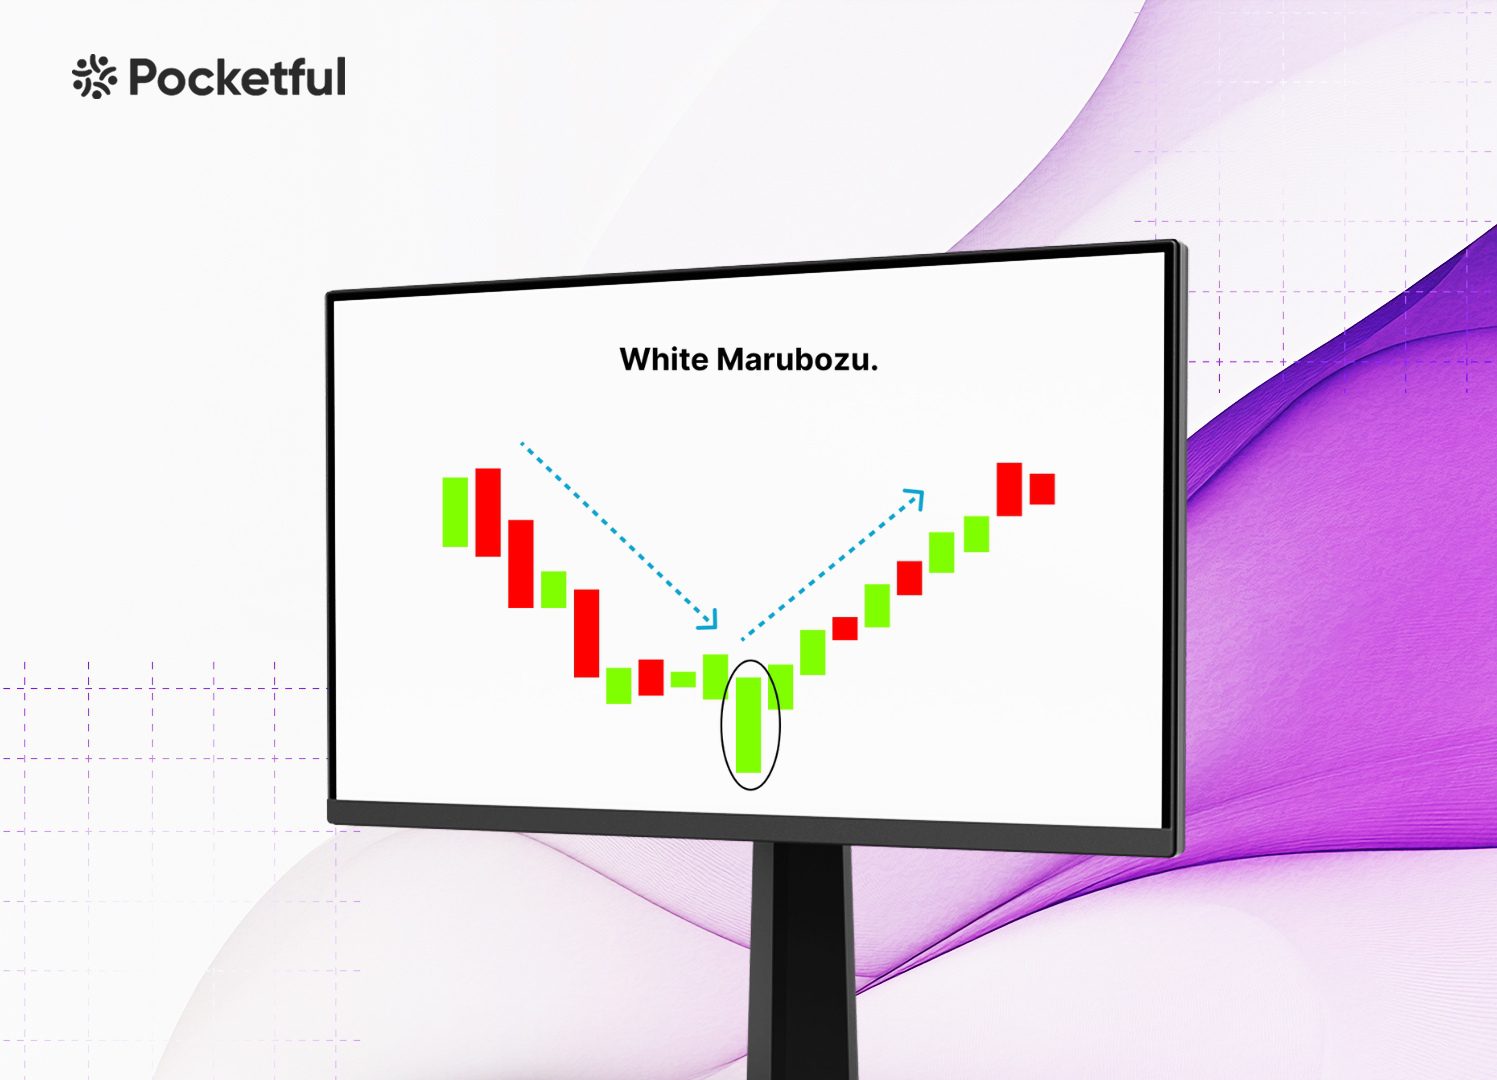
The word “Marubozu” in Japanese means “bald,” which gives the pattern its name as a Maruzobu candle doesn’t have any wicks. The Opening White Marubozu pattern is a single-candle pattern that typically appears at the end of a downward trend and predicts a significant upward movement. This candlestick can have a little wick at the top and a long, white body, but it lacks a lower shadow or wick. The candle’s body indicates buyers are attempting to increase prices by taking long positions. However, it is important to consider broader market conditions as they may be against the pattern, which can result in the continuation of the previous trend.
Features of Opening White Marubozu Pattern
The main characteristics of the Opening White Marubozu pattern are as follows-
Long Body – This pattern’s large or long white body suggests that the price is trending upward.
No Lower Shadow – There is no lower shadow in the Opening White Marubozu pattern since the price did not drop below the session’s opening levels.
Small Upper Wick – This candle pattern has a tiny upper wick, which suggests that the stock price increases swiftly but does not close at the session’s high due to mild selling pressure near the high. Occasionally, it does close near the session’s high, indicating strong purchasing momentum.
Bullish Sentiment– This pattern suggests a bullish sentiment among the market participants.
Interpretation of Opening White Marubozu Pattern
The Opening White Marubozu pattern can be interpreted in the following ways:
Usually, this pattern emerges at the end of a downtrend and signals the beginning of an uptrend.
This indicator suggests buyers are entering the market and building long positions.
As is typically observed in this pattern, buyers attempt to drive prices as high as they can; however, sometimes, they may not be successful, in which case the candlestick pattern may have a little wick at the top.
There are several ways to determine the target price for the Opening White Marubozu pattern. A couple of these techniques are as follows:
1. Height of Candle – Measure the candle’s height, i.e., the difference between the candle’s open and close prices. Project this upwards from the candle’s closing price to determine your target price.
2. Resistance Level – Technically, you can also consider the closest resistance level as your target price. This resistance level is the region from where the stock has recently experienced selling pressure.
3. Average True Range (ATR) – A trader can also use ATR to determine the stock’s target price while also considering volatility.
When trading the Opening White Marubozu pattern, the stop-loss can be determined in the following ways.
1.Previous Day Low – An individual can set a stop-loss just below the prior day’s low to limit losses.
2.Low of Candle – Stop-loss can be positioned below the low of the Opening White Marubozu candle. It is the most often used stop-loss by traders.
3. Support Levels – A trader can set a stop-loss bear the closest level of support using technical charts.
Example Of Opening White Marubozu Pattern
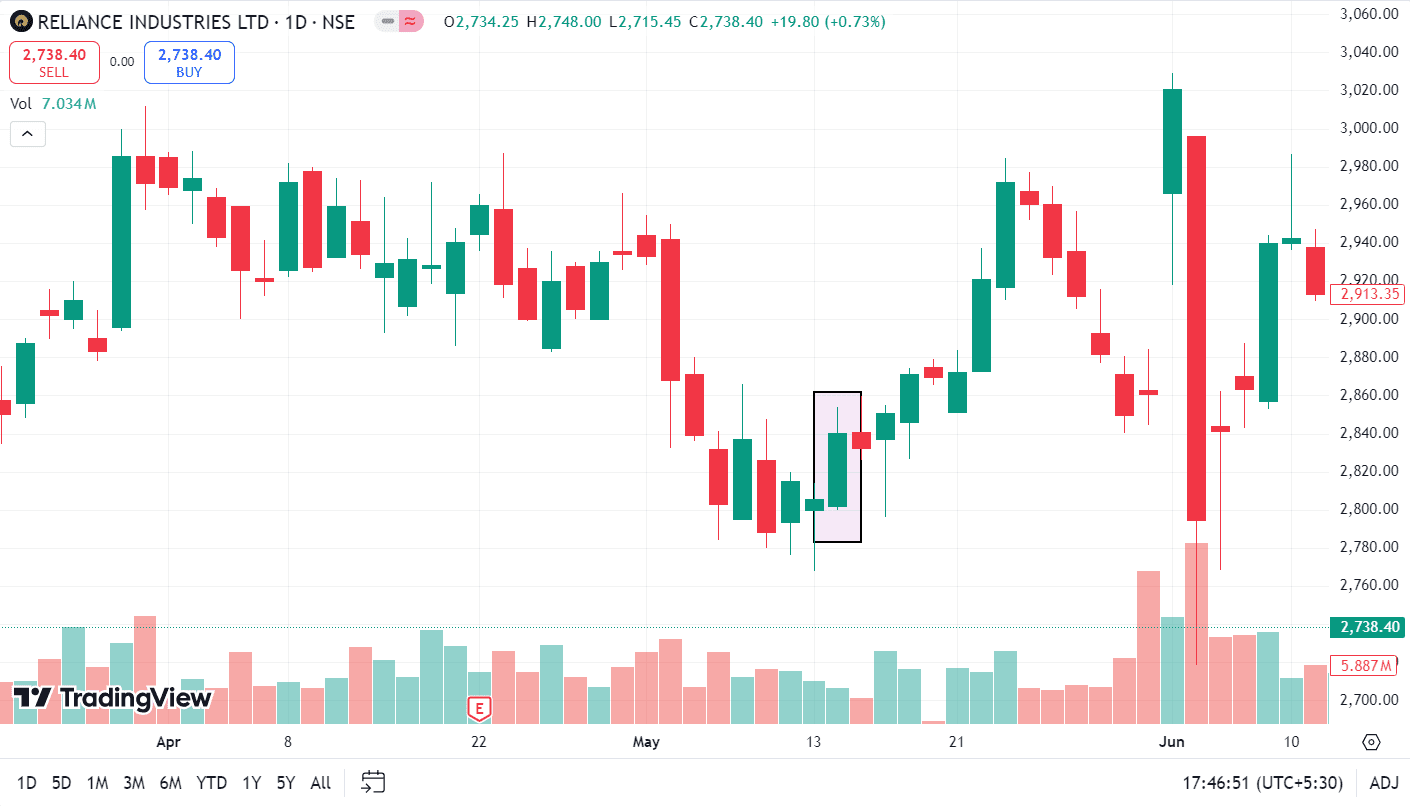
In the above image, the price chart of Reliance Industries is shown. The stock was in a downtrend and declined from INR 2,971 on 28 March 2024 to INR 2,805 on 13 May 2024. The stock made an Opening White Marubozu Candlestick Pattern on 14 May 2024, with a small upper wick. It was a signal of bullish reversal and the stock price increased from INR 2,840 on 14 May 2024 and made a high of INR 2,972 on 23 May 2024.
Advantages of Opening White Marubozu Pattern
The following are the main benefits of the Opening White Marubozu pattern:
Easy Identification – This trading pattern is easily recognizable due to the absence of lower shadow, indicating a distinct upward trend in the market.
Indication of Market Trend – The Opening White Marubozu pattern signals a significant upward trend in the stock price.
Entry Signal – The pattern helps traders determine when to enter the market and create a long position.
High Rewards – This pattern can be highly profitable because it usually functions as a bullish reversal pattern, appearing at the end of a bearish trend.
Limitations of Opening White Marubozu Pattern
Opening White Marubozu candlestick pattern has some drawbacks, which are listed below:
1. Lacks Confirmation – The Opening White Marubozu pattern consists of only one candlestick and lacks confirmation, due to which it can occasionally generate false signals.
2. Dependent on other tools – The pattern relies on other technical tools, such as volume, RSI, MACD, etc., to give a strong bullish signal.
In trading, the Opening White Marubozu pattern serves as a crucial tool that suggests a possible bullish signal. The pattern provides clear entry and exit points, making this pattern popular among investors. To have a profitable trade, you must employ this pattern in conjunction with other patterns like the MACD.
Frequently Asked Questions (FAQs)
Is Opening White Marubozu a bullish or bearish pattern?
The Opening White Marubozu pattern is a bullish candlestick pattern.
Is there any difference between the Opening White Marubozu and White Marubozu candlestick pattern?
Yes, there is a little distinction between the White Marubozu candlestick pattern and the Opening White Marubozu pattern. The White Marubozu pattern lacks shadows on either side, while the Opening White Marubozu pattern has a small wick at the top of the candle.
Can the Opening White Marubozu pattern occur in any market?
Can the Opening White Marubozu pattern occur in any market?
Is Opening White Marubozu a reliable candlestick pattern?
When paired with other analytical tools, the Opening White Marubozu chart pattern can be considered a reliable chart pattern.
Does the Opening White Marubozu candlestick pattern have a wick?
A tiny wick above the candle’s close price is seen in the Opening White Marubozu candlestick pattern.
The word Demat account stands for Dematerialized account, and it is essential for holding shares in electronic form. Indian investors are exploring the flexibility of holding the multiple Demat accounts to segregate and analyze the performance of different investment strategies. But is it legal to have multiple demat accounts in India? The answer is yes.
In this blog, we will look into the benefits, rules, and considerations for maintaining multiple Demat accounts in India.
Is Opening Multiple Demat Accounts Illegal?
The Indian stock market has seen a significant rise in market participants in the past few years. Many new participants want to implement different investment strategies in the financial markets and often want to segregate different strategies to better analyze their performance. Having multiple Demat accounts looks like a perfect solution, but many new investors wonder, “Can I open two Demat accounts?” or “Can I open multiple Demat accounts?” The answer is yes; it is completely legal to open more than one Demat account in India. According to Indian market regulations, an individual can open multiple Demat accounts with different Depository Participants (DPs). There is no restriction on how many Demat accounts one can open as long as they comply with the rules and regulations set forth by the SEBI.
Investors can open multiple Demat accounts to categorize their Demat accounts according to their investment strategies. For instance, one account can be used for long-term investments, while another is designated for short-term trading or specific financial goals. Having multiple Demat accounts helps in better portfolio management as you can separate your investments into different accounts based on purpose or risk tolerance. Additionally, the different DPs offer a variety of services, fee structures giving you flexibility in choosing what works best for you.
However, it is important to note that while opening multiple Demat accounts is legal, you cannot have two Demat accounts with the same DP. But you can easily open them with different DPs like banks or brokerage firms.
Now that we know it is legal to have multiple demat accounts, we must know that there are some important rules to keep in mind. Opening multiple Demat accounts in India is legal, provided that you follow certain guidelines set by regulatory authorities, as mentioned below:
You cannot open more than one Demat account with the same Depository Participant (DP). However, you can open them with different DPs such as banks or brokerage firms. This offers the flexibility to manage your investments with various service providers.
All demat accounts are subject to Know Your Customer (KYC) norms. Each time you open a new Demat account, you will need to submit KYC documents like proof of identity, address, etc.
Each demat account will have its own set of charges including the annual maintenance charge(AMC). Be prepared for additional costs if you choose to have multiple Demat accounts, even if you don’t use all of them.
An individual wanting to open multiple Demat accounts in India can do so by meeting a few requirements given below:
First, every Demat account, whether it is your first or additional one requires you to comply with Know Your Customer (KYC) norms. This includes submitting the essential documents such as proof of identity (Aadhaar, PAN card, and passport etc.) and proof of address (utility bills and rental agreements ). KYC is mandatory for every Demat account.
Second, while you can open multiple Demat accounts, they must be with different Depository Participants (DPs). You cannot open more than one account with the same DP, but you can open additional demat accounts with different brokerage firms, banks, or financial institutions.
Third, each account requires an individual PAN number as it serves as a unique identifier for every investor. A PAN card is compulsory for opening any Demat account in India.
Lastly, be prepared for annual maintenance fees (AMC) for each account. Ensure you factor in these costs when deciding to open multiple Demat accounts to manage your portfolio effectively.
The advantages of opening multiple demat accounts are:
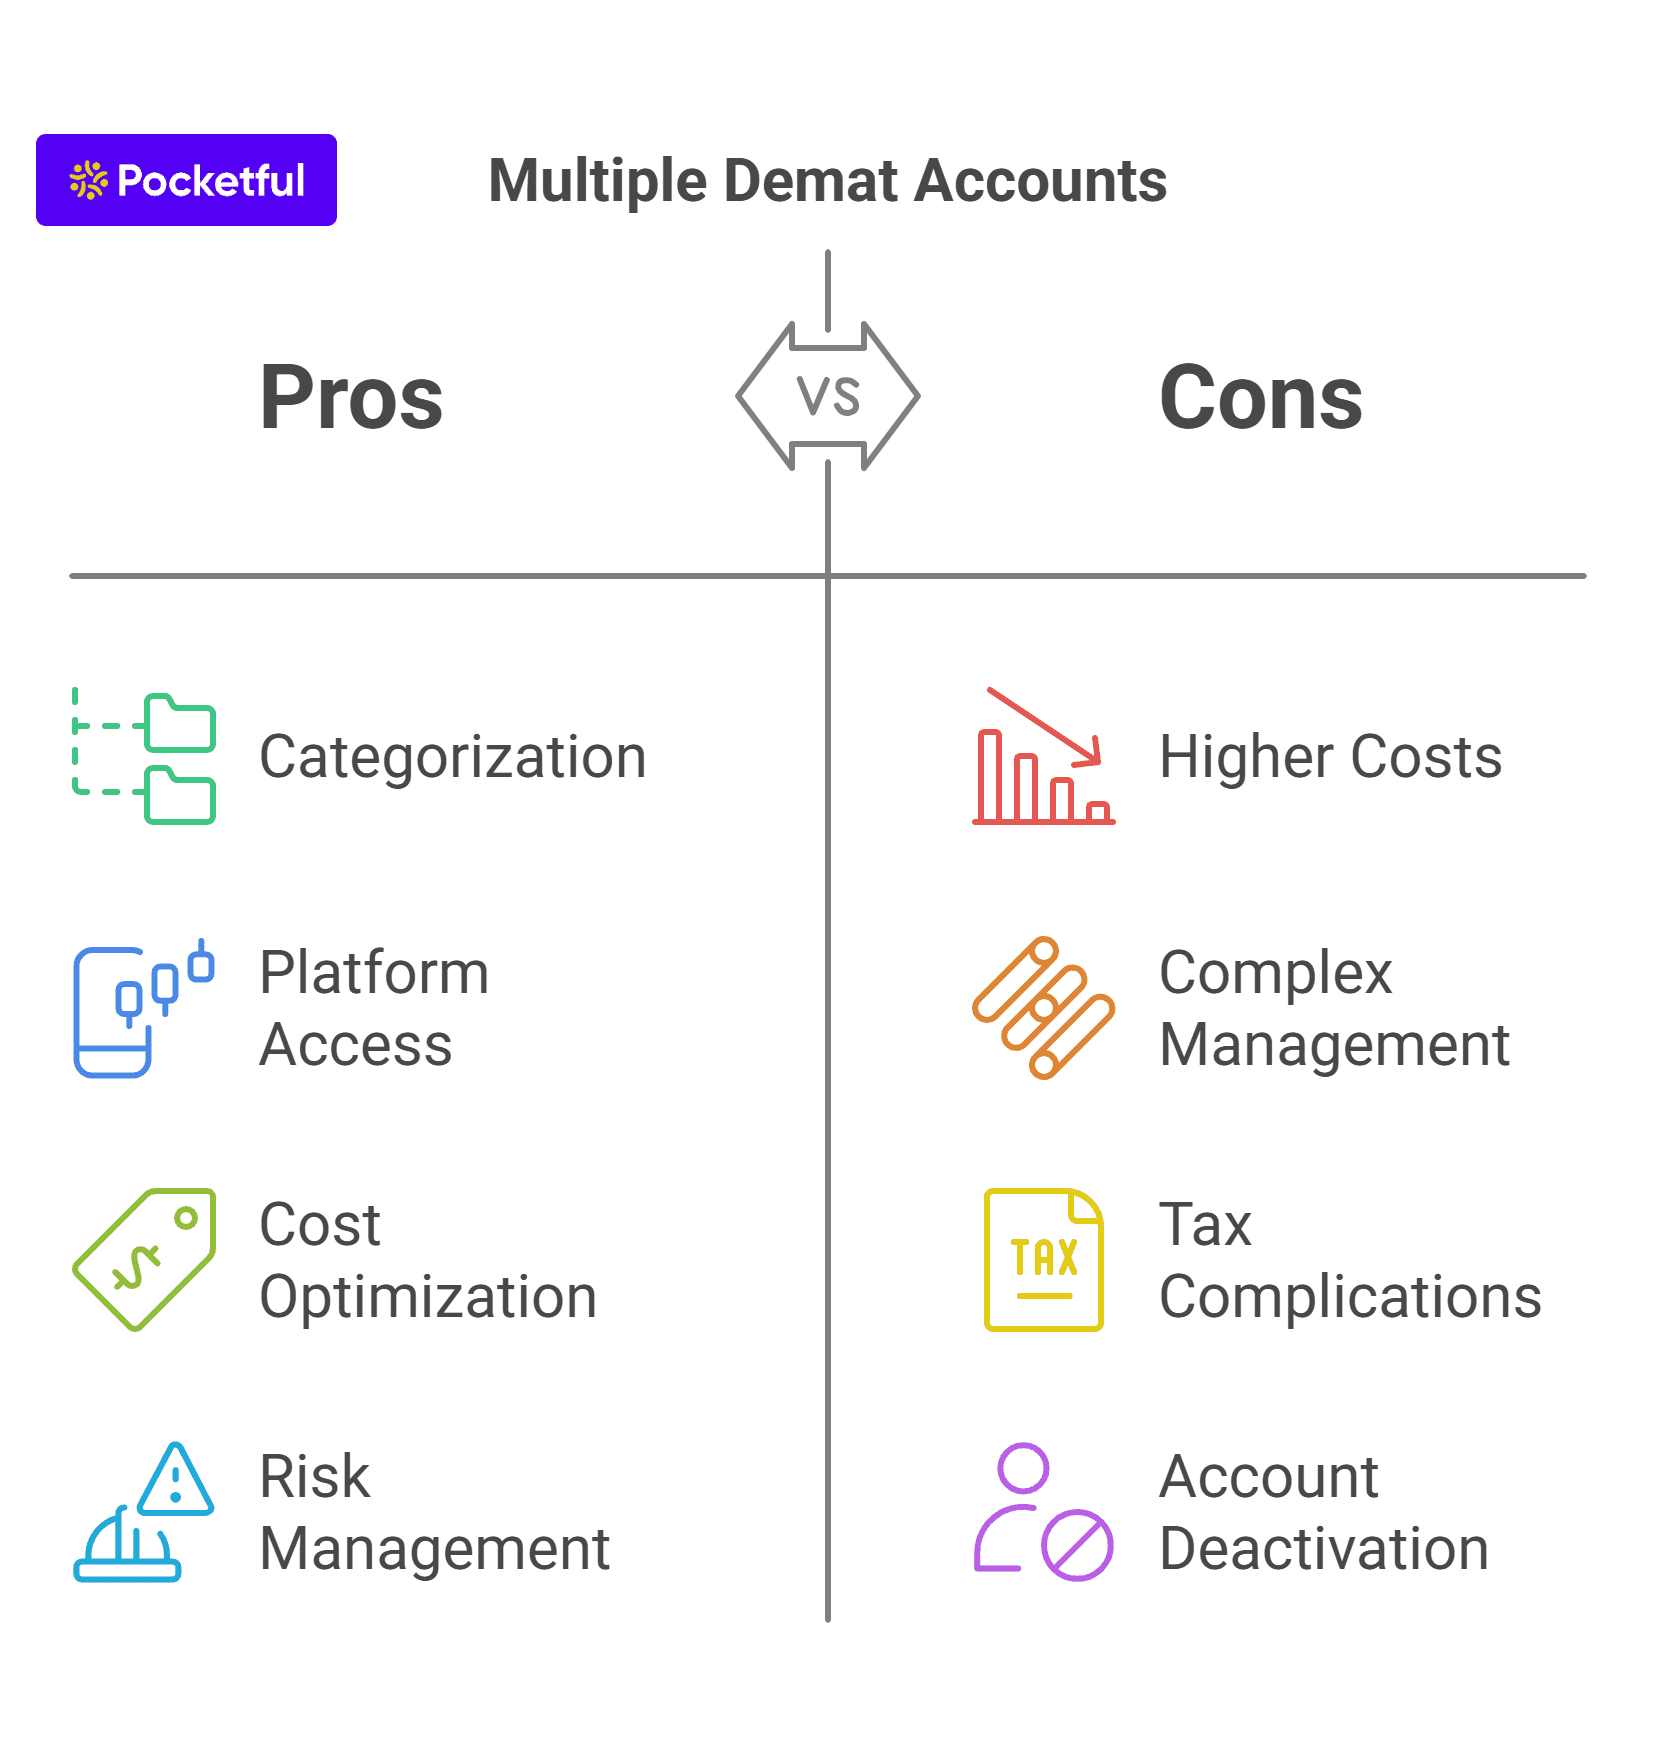
Categorization: Multiple Demat accounts will allow the investors to categorize their demat accounts according to their investment strategies. For example, you can use one account for long-term investments and another for short-term trading. This separation helps manage the risk more effectively and keeps your portfolios organized based on your financial goals.
Access to Different Platforms: Each additional Demat account must be opened with a different broker or Depository Participant (DP), which gives you access to the best stock trading platforms with different features. Some brokers may offer low-cost trading while others might provide superior research tools and customer service.
Cost Optimization: While each Demat account comes with its own set of charges, investors can take advantage of promotions, discounts, or special pricing models across different brokers. By comparison of the fee structures of multiple platforms, you can choose the accounts with lower charges for specific types of orders, which can help you save on costs.
Risk Management: Multiple Demat accounts help diversify risk across different brokers. If there are operational issues with one trading platform, you can continue to trade using the other account without disruption.
The advantages of opening multiple demat accounts are:
Higher Costs: One of the most significant downsides of having multiple demat accounts is the increased cost. Each Demat account comes with its own set of annual maintenance charges (AMC), transaction fees, and brokerage costs. These can add up even if you’re not an active trader. Hence, managing multiple accounts can be expensive unless you are making substantial returns.
Complex Portfolio Management: With multiple Demat accounts, tracking your investments across the different platforms can become a complicated task. This can lead to confusion, making it difficult to maintain an organized portfolio. You may miss out on opportunities or fail to notice critical issues like underperforming stocks if you’re not constantly monitoring each account.
Tax Reporting Complications: When you execute buy and sell transactions from different Demat accounts, it can complicate the tax reporting process. You will need to consolidate all your transactions for capital gains calculations, which can be time-consuming and prone to errors. Tax reporting becomes complex if you are using multiple platforms that do not integrate your data automatically.
Account Deactivation: One must be cautious as brokers can deactivate your demat accounts if you don’t use your demat account for a specific period of time.
Managing multiple Demat accounts can be challenging, but with proper strategies, you can stay organized and make the most of your investments. Here are some tips:
Use Different Accounts for Different Goals: Separate your long term and short term investments across the different accounts. This makes it easier to track performance and manage risk without confusing your trading objectives.
Choose the Right Platforms: Select the best stock trading platforms based on your specific needs. Some may offer low brokerage fees while others provide advanced research tools or better customer service. Match each account to its intended purpose.
Keep Track of Fees: Ensure you are aware of all charges such as annual maintenance fees (AMC), transaction costs, and taxes. Compare brokers and platforms to minimize unnecessary fees and avoid duplication of services.
Consolidate Statements: Regularly download and consolidate statements from each account. This helps is tracking your overall portfolio and simplifies the tax reporting process.
In conclusion, managing multiple Demat accounts can provide flexibility and better control over your investment strategies, but it requires careful planning. By using different demat accounts for specific goals and keeping a regular track of fees and portfolio performance, you can avoid unnecessary complications.
Regularly consolidating account statements and staying updated on regulations will also help investors smoothly navigate the markets. With these tips, you can efficiently manage multiple Demat accounts, ensuring that the benefits outweigh the challenges while optimizing your investment growth.
Frequently Asked Questions (FAQs)
Can I have more than one Demat account in India?
Yes, an individual in India can legally open and maintain multiple Demat accounts with different Depository Participants (DPs). However, you cannot have more than one account with the same DP.
Is there a limit to how many Demat accounts I can open?
No, there is no limit to the number of Demat accounts you can open as long as you comply with the KYC regulations set forth by SEBI for each demat account.
Аre there any charges for maintaining the multiple Demat accounts?
Yes, each Demat account comes with its own set of annual maintenance charges (AMC), transaction fees and other costs. It’s essential to consider these charges before opening multiple accounts.
Can I use multiple Demat accounts for different purposes?
Yes, many investors use multiple Demat accounts to separate their long-term investments from short-term trading or different financial goals, making the process of portfolio management easier.
Do I need a different PAN for each Demat account?
No, a single PAN (Permanent Account Number) is sufficient for opening multiple Demat accounts. However, the PAN must be linked to each account to comply with regulations.
If you are serious about your financial freedom and want to allocate your money to stocks, mutual funds, bonds, ETFs, etc., the first step you need to take is to open a demat account with a broker.
In this blog, we will discuss what a Demat account exactly is, its various benefits, and the process of opening one.
What is a Demat Account?
Demat account is simply an account where all of your securities, such as shares, ETFs, bonds, etc., are held in digital or electronic format. In this digital world, having a demat account or dematerialized account replaces the old system of shares trading in physical forms.
The government of India realized the need for dematerialization in 1996, as physical share certificates involve massive paperwork and can be stolen. Demat accounts have become game changers for various security holders as they are easy to open online or offline, are trustworthy, and offer a more secure way of trading and investing. The SEBI mandates that a stock market investor have a demat account.
Documents required to open Demat account
Now that you understand that opening a demat account is a prerequisite for trading or investing in capital markets, you must want to know which documents you would need to open a demat account. The list of documents is as follows:
PAN card
Proof of Address proof like an Aadhaar Card, driving license, passport, voter ID card, etc.
Proof of Income (for transactions in derivatives, futures and options)
Now that you know what a demat account is and why you as an investor need to open one, you might be wondering how you can open a demat account and begin your trading journey. Opening a demat account is easier and less time-consuming than opening a bank account. Here’s the step-by-step guide that you need to follow:
Step 1 – Select a Depository Participant
The first step is to select a Depository Participant (DP) with whom you want to open your demat account.
Step 2 – Complete the application form
After choosing a DP, you will need to click on “Open demat account” and fill out the form with the required information, such as name, email, contact details, PAN, DOB, etc.
Step 3 – At this stage, you will receive an OTP to verify your contact details. Enter the OTP and proceed ahead.
Step 4 – Add your bank account
In this step, you will need to add your bank account details, such as account number, account type, IFSC code, etc., to link your bank with your demat account.
Step 5 – Submit the necessary documents
Upload the scanned copies of the required documents, such as the PAN card, cancelled cheque, Adhaar card, etc.
Step 6 – In-person verification
You will also be required to complete in-person verification using a webcam or smartphone.
Step 7 – E-Sign
DPs provide this facility to applicants to E-sign the Demat account form using their Aadhaar-linked phone number.
Step 8 – Submit the form
After finishing the above steps, DP verifies your details, activates your demat account, and gives you a confirmation via message or email. You get your demat account number, login credentials, etc., after verification.
There are mainly three types of demat accounts according to the requirements of an investor:
Regular Demat Account – Regular Demat accounts are meant for investors residing in India. Regular demat accounts are offered by depository participants (DP) with no limit on the number or value of securities you can hold. Investors just need to pay a small annual maintenance charge ranging from Rs. 500 to Rs. 999 to the DP.
Basic Service Demat Account – BSDA is a basic form of regular demat account as it imposes low AMC on investors. As per BSDA, if an investor has a holding of less than or equal to Rs. 50,000, he is not liable to pay any AMC, but in case his holdings are between Rs. 50,000 and Rs. 2,00,000, he will be liable to pay a nominal AMC of Rs. 100 annually.
Repatriable Demat Account – As opposed to regular demat accounts, repatriable demat accounts are for non-resident Indians who want to invest in the Indian capital market or enable the transfer of funds outside India. The maximum amount you can repatriate is $1 million per year. NRI investors need to link their Non-Resident External (NRE) bank account to their demat account while opening a repatriable demat account.
Non-Repatriable Demat Account – As the name suggests, non-repatriable demat accounts are also meant for NRIs but it does not allow investors to transfer money received from the sale of securities outside India. Instead, they can transfer their proceeds to other Indian bank accounts. The NRI investor is required to have a Non-Resident Ordinary (NRO) bank account linked with the demat account.
Benefits of a Demat Account
Demat accounts have made the process of buying and selling securities very easy and quick. The frequency of trading and transferring of securities have increased since its implementation. Below are the benefits of having a demat account:
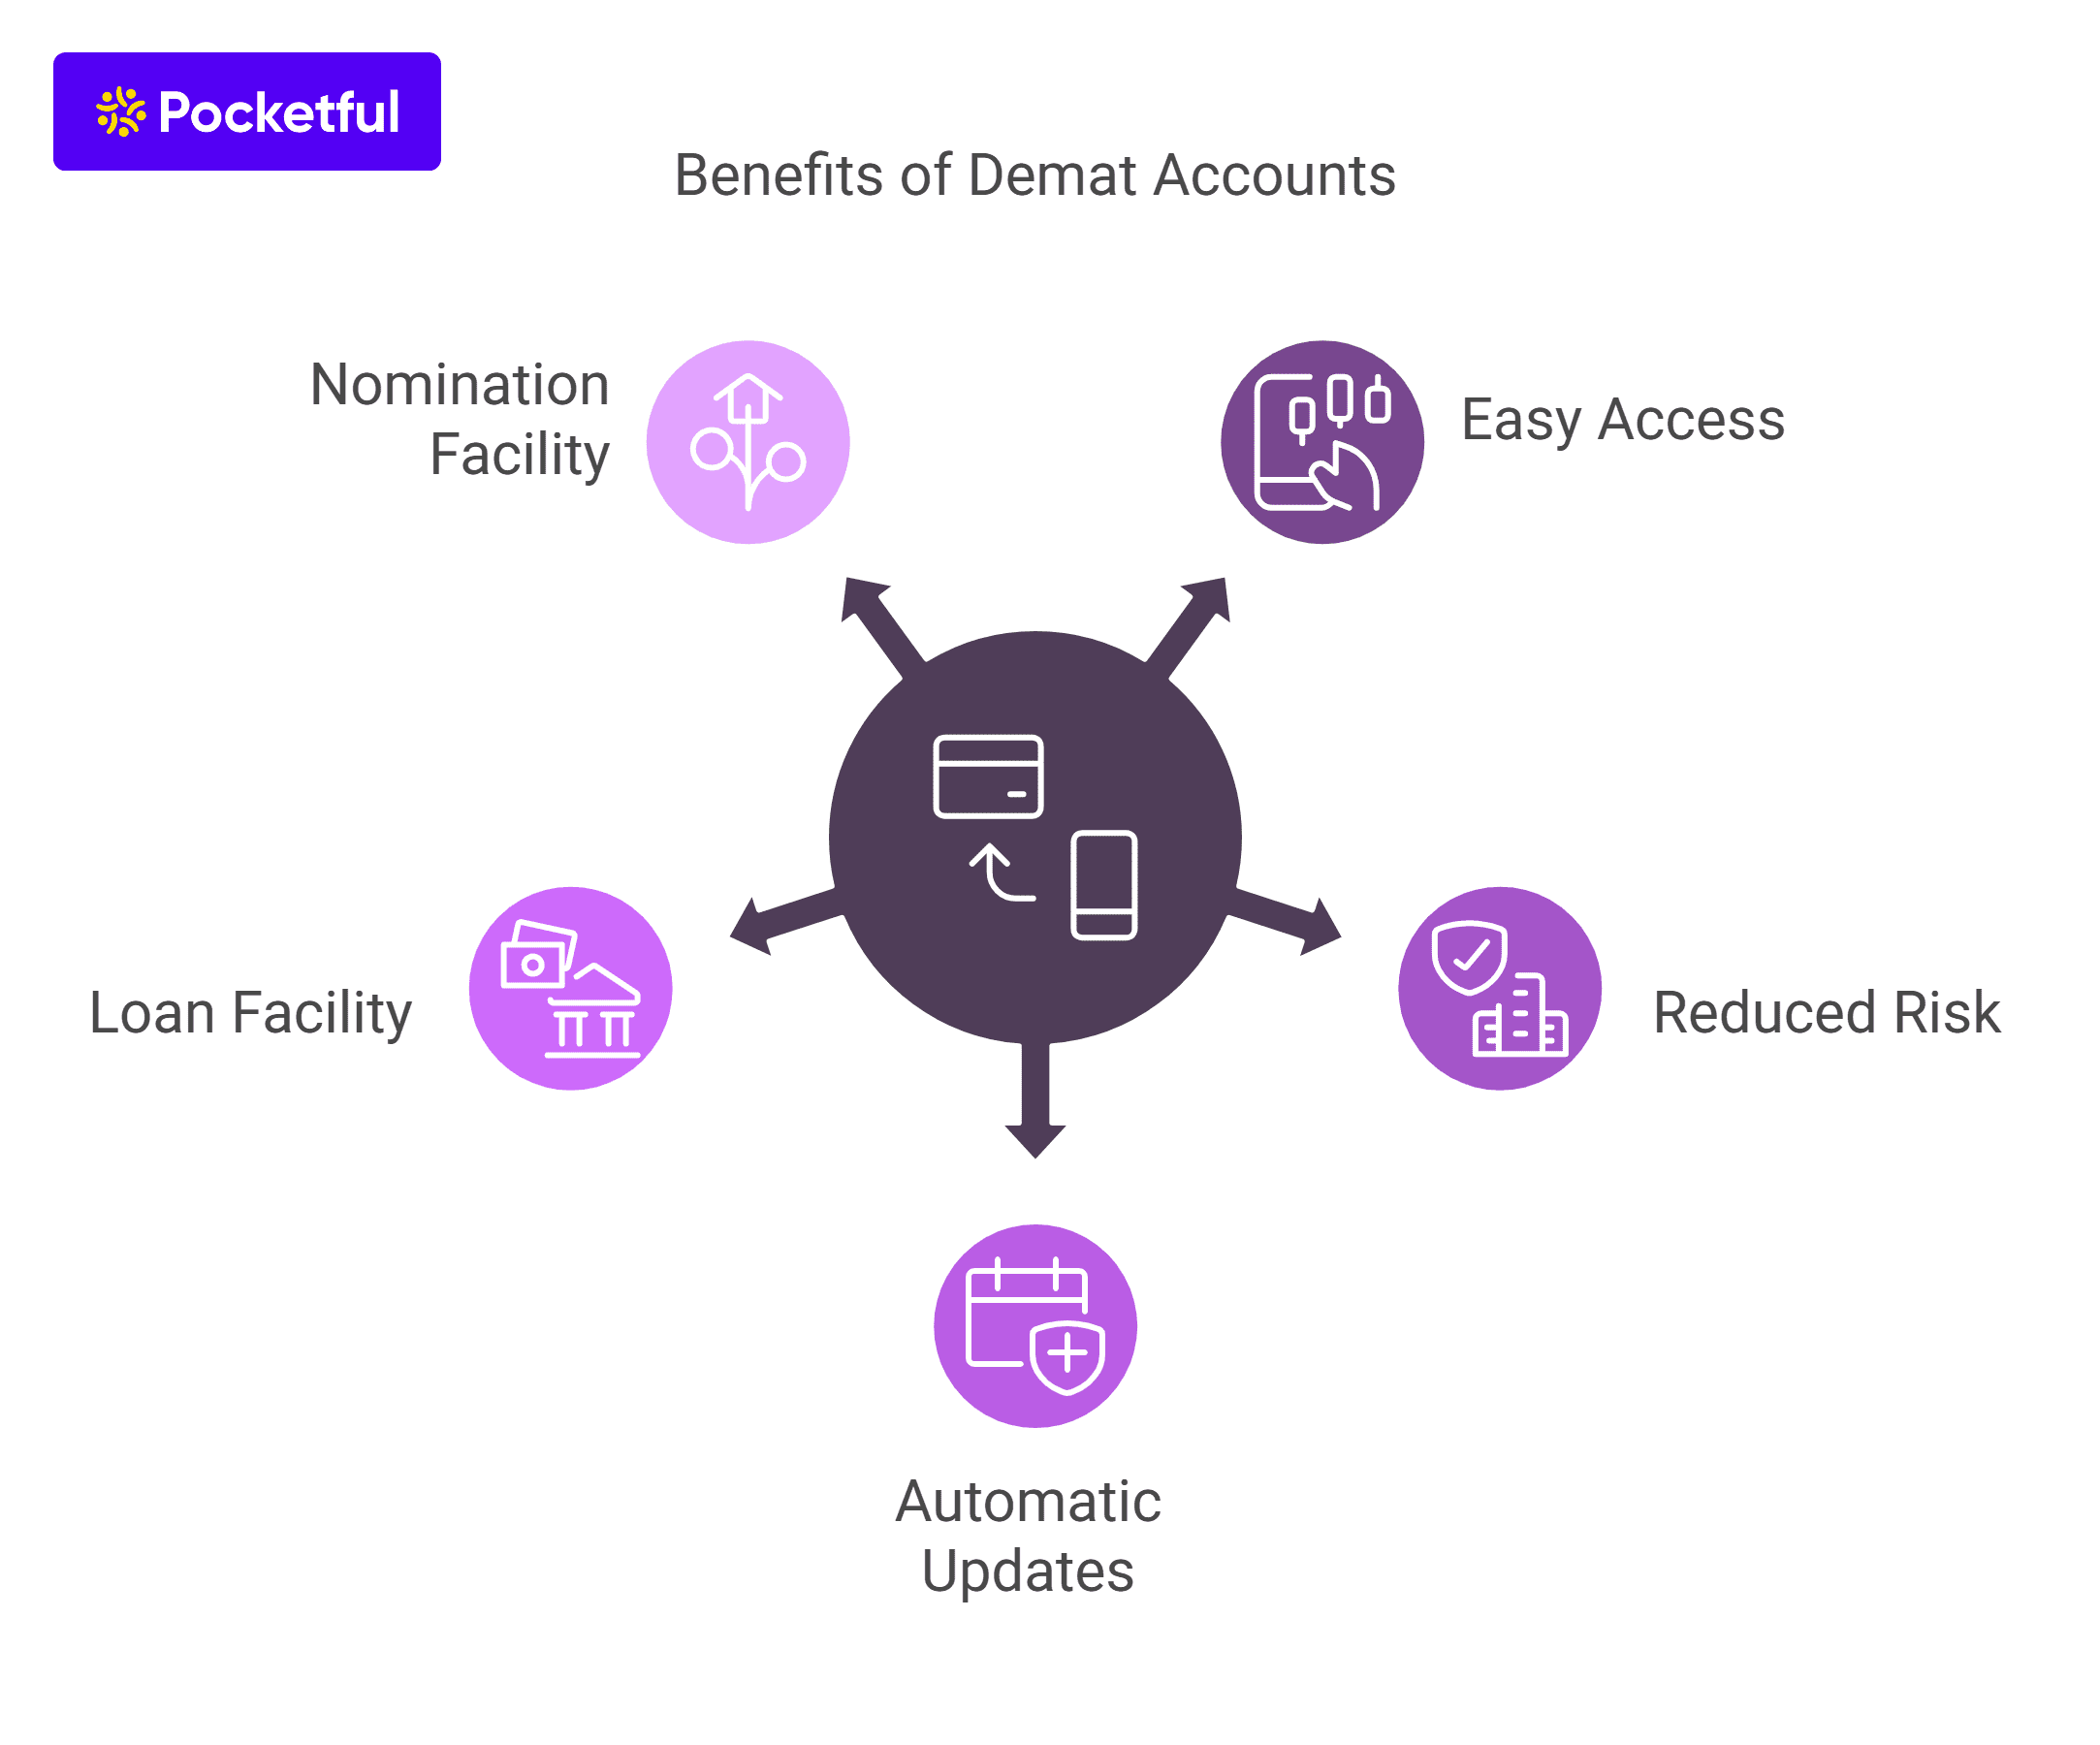
Easy Access – Investments through demat accounts are very easy. Investors can assess their demat accounts at any time and anywhere.
Reduced Risk – Before demat accounts were introduced, there were high risks of theft, forgery, loss, and tampering with shares in physical form. Problems like delays, extensive paperwork, and errors have also been eliminated after the introduction of demat accounts.
Automatic updates related to bonuses, and stock splits – Any events related to your stocks, such as bonus issues, stock splits, or reverse stock splits, are updated automatically.
Loan Facility – You can obtain secured loans from banks by pledging the securities held in your demat account as collateral.
Nomination Facility – Demat accounts offer a nomination facility, and in the event of an investor’s demise, all the holdings of the Demat account are transferred to the appointed nominee.
A Demat account is essential for everybody who is planning to invest in the financial markets. It makes the holding and trading of securities easier, safer, and more efficient. There are different types of demat accounts with different benefits. Setting up a demat account is an uncomplicated process, providing a range of benefits to the investors, such as loan facility, reduced risk, and easy access to investments.
Frequently Asked Questions (FAQs)
Why is there a need for a demat account?
The key objective of a Demat account is that the securities are held in digital form, thereby reducing risks involved in the processes of buying and selling as well as managing the relevant investments.
Is it possible to open a demat account online?
Yes, it is possible to open a demat account online.
What needs to be submitted to open up a demat account?
Usually, a PAN card, any ID proof, proof of address, bank details, income proof, photographs and scanned signatures are required.
Do you have to pay any charges for having a demat account?
Yes, investors have to pay annual maintenance fees, which can vary depending on the category of the demat account being used.
Can someone trade in stocks without a Demat account?
An individual must have a Demat account in order to buy and sell shares in India.
Traders use various patterns to understand market behavior and base their investment strategies on them. These patterns are an effective tool to form a calculated investment decision that translates into attractive returns. One such tool is swing trading patterns, which are extremely useful if you follow the swing trading approach in the financial markets.
Using these patterns wisely can be a roadmap to finding the right stocks at the right time. This must have astonished you often how some people probably know the perfect moment to buy or sell stocks. It seems they know exactly when to trade and when not to. This is not a fluke, but it happens due to strategic trades that are backed by these chart patterns.
By understanding trading patterns, you can determine when to put your money in and when to cash out. Let us try to understand this in detail through this blog, where we will go through various swing trading concepts. We will also learn about the best chart patterns for swing trading.
What is a Swing Trading Pattern?
A swing trading pattern is a chart pattern most effective in predicting market trends, including reversals and continuations for swing trading. These patterns are established through historical price data, which reflects how the stock price has behaved in the past.
Swing trading is a little different from day trading. In intraday, trades are executed with the aim of holding the positions for a few minutes to a few hours. In swing trading, a trader holds trades for a few days to several weeks. Patterns form the basis for making informed decisions about entry and exit points. They help traders identify moments when the price is likely to shift in their favor, whether it’s a bullish move or a bearish move.
In order to master the swing trading strategy, you need to recognize and understand these swing trading chart patterns. In the simplest terms, a swing trading pattern refers to a distinct formation or shape that manifests on stock charts, signaling potential future price movements. If you look at them closely, these patterns will provide you with visual indicators, offering signals about the future direction of a stock’s price, whether it may increase or decrease. By carefully analyzing these chart patterns, you can gain insights into market behavior. It helps you decide when to buy or sell a stock based on your understanding of the anticipated movement. Incorporating these patterns into your trading strategy can take your trading game to the next level.
When it comes to swing trading, there are some chart patterns that every trader should be familiar with. Below is a cheat sheet of swing trading patterns that have proven their reliability over time:
Head and Shoulders Pattern
Double Top and Double Bottom Patterns
Cup and Handle Pattern
Flag Pattern
Ascending and Descending Triangle Patterns
Symmetrical Triangle Pattern
Rounding Bottom Pattern
Rising and Falling Wedge Patterns
Overview of Best Swing Trading Patterns
All the above-mentioned chart patterns for swing trading hold their significance. You can use one or multiple to create your trading strategy. For example, the Head and Shoulder Pattern is highly reliable in case of reversals. Whereas, Flag Pattern might be ideal for predicting a continuation.
The best idea is to use these chart patterns once you have substantial knowledge, which is provided below.
1. Head and Shoulders Pattern
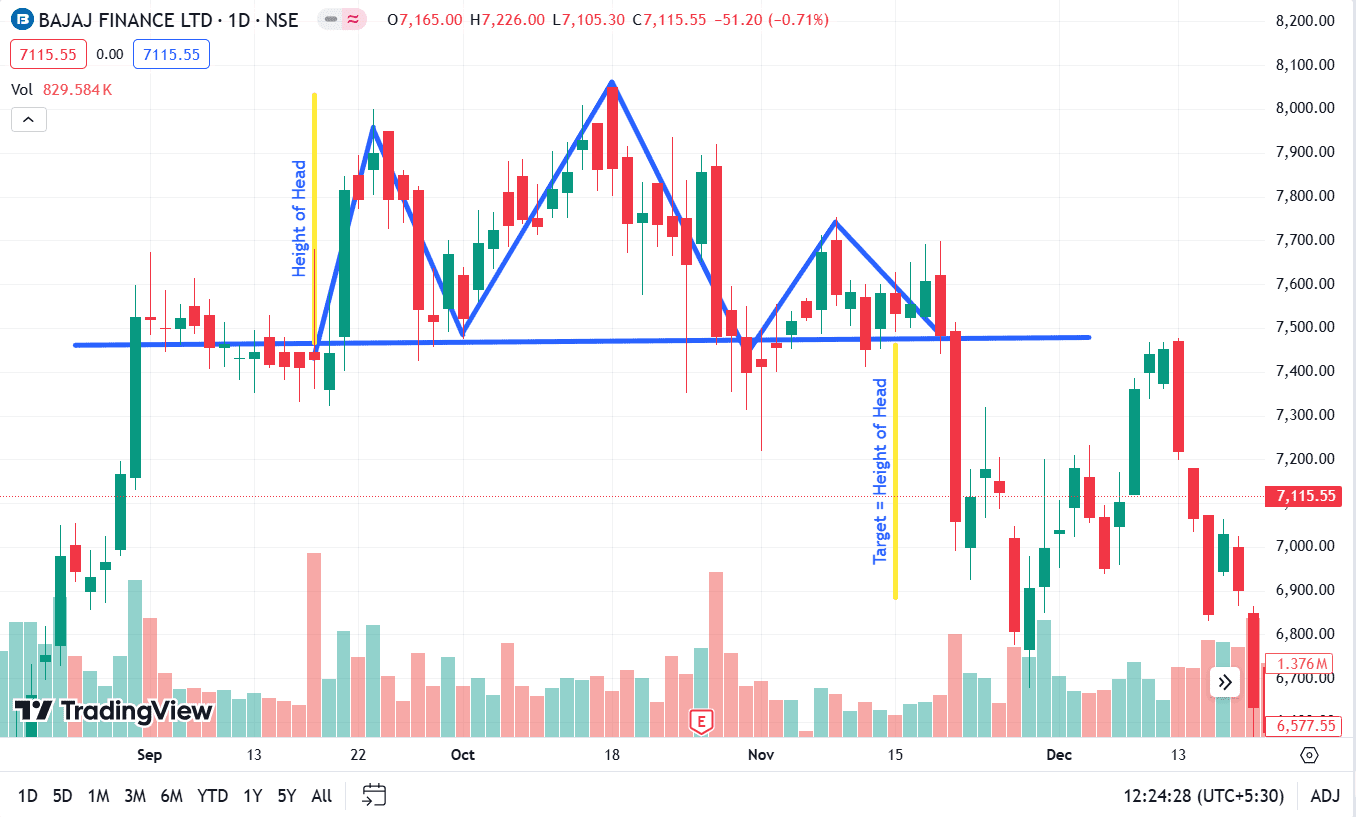
It is one of the most popular swing trading patterns and indicates a bearish reversal. The Head and Shoulder Pattern consists of three peaks- a higher middle peak (the head) flanked by two lower peaks (the shoulders). When the price breaks below the neckline (the support line that connects the two shoulders), it signifies the beginning of a bearish trend.
How to trade: One should wait for the price to break below the neckline before creating a short position. A stop-loss can be placed just above the neckline and targets near the major support levels.
Key Points
This pattern often indicates the end of a bullish trend.
Traders can create a short position when the price breaks below the neckline.
Example: Head & Shoulders example of Bajaj Finance Ltd.
2. Double Top and Double Bottom Patterns
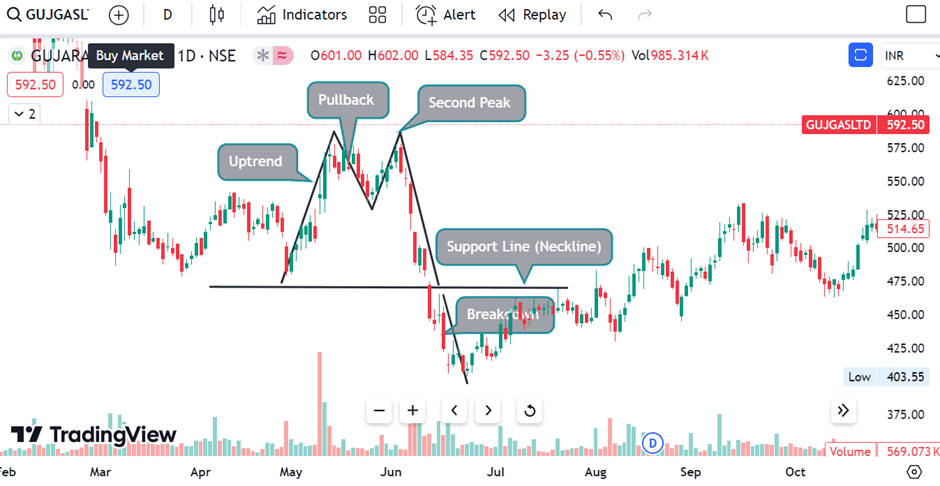
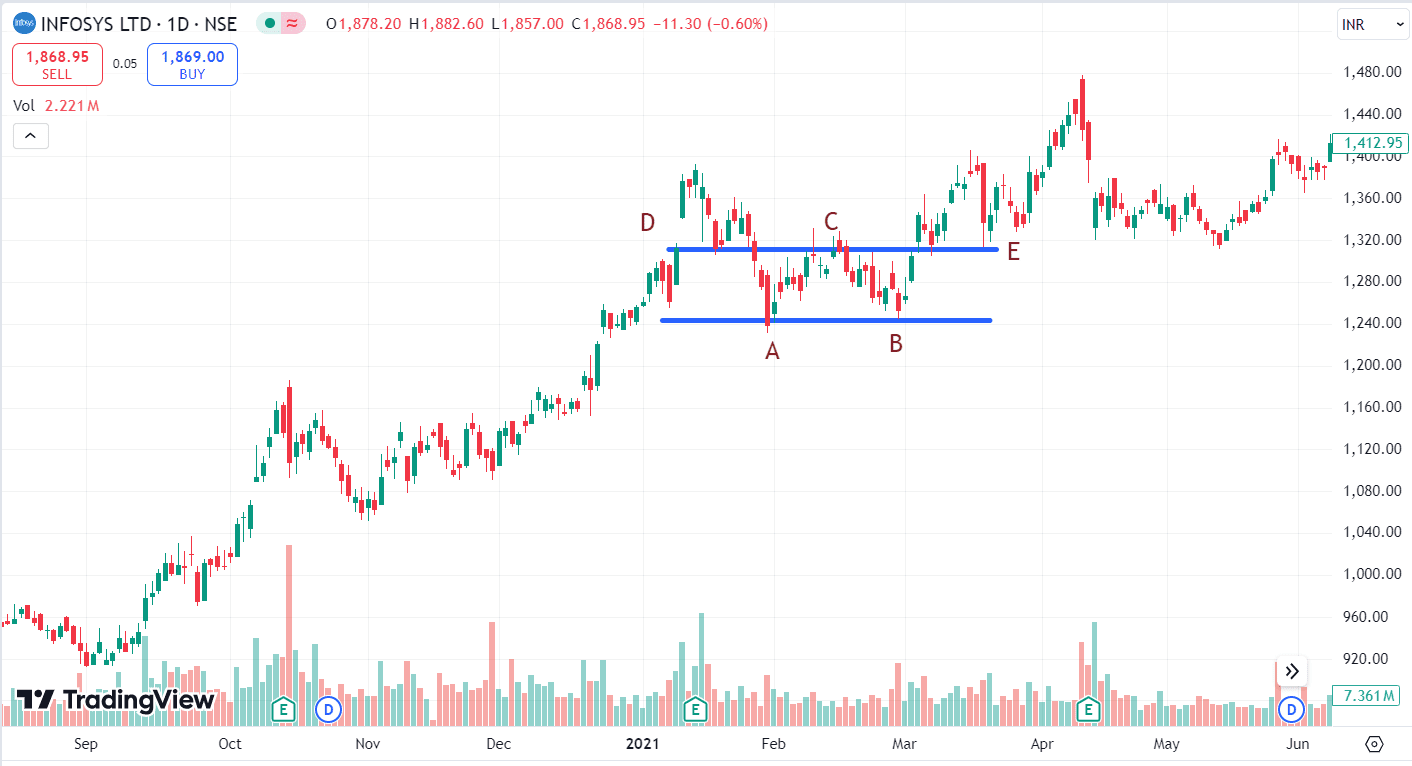
The Double Top is a bearish reversal pattern that forms after an asset price reaches a similar price level twice in an uptrend. However, the asset price declines moderately in between. If the price moves below the support level, it is a signal that the market will decline further.
On the contrary, the Double Bottom is a bullish reversal pattern. It forms when the price hits a similar low level twice in a downtrend. The breakout above the neckline confirms the uptrend.
How to trade: For the Double Top pattern, sell or create a short position once the price breaks below the support level. For a Double Bottom, buy or create a long position once the price moves above the resistance level.
Key Points:
The Double Top signals a bearish reversal, while the Double Bottom signals a bullish reversal.
They are commonly used for short to medium-term trades.
Example: Double Top
Example: Double Bottom
3. Cup and Handle Pattern
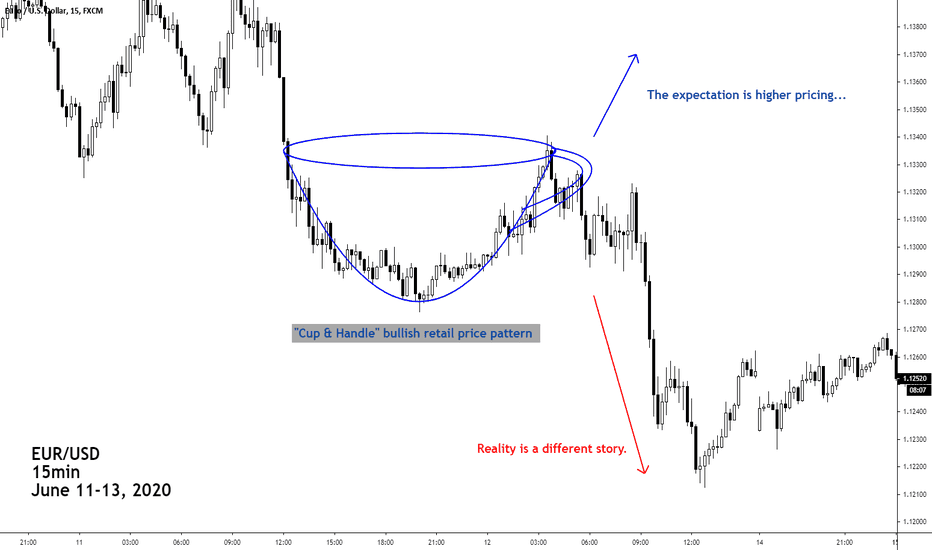
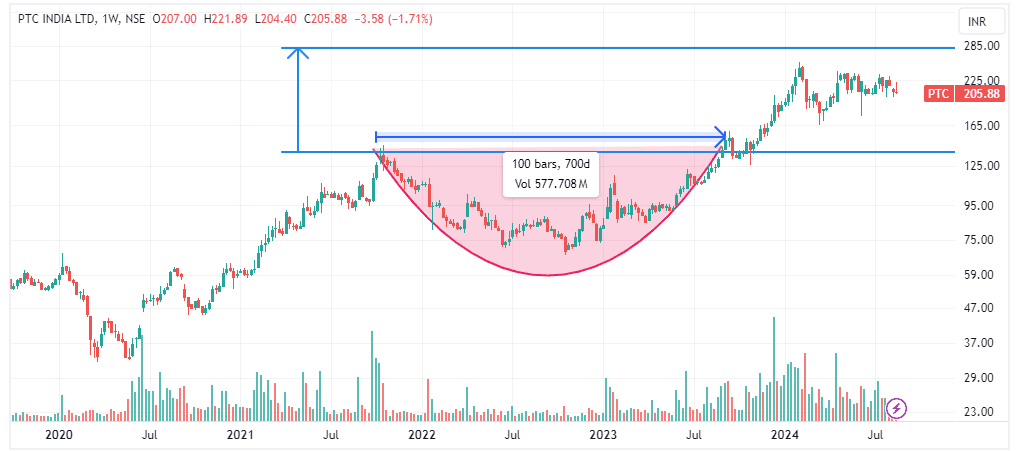
It is a bullish continuation pattern. It signals a possible upward movement after a consolidation period. The “cup” resembles a “U” shape, followed by a handle formation after a slight downward drift. In this pattern, we see a consolidation and an upward movement once the asset price moves above the resistance level.
How to trade: You should closely monitor the resistance level above the top of the handle. If the price gives a breakout above this, it is probably the best time to enter.
Key Points:
It’s a bullish continuation pattern indicating the continuation of an uptrend.
Traders can enter a long position once the price gives a breakout.
Example: Cup and Handle Pattern
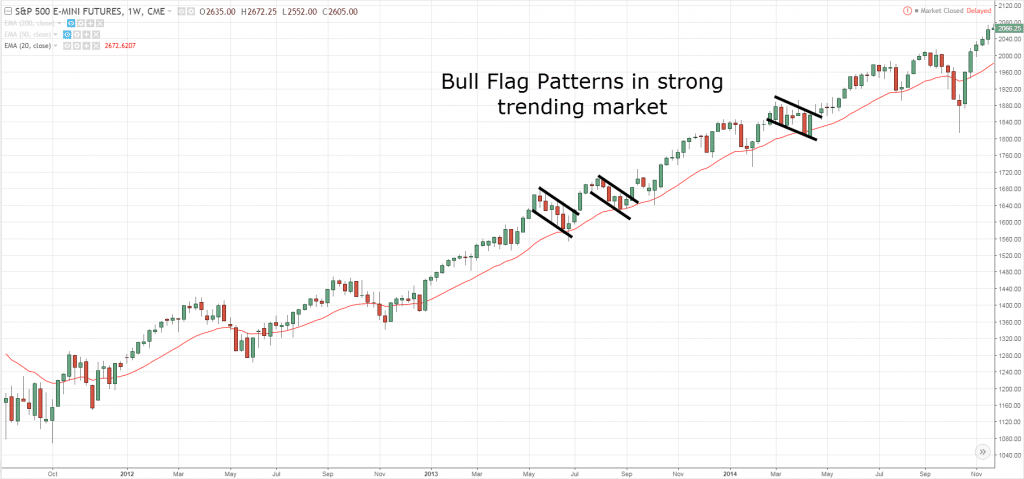
4. Flag Pattern
It is a continuation pattern as the asset price moves in the same direction as the prior trend after a slight consolidation period. The flag pattern occurs after a strong price movement, either bullish or bearish. Henceforth, the price moves within a narrow range, forming a flag shape. Many traders use this pattern to form their trading strategy. You can also consider this for better results.
How to trade: If the price gives a breakout in the direction of the previous trend, it is suggested to create a position to profit from the continuation of the prior trend. Also, the breakout backed by higher volume indicates a higher probability that the trend will continue further.
Key Points:
The flagpole represents the initial strong price movement, while the flag represents the consolidation phase.
Traders often look for a breakout above or a breakdown below the flag to confirm trend continuation.
Example: Flag Pattern
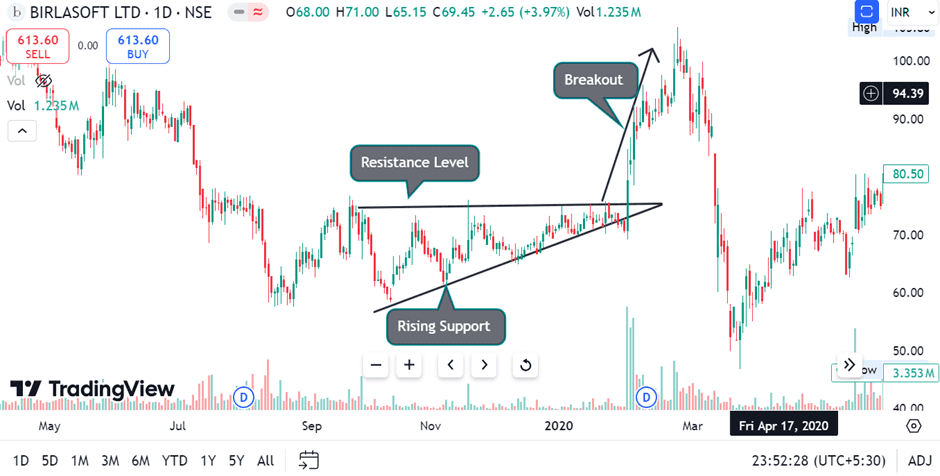
5. Ascending and Descending Triangle Patterns
The Ascending Triangle is a bullish continuation pattern characterized by a horizontal resistance line and an ascending trendline. If you analyze the chart, you will see the lower lows, creating an ascending line, while the highs are similar. The price repeatedly tests the resistance level, indicating buying pressure. If you encounter a breakout above the resistance level, it signals a bullish trend continuation.
On the contrary, the Descending Triangle is a bearish continuation pattern with a horizontal support line and a descending trendline. The price repeatedly tests the support level, and a breakdown below this support indicates a bearish trend continuation.
How to trade: If you are using the Ascending Triangle pattern, a breakout above the resistance line can be the right time to buy. Whereas, in the Descending Triangle pattern, sell or create a short position if the price moves below the support line.
Key Points:
Ascending Triangles are bullish patterns, while Descending Triangles are bearish.
They are most effective when combined with volume analysis to confirm the breakout.
Example: Ascending Triangle Patterns
Example: Descending Triangle Patterns
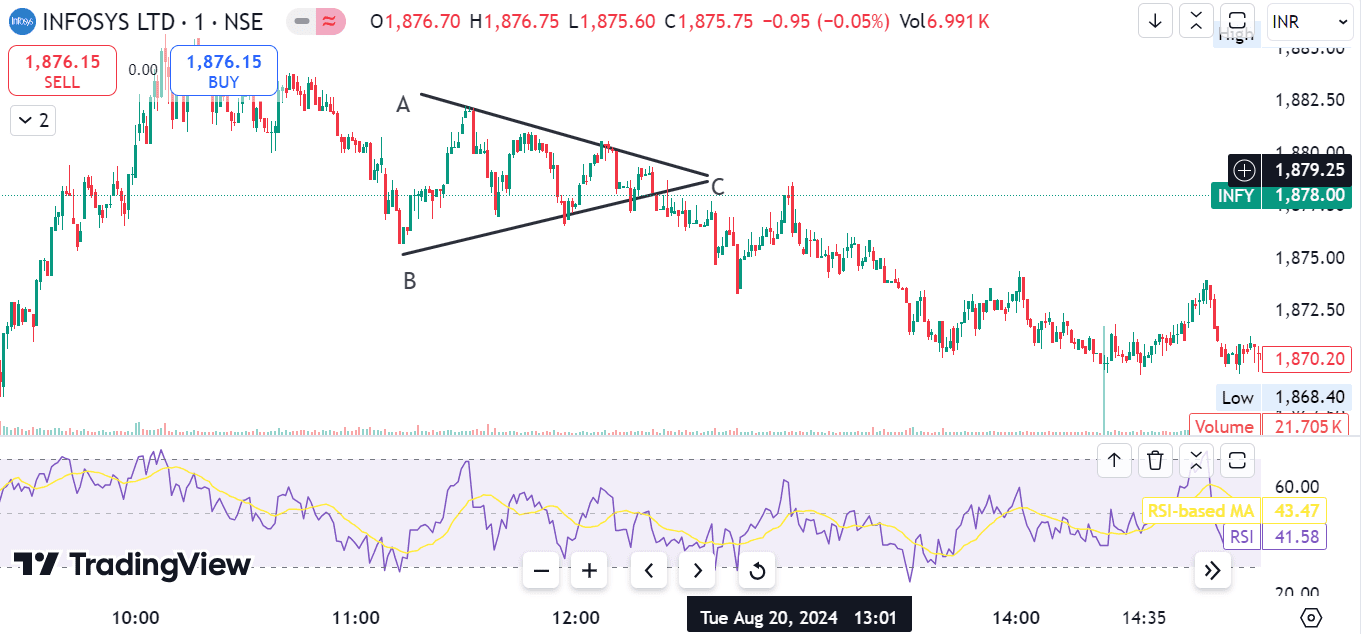
6. Symmetrical Triangle Pattern
It is one of the best swing trading patterns. The Symmetrical Triangle is a neutral continuation pattern, as it suggests that the price can give a breakout in either direction. It forms when the price makes lower highs and higher lows, converging into a point. Traders often wait for a breakout above or below either trendline to confirm the future trend direction.
How to trade: Since it is a neutral pattern, you should wait for the breakout to occur before making a move. If you see a breakout above the upper trendline, it can be the right time to buy. Whereas, a breakout below the lower trendline may indicate short positions or selling is beneficial.
Key Points:
It’s important to wait for confirmation before entering a trade since the breakout can be in any direction.
This pattern is commonly seen during periods of consolidation.
Example: Symmetrical Triangle Pattern
7. Rounding Bottom Pattern
Rounding Bottom Pattern is a bullish reversal pattern, indicating a gradual shift from a bearish to a bullish trend. It forms over a longer time frame, and the curve resembles a “U” shape. Once the price breaks above the resistance level formed by the upper part of the rounding bottom, it signifies the beginning of an uptrend.
How to trade: A breakout above the resistance level indicates an upward trend. You can utilize it to create a log position. Additionally, place a stop-loss right below the breakout point to manage the risk in case of a false breakout.
Key Points:
It’s a long-term reversal pattern, signaling the end of a bearish trend and the start of a bullish trend.
This pattern can provide good entry points for long-term swing trades.
Example: Rounding Bottom Pattern
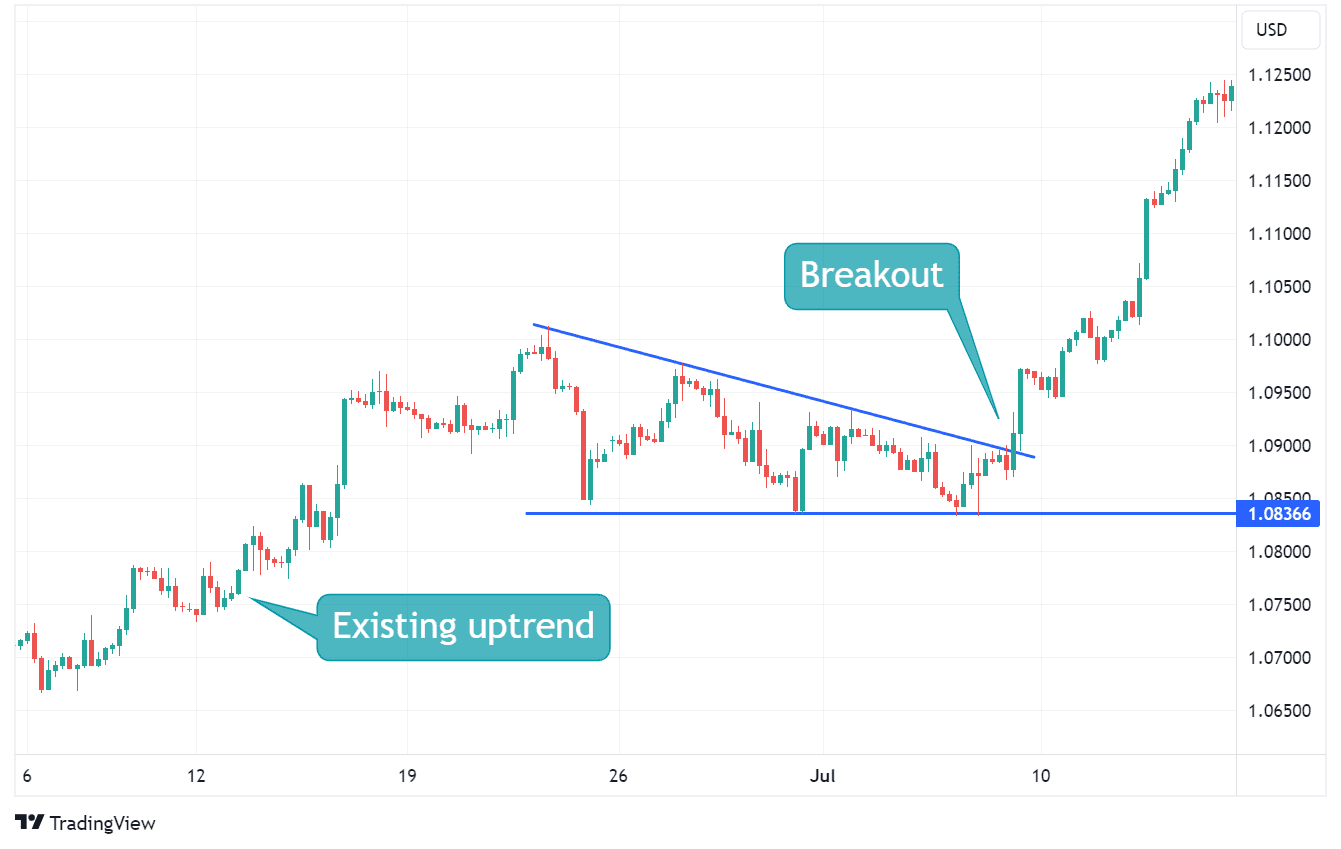
8. Rising and Falling Wedge Patterns
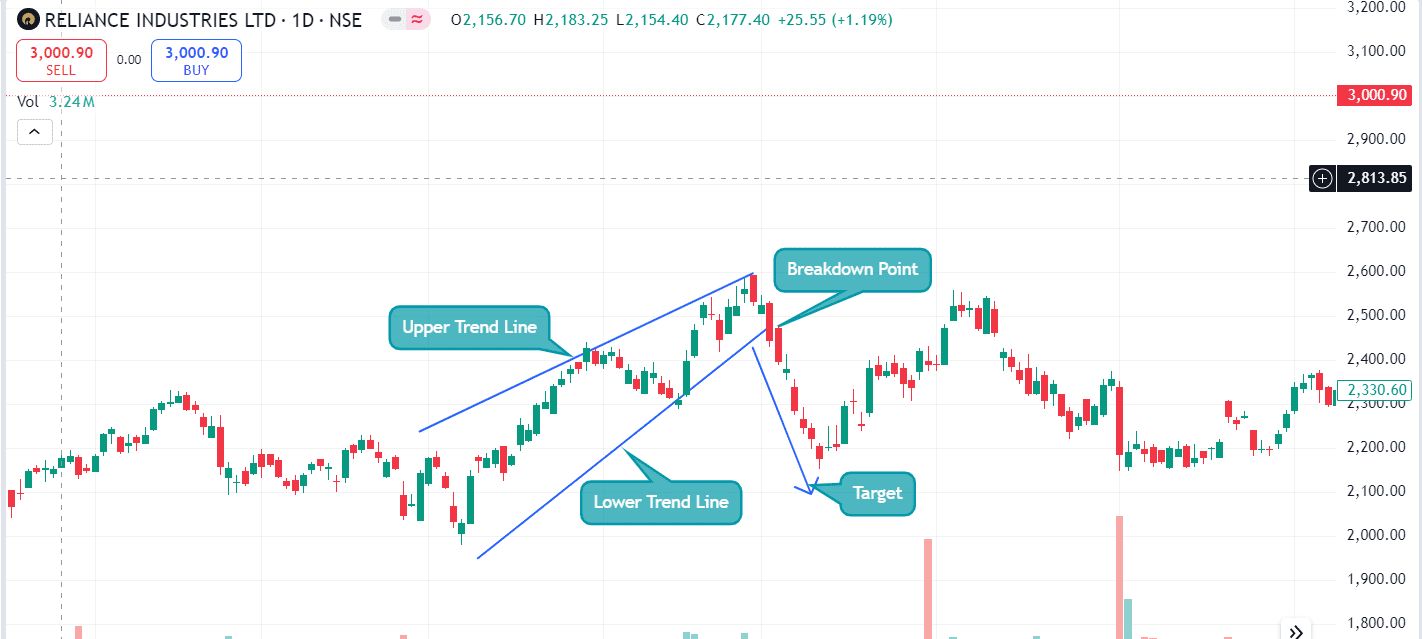
It is another bearish reversal pattern. The Rising Wedge pattern forms when the price makes higher highs and higher lows. If the price breaks below the lower trend line of the wedge, it indicates a bearish trend.
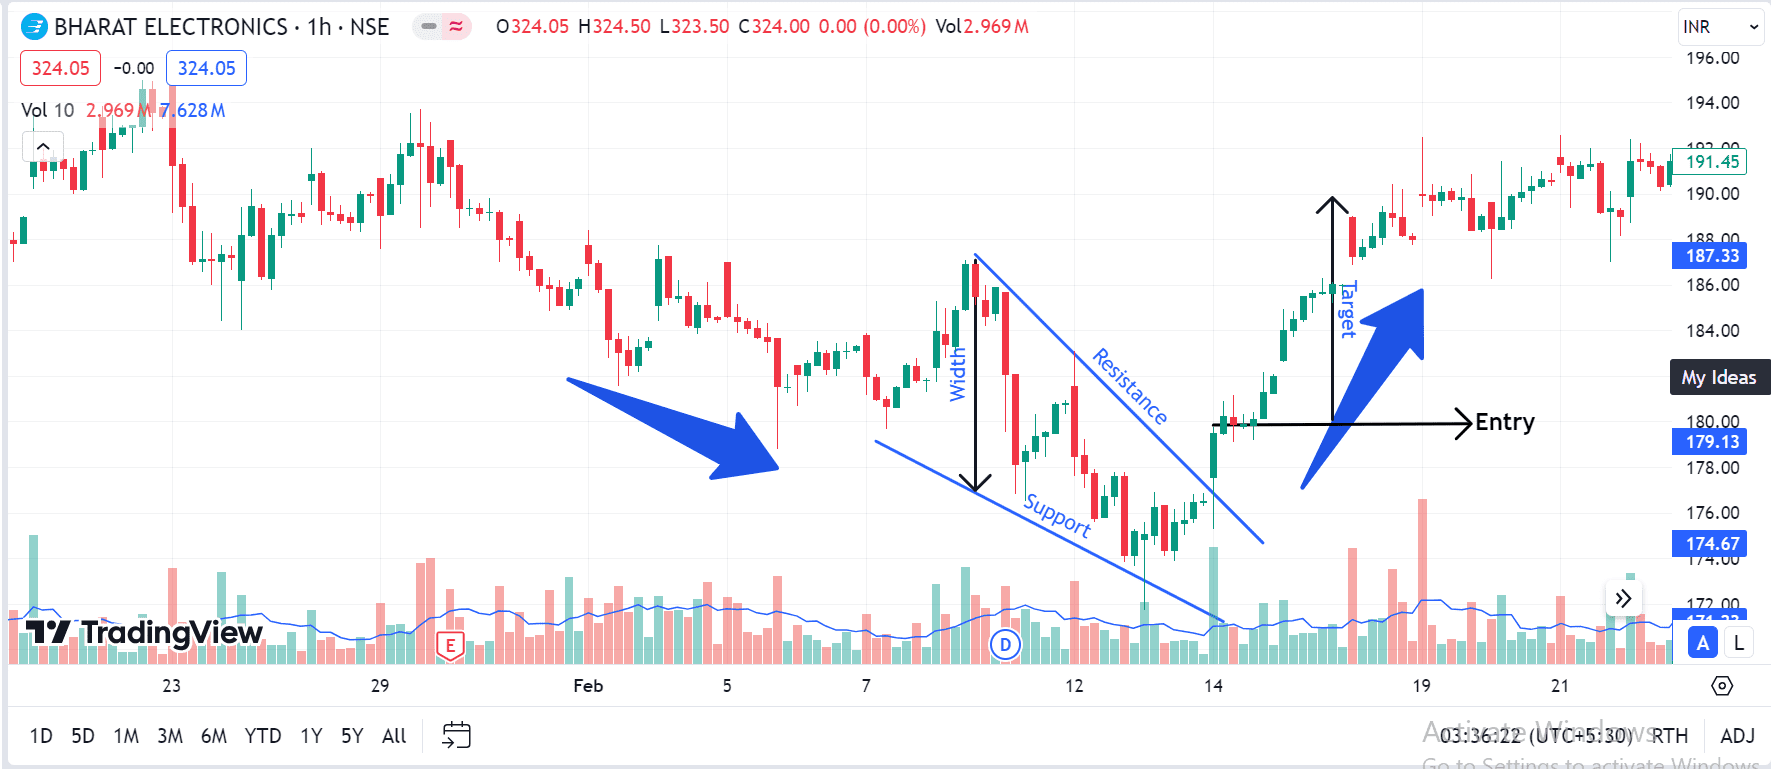
The Falling Wedge is formed when the price makes lower highs and lower lows. A breakout above the resistance line or upper trend line of the wedge indicates a bullish trend.
How to trade: In the Rising Wedge pattern, the price moving below the lower trend line confirms a bearish reversal. You can sell or create a short position, as the price might decline from here.
In the Falling Wedge pattern, use the opposite technique. Wait for a breakout above the upper trendline, which signals a bullish reversal. Following this trend, you can buy as the price might rise from here.
Key Points:
The Rising Wedge pattern signals a bearish movement, while the Falling Wedge pattern signals a bullish movement.
These patterns are useful for early prediction of upcoming market trends.
Example: Rising Wedge Patterns
Example: Falling Wedge Patterns
The Importance of Swing Trading Patterns
Understanding the signals of swing trading patterns will give you a better idea of market behavior and help you trade more strategically. The most important aspect of these patterns is that they provide you with a roadmap about when and what to do.
Swing trading is more than just buying and selling based on market whims. You can leverage these patterns to identify price movements that others might miss. Here’s why these patterns are important:
Identifying Trend Reversals
Certain chart patterns signal when a current trend is losing strength. It can be a clear signal that you should prepare for a reversal. Moreover, syncing your entry with the signals generated by the chart pattern gives you optimum results. The exit point is also crucial for locking in profits before the market shifts in the opposite direction.
Predicting Continuations
Knowing how long to hold on to your investment is equally important as when to sell them. Patterns also indicate when a price trend is likely to continue, enabling traders to hold investment positions longer for maximum gains.
Providing Entry and Exit Points
As mentioned earlier in the blog, an accurate interpretation of swing trading patterns can give you precise points for entering and exiting trades. It will help you minimize risks and maximize returns.
Risk Management
Patterns assist in setting stop-loss levels and reducing potential losses when the market moves against your position. When you interpret these patterns closely and strategize your trades around them, you can anticipate market behavior in a better way. It will definitely reduce the risk of making unnecessary and risky trades and help you get the optimum results.
After learning the importance and the fundamental mechanism of swing trading and related patterns, it is essential to get acquainted with different aspects of these patterns. There are several chart patterns for swing trading. Let’s discuss this group of chart patterns in detail.
Using Technical Indicators with Patterns
Swing trading patterns are highly popular among traders for their flexibility and reliability. However, experts suggest that using them with other technical indicators may enhance your chances of success. Indicators such as Moving Averages, Relative Strength Index (RSI), and MACD (Moving Average Convergence Divergence) can provide additional confirmation for pattern breakouts or reversals.
For example,suppose the asset price makes an Ascending Triangle pattern and gives a breakout above the resistance level formed by similar highs. Look at other indicators such as Moving Averages, volume, and RSI for confirmation. If the asset price is taking support from the Moving Average line, RSI reading is below 30 and the breakout occurred with high volume, then there are high chances of a bullish trend.
Advantages of Swing Trading
The best way of trading is to find the perfect balance between risk and reward. You should always focus on keeping the risk lower than the expected reward. This is where a swing trading pattern can be highly useful. It has multiple benefits that may make your trading journey smooth and pleasant. Here are a few of them:
Flexibility: Swing trading allows traders to maintain a regular job or lifestyle while holding onto strategic trades over a few days or weeks.
Fewer Trades: Unlike day trading, swing traders don’t need to place multiple trades daily. This results in lower transaction costs and less time consumption.
Higher Profit Potential: In swing trading, you hold onto your positions for long durations. Thus, there is more time to capture big price moves, increasing the chances of higher profits.
Clear Trend Identification: Swing trading patterns make it easier to spot trends and reversals, which are vital for making timely and informed decisions.
Less Time-Consuming: You don’t need to monitor your trading account constantly. Instead, you can set alerts or automate trades based on specific pattern breakouts.
Swing trading can be an ideal choice for those who seek a balance between trading and long-term investment. By learning the different swing trading patterns mentioned in the blog, you can make better trading decisions and maximize your profit. However, it is advisable not to blindly rely on one pattern. Also, backing up these patterns with other technical indicators may increase accuracy and bring better results. However, it is advised to consult a financial advisor before making any trading decisions based on the above patterns. So, open a trading account and give your trading passion wings to fly.
Frequently Asked Questions (FAQs)
What is a Swing Trading pattern?
A swing trading pattern refers to chart patterns that are useful in doing swing trading. These patterns help traders predict future price movements, such as reversals or continuations, and allow them to make informed decisions about when to buy or sell stocks.
What are the most common swing trading patterns?
Some of the most common swing trading patterns include the Head and Shoulders pattern, Double Top and Double Bottom, Cup and Handle, Flag pattern, Ascending and Descending Triangles, Symmetrical Triangle, Rounding Bottom, and Wedge pattern.
How can swing trading patterns help manage risk?
It allows traders to identify crucial entry and exit points. Consequently, they can set stop-loss levels according to the pattern signals to minimize potential losses.
What are the advantages of swing trading compared to day trading?
Unlike intraday trading, swing trading allows traders to hold positions for several days or weeks. Thus, they can trade without stressing their daily routine much.
Can swing trading patterns be combined with technical indicators?
Yes, combining swing trading patterns with technical indicators can provide additional confirmation and increase the accuracy of trades.
How do I know when to enter or exit a trade using swing trading patterns?
Swing trading patterns provide visual cues for determining optimal entry and exit points. For example, in the Head and Shoulders Pattern, a trader can enter when the price breaks below the neckline and exit the position near the major support level.
The Indian Stock Market has seen a lot of new investors in the past few years. However, the Indian stock market has not only attracted new investors, but many companies have also turned to financial markets to raise capital. If you’re new to the financial markets and want to know how many companies are listed on the Indian stock exchange or want to learn about the procedure a company follows to get listed on the Indian stock exchange, then this blog is for you.
In this blog, we will tell you how many companies are listed on NSE and BSE, compare NSE and BSE, and discuss the process a company must follow to get listed on the Indian stock market.
Overview of NSE
The National Stock Exchange, or NSE, is one of the top stock exchanges in India and handles a significant daily trading volume, which is among the highest across the world. It was established in 1992, and in 1994, it introduced electronic trading facilities. It became the first exchange in India to provide derivatives trading and today has become the world’s largest derivative exchange. The business debuted the Nifty 50 index in 1996, which follows the movement of the top 50 stocks listed on the National Stocks Exchange according to market capitalization. The NSE is owned and run by various financial organizations such as banks, insurance companies, and other businesses. The Securities and Exchange Board of India (SEBI) oversees its operations. NSE’s corporate headquarters is in Mumbai.
Overview of BSE
Bombay Stock Exchange, or BSE, is Asia’s biggest and most efficient stock exchange. Premchand Roychand established the company in 1875 and was then named as “Native Share and Stock Brokers Association.” The Securities Contract Regulation Act was introduced in 1956, and the Government of India officially made it the official stock exchange. The exchange unveiled the first index, the BSE Sensex, in 1986 as the benchmark of the top 30 listed businesses according to free-float market capitalization. They raised funds from the general public to continue their expansion, and in 2017, they got listed on the Indian stock exchange. The Indian Clearing Corporation Limited (ICCL) is a subsidiary of BSE and provides clearing, settlement and risk management to BSE. The organization’s corporate office is in Mumbai.
How Many Companies are Listed on NSE and BSE in 2026?
In recent times, many companies have launched IPOs and have added to the total number of firms listed on the NSE and BSE. The total number of firms listed on NSE and BSE are:
NSE: A total of 2,379 firms, comprising all three market capitalizations—large cap, mid-size, and small-cap—are listed on the NSE in India, according to statistics released by the National Stock Exchange on 31 March 2024. A total of 124 companies are listed on the exchange which are not available for trading. All listed companies on the NSE have a combined market capitalization of INR 454.64 lakh crores as of 21 August 2024.
BSE: As of 18 October 2024, the market capitalization of all 5,511 listed businesses on the Bombay Stock Exchange is INR 459.41 lakh crores. The 5,511 companies don’t include Exchange Traded Funds, Real Estate Investment Trusts, Infrastructure Investment Trusts, and Differential Voting Right Shares.
We have provided you with the comparison between the NSE and BSE below-mentioned table-
Particular
NSE
BSE
Foundation
NSE was founded in 1992.
However, BSE was established in the year 1875.
Listed Companies
There are 2,379 companies listed on NSE.
BSE has 5,511 listed companies.
Index
Nifty 50 is the major index of NSE, tracking the top 50 companies. It also has sector indexes.
SENSEX is the flagship index of BSE, tracking the top 30 companies.
Trading Volume
NSE has a higher trading volume than BSE.
BSE has more listed companies but its trading volume is lower than NSE.
Market Capitalization
NSE has a lower market capitalization than BSE.
BSE has a higher market capitalization than NSE.
Technological Advancement
NSE uses more advanced technology; it was the first exchange in India to introduce an electronic trading system.
Initially, BSE was engaged in providing floor base trading, but they are also providing online trading platforms, but they are still behind in terms of the latest technology implementation.
Derivative Segment
It focuses more on the derivative segment.
BSE focuses on the equity cash segment.
Listing Process in the India Stock Market
The company that decides to go public launches an initial public offering (IPO) and can pick between NSE and BSE, or it can list on both stock exchanges. The following are the steps one must take to get listed:
Eligibility Criteria – The initial step towards getting listed on the Indian stock market is to meet the eligibility criteria set out by the Securities and Exchange Board of India related to financial statements, corporate governance, etc.
Appointment of Merchant Banker – The next step towards the listing process is the appointment of a merchant banker or lead manager, who will be responsible for handling all the procedures related to the IPO.
Filing of Regulatory Documents – The Merchant Banker prepares the documents related to the IPO and files the Draft Red Herring Prospectus (DRHP) with the SEBI and the exchange.
Approval from SEBI – SEBI and the exchange verify and approve the application if all the required criteria are met.
Issuance of RHP – The merchant banker files the Red Herring Prospectus with ROC, which states the details related to the IPO.
Issuance of IPO – The IPO will be opened for subscription, and investors can place their bids through ASBA (Application Supported by Blocked Amount) to subscribe to the IPO.
Allotment of Shares – The shares get allotted to the investors who had subscribed to the IPO in case of an undersubscribed IPO. If the IPO is oversubscribed, the registrar conducts a lottery to allot shares.
Listing – This is the last step, where the company gets itself listed on the stock exchange, and its shares begin to trade.
The Future Outlook for NSE and BSE
The National Stock Exchange and the Bombay Stock Exchange have significant growth potential as they are the major exchanges in the Indian financial system. Additionally, the expansion of NSE and BSE will continue due to the rise in the number of investors and economic growth. Also, due to the higher long-term return on equity investments, people are becoming more aware of their advantages. Additionally, foreign investors are drawn to Indian equity because they have the chance to participate in India’s growth narrative by investing in Indian equities through the NSE and BSE.
The National Stock Exchange and the Bombay Stock Exchange play a significant part in the country’s economic development. They give investors and companies a platform to invest and raise capital respectively in the Indian Capital Market. These platforms have a large number of listed businesses that seek to grow by raising money from the general population. The NSE and BSE will experience significant growth in the near future due to rising investor participation, economic growth, and the growth of novel financial products.
Frequently Asked Questions (FAQs)
Who regulates the process of IPO in India?
In India, the IPO process is regulated by the Securities and Exchange Board of India.
How many companies are listed on the BSE and NSE?
There are 2,379 companies listed on the NSE as of January 2024 and 5,511 companies listed on the BSE as of October 2024.
What is Nifty 50?
Nifty 50 is a prominent index of the National Stock Exchange, which reflects the performance of the top 50 shares based on market capitalization listed in NSE.
Where is the headquarters of NSE located?
The headquarters of NSE is located in Mumbai.
Who is the owner of NSE?
NSE is owned by banks, insurance companies and different financial entities.
While trading or investing in the stock market, one common term that market participants come across is LTP (Last Traded Price). LTP is the price at which a stock or security was last traded. Unlike opening or closing prices of a day, LTP continuously changes during the trading session. This provides insight for short-term traders.
In this blog, we will discuss what LTP means and its full form, how it is calculated, and how it is used in trading. We will also be discussing how LTP stacks up against other price metrics.
What is LTP?
LTP stands for Last Traded Price. It denotes the price at which the most recent transaction or trade involving a stock was executed. It is dynamic and varies throughout the trading day due to continuous buying and selling activity.
How is LTP Calculated in the Share Market?
LTP is determined directly from the transaction data recorded by the stock exchange. Here is a simplified breakdown.
Whenever a security is bought or sold, the exchange meticulously documents the transaction.
Every transaction record captures the exact price at which the trade was executed, along with a precise timestamp, ensuring comprehensive details for every transaction.
LTP of an asset represents the price at which the most recent transaction involving the asset has been completed. Furthermore, it is updated in real time as new transactions occur. For example, if the last transaction for a particular stock was executed at INR 500 at 3:15 PM, then the LTP at that instant would be INR 500.
LTP vs Other Key Price Metrics
Knowing the differences between LTP and other price metrics can improve your investment decisions and trading styles. Some of the key price metrics are:
Open Price – It marks the price at which the first trade of the day takes place, offering valuable insights into the market’s initial sentiment.
High Price – This represents the highest price achieved during a trading day. It reveals the highest price paid for that security on that day.
Closing Price – It is the weighted average price of the last thirty minutes of the trading day.
Average Price – This represents the mean price of all transactions conducted within a designated time frame. It offers a broader perspective on price fluctuations during the trading session.
Volume – It refers to the total number of shares exchanged during a specific timeframe. The volume shows the interest and activity levels in the security.
Uses of LTP in Stock Trading
LTP can be used in stock trading in the following ways:
Trend Analysis – Traders closely monitor the Last Traded Price (LTP) to discern market trends, helping them determine whether a stock is experiencing an upward or downward trajectory.
Momentum Trading – Traders seize opportunities in stocks that exhibit consistently increasing or decreasing LTPs, signaling a strong momentum.
Support & Resistance –The LTP is instrumental in recognizing important levels from where the price generally reverses, i.e. support and resistance levels.
Intraday trading – For short-term traders, the LTP is an essential tool for making buy or sell decisions based on minute-by-minute fluctuations.
Scalping – It is a dynamic trading strategy that focuses on executing rapid buy and sell transactions to capitalize on minor price movements. Traders frequently rely on LTP as a key indicator in this approach.
The LTP serves as a key element in technical analysis. It offers real-time insights to analysts, which helps them spot trends, patterns, and possible future price changes. Let us have a quick overview of how LTP can be used in technical analysis.
The ability to read charts is a key skill in technical analysis. LTP is illustrated on price charts to provide a visual depiction of a security’s price history.
Analysts use LTP to spot uptrends, downtrends, and sideways trends. LTP data also helps in analyzing historical support or resistance levels for an asset.
Technical indicators like moving averages, RSI, and Stochastic Oscillator use LTP data to generate signals.
LTP, when analyzed alongside volume, empowers traders to gauge whether price fluctuations are backed by substantial trading activity.
Factors Affecting LTP
Various factors affect the LTP of a stock, some of which are listed below:
Economic Indicators
Economic Indicators such as GDP, inflation rates, and employment data play a crucial role in shaping overall market sentiment and consequently influencing the LTP.
Supply & Demand
Supply refers to the total quantity of shares that can be offered for sale in the market. An increase in the number of sellers leads to a higher supply of stock, which can lower the last traded price.
Demand refers to the quantity of shares that can be bought in the market. Increased buyer interest raises demand, which pushes the stock’s last traded price up.
So, LTP represents a point at which supply and demand converge, signifying the price at which the buyer and seller reached an agreement to complete a transaction.
Corporate Announcements
Earnings Reports, whether positive or negative, can lead to substantial price fluctuations. Company events like mergers, acquisitions, product launches, or legal issues can also affect LTP. The performance of the industry in which a company operates also impacts its stock price. Dividend announcements can also attract investors and raise the stock price.
Bid-Ask Spread
The bid-ask spread is the difference between the bid price and the ask price. The bid price is the highest price a buyer will pay, and the ask price is the lowest price a seller will accept. The LTP usually falls within this range and adjusts as trades occur between the bid and ask prices.
A narrow bid-ask spread shows high liquidity and reduced volatility, whereas a wide bid-ask spread shows low liquidity, resulting in greater fluctuations in the LTPs.
Understanding the concept of LTP is essential for anyone engaged in trading or investing in the stock market. It stands for the last traded price of an asset, which is necessary for quick decision-making, especially for day traders and short-term investors. LTP changes with each transaction and is affected by supply and demand, market sentiment, corporate performance, and global events. Including LTP in your trading strategy can keep you updated on market trends, help identify important buying or selling opportunities, and improve trading performance. Remember, LTP is only one aspect of analysis; it is also essential to consider metrics like opening price, closing price, volume, etc. It is advised to consult a financial advisor before investing or trading.
Frequently Asked Questions
Is LTP the same as the closing price?
No, LTP reflects the price at which the most recent transaction was completed, while the closing price is the weighted average price of transactions during the final moments of the trading day.
How often does LTP change?
LTP changes every time a new transaction happens, making it a real-time indicator of stock price movements.
Is LTP useful for long-term investors?
While it is more useful for short-term traders, long-term investors might use it alongside other metrics to identify major support and resistance levels.
Why does LTP fluctuate during market hours?
LTP fluctuates because of ongoing trading activity, influenced by market dynamics and investor sentiment.
Can LTP be manipulated?
In highly liquid markets, it is difficult to manipulate LTP. However, in low-volume stocks, large block deals can cause large price swings.
Muhurat Trading is a traditional affair in the Indian stock market, transcending the significance of ordinary financial transactions. It is an intertwining of ancient Hindu traditions and the importance of investments in modern times. Riding on the glorious wave of Diwali celebrations, this trading session is popular among many investors across India.
In this blog, we will discuss its history, importance and cultural aspects while shedding light on why it is such a cherished tradition. Further, we will learn about the practical aspects of Muhurat Trading, such as how to participate in a Muhurat Trading session and its benefits.
What is Muhurat Trading?
A special trading session conducted on the occasion of Diwali is called the Muhurat Trading Session. The transactions done by a market participant during this session is known as Muhurat Trading. The term “Muhurat” refers to an auspicious or favorable time for performing a certain task, and the Muhurat Trading session is considered a symbolic and auspicious way to commence the Samvat, the traditional Hindu accounting year. Muhurat Trading is believed to be among those moments that bring luck and prosperity for the entire year due to which many market participants invest and trade during this session.
Muhurat Trading is conducted at a specific time in the evening on Diwali. The Indian stock exchanges decide a specific time window each year, and the trading generally lasts for one hour. Both the equity and the derivatives segments will be open to trade during the Muhurat Trading session. Market participants can trade or invest in stocks as well as trade in other derivative instruments during this session.
History of Muhurat Trading
Diwali marks the beginning of the new Hindu business year, known as Samvat, which is an auspicious occasion to begin new ventures for the business community. In the past, business managers would turn a new page in their books of account and worship Goddess Lakshmi to bless them with prosperity in the upcoming year. It can be seen as a new beginning based on the belief that starting the accounting year with fate in favor would bring prosperity.
Muhurat Trading has a long history, which is an important part of Indian culture and financial markets. It started in the Bombay Stock Exchange (BSE) in 1957. The National Stock Exchange (NSE) followed suit in 1992 by further popularizing it. Today, the trend of participation in Muhurat Trading is widely followed by investors in India.
Though the process and other details may have changed over time, the central idea remains intact, i.e., it invites prosperity, good fortune, and wealth for the future. Many participants complete their first transaction of the year or invest some form of ‘token’ amount to mark the celebrations.
Muhurat Trading Session Timings for 2025
The BSE and NSE have officially declared the date of Muhurat Trading as 21st November. The timings of the Muhurat Trading session will take place from 1:45 pm to 2:45 pm in the Afternoon. Other details of the trading session are mentioned below:
Session
Start Time
End Time
Block Deal Session
1:15 pm
1:30 pm
Pre-Open Session
1:30 pm
1:45 pm
Muhurat Trading Session
1:45 pm
2:45 pm
Closing Session
2:55 pm
3:05 pm
What Happens in Muhurat Trading?
Muhurat Trading is an approximately one-hour-long trading session that shall be conducted on Diwali to mark the beginning of the Hindu New Year. Below is the breakdown of key components of this event:
Timings: Trading session timings are decided each year based on the conditions deemed fortunate according to Hindu astrology. The exact time changes every year depending on the festival of Diwali.
Market Participants: Investors and traders of all types, from retail investors to institutional players, participate in this event and usually buy shares in the hope of making a good fortune.
Past Market Trends: During Muhurat Trading, the atmosphere is vibrant and filled with optimism. The stock market generally displays bullish trends, fuelled by high trading volumes and positive sentiment. Many consider this moment as an excellent opportunity to invest in stocks for the long term, particularly because of its cultural significance. However, due to the short trading window, markets can also be volatile.
Financial Instruments: Muhurat Trading involves various financial instruments, including stocks, futures, options, commodities and mutual funds. Both delivery and intraday trading are allowed.
Brokerage:Brokerage platforms often waive fees during the Muhurat Trading session to boost participation, making it a great opportunity for traders. However, this varies depending on the broker.
Steps to Participate in Muhurat Trading on Pocketful
Anyone wishing to participate in the Muhurat Trading session can do so in the following way:
Open a Trading Account with Pocketful if you do not have one.
Transfer funds to your trading account before the Muhurat session to avoid last-minute delays in placing orders.
Since the trading session is short, pre-plan your trades and shortlist the stocks that you want to buy.
Log in to the Pocketful web platform or mobile application before the session begins.
Keep an eye on the market trends and price movements because the market volatility can be high, and it is important to stay alert.
Note: Remember, Pocketful offers unlimited orders with 0 brokerage charges across all segments on the occasion of Muhurat Trading.
Benefits of Muhurat Trading
Muhurat Trading provides unique benefits, making it a special event in the stock market calendar. Here are some of the key benefits:
Cultural Significance: Many investors view this occasion as a chance to start their financial year on a positive note, seeking good luck and success in their investments. It increases investor confidence and offers psychological reassurance, particularly for long-term wealth creation.
History of Bullish Trends: Muhurat Trading usually features an optimistic market sentiment. The vibrant festive atmosphere and its cultural importance often inspire a bullish sentiment among investors, driving markets upwards.
Enhanced Market Liquidity: An increase in investor participation during the Muhurat session generally results in enhanced market liquidity. This enhances the opportunities for buying and selling stocks with minimal price fluctuations, facilitating smoother transactions.
The Muhurat Trading session in 2025 will offer an exciting chance to engage in an event based on a unique fusion of tradition and finance. Although this will be a favorable time for making investments, it is crucial to proceed with a well-defined strategy and prudent financial judgment. Muhurat Trading presents an exciting opportunity for everyone, whether you are a seasoned trader looking to realize swift gains or a long-term investor seeking to attract long-term prosperity to your portfolio. You must stay vigilant of market fluctuations, make well-informed choices, and embrace a prosperous new financial year.
Frequently Asked Questions (FAQs)
Can new investors participate in the Muhurat Trading session?
Anyone with a registered trading account and a demat account can participate in the Muhurat Trading session.
Do I have to pay brokerage for the transactions done during the Muhurat Trading session?
Some brokers, such as Pocketful, offer zero brokerage for all orders placed across all segments during this session.
Is Intraday trading allowed in Muhurat trading?
Intraday trading is allowed, though traders need to act quickly within the short one-hour window.
Are there any specific rituals linked with Muhurat Trading?
Before the Muhurat Trading session, many market participants perform Lakshmi Puja, i.e., worship of Goddess Lakshmi and Chopda Pujan, which involves businessmen placing their account books in front of idols to attract prosperity.
Can I trade in any stock during Muhurat Trading?
Yes, you can trade in any stock during Muhurat Trading, just like on a regular trading day.
The Tweezer Bottom is one of the best-known candlestick reversal patterns applied in technical analysis, suggesting a possible reversal from a downtrend. Typically, it marks the end of a bearish trend, signaling a shift in market mood – from a downtrend to an uptrend. This makes it an integral part of the trading strategy for traders who use price action and chart patterns to predict market movements.
This blog will discuss the Tweezer Bottom candlestick pattern, its main features, and its practical use in trading strategies. Understanding this pattern is essential to make better trading decisions.
Tweezer Bottom Pattern – An Overview
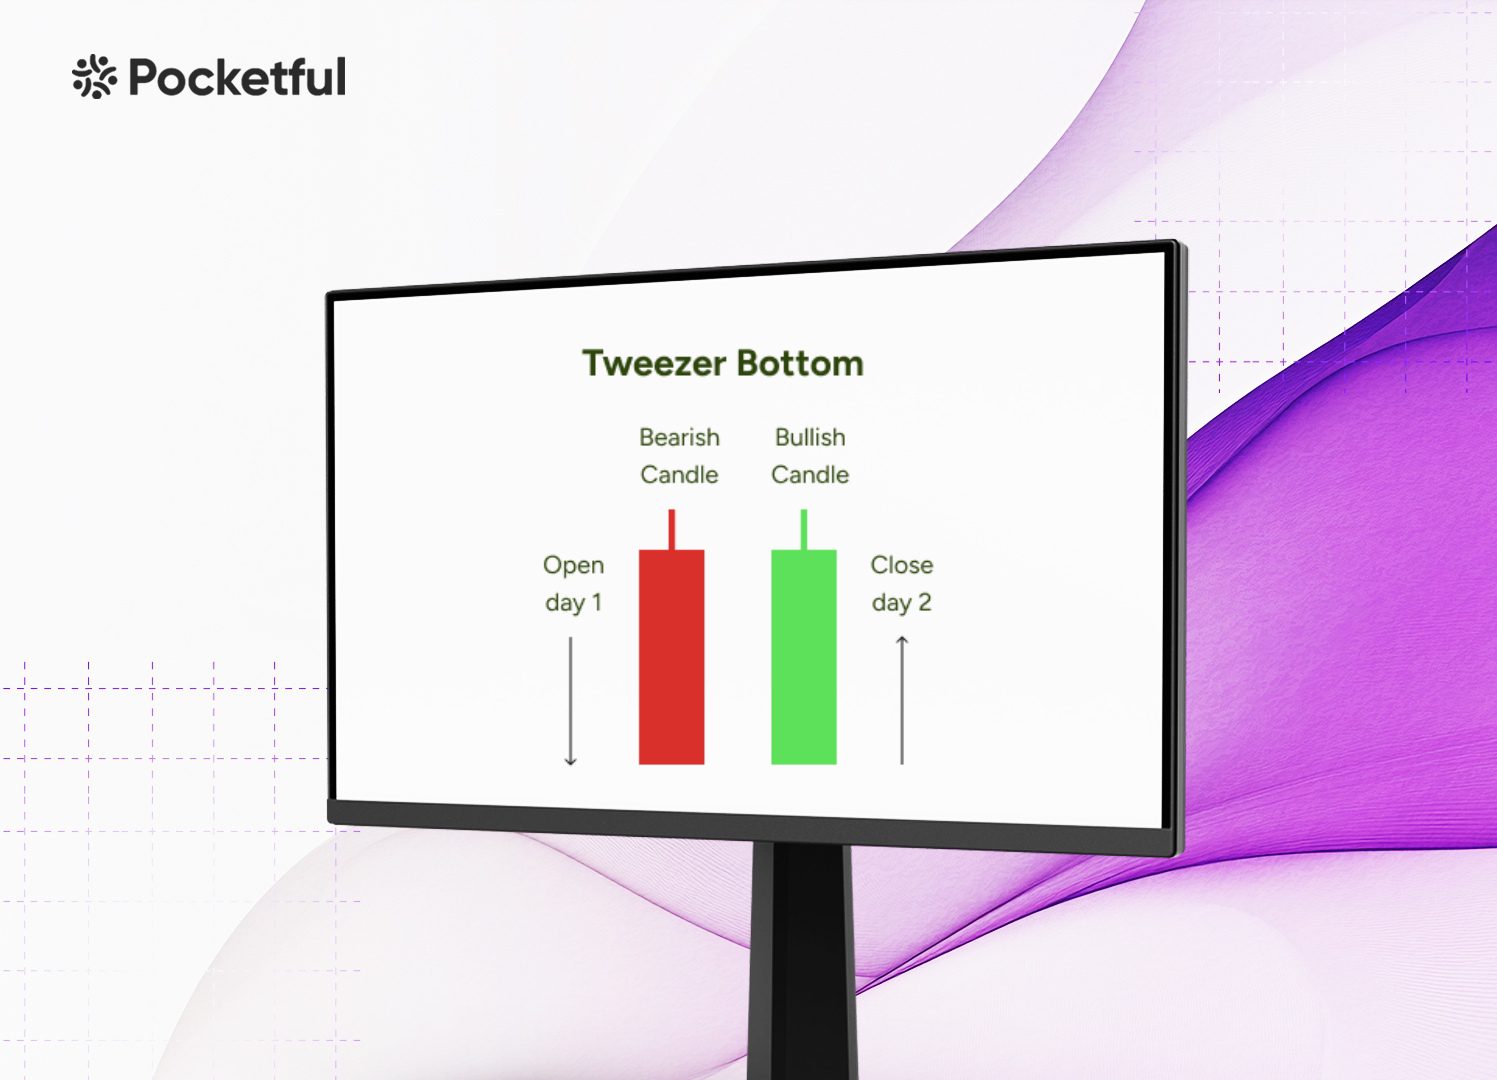
A Tweezer Bottom is a bullish reversal candlestick pattern that usually occurs at the end of a downtrend. It consists of two candlesticks, explained below:
First Candle: The first candle is bearish, showing the sellers are in control of the market direction, which is evident by the already established downtrend.
Second Candle: The second candle is bullish, indicating a shift in market sentiment from bearish to bullish.
The interesting feature of this pattern is that both the candles have approximately equal lows. This pattern indicates a possible bullish reversal, showing that buyers have surpassed selling pressure to drive prices up. A surge in trading volume while the second candle is being formed further enhances the credibility of the pattern.
Interpretation
Interpretation of the pattern is important to increase the chances of success in financial markets. Traders should confirm that the asset price shows a clear downtrend before the pattern forms. Also, the pattern is ineffective in consolidation or a range-bound market and works best in trending markets.
Identify the two candlesticks that share similar or identical low prices. The second bullish candlestick should close strongly, i.e. near its high. Moreover, a strong rejection of the lower prices by the second candle indicates a strong possibility of a reversal.
Traders should look for confirmation from other technical indicators and an increase in volumes. Once the pattern is validated, traders commonly initiate a long position once the asset price gives a breakout above the peak of the second candlestick.
A trader can determine the target in the following ways:
Resistance Levels: A highly effective approach to determining a target is to identify a key resistance level on the chart, which the asset price has struggled to cross in the past. After the breakout above the high of the second bullish candle, the price will likely advance toward the next level of resistance.
Risk-Reward Ratio: It is important to establish a target that offers a good risk-reward ratio. A common risk-reward ratio is 1:2, meaning that for every INR 1 of risk, you are aiming for a profit of INR 2. This strategy assures profitability in the long run.
A stop-loss is important to protect against false breakouts and avoid huge losses. A stop-loss can be determined in the following ways:
Low of the Pattern: Since both the candles have similar lows, a stop-loss is usually set just below the low of the two candles to exit the trade if the asset price moves below this support level.
Support Levels: If you have a high-risk tolerance and don’t want your stop-loss order triggered due to small price fluctuations, consider placing a stop-loss below the next support level.
Effectively managing your stop-loss and target levels can help you minimize losses and maximize gains when trading the Tweezer Bottom pattern.
Example of Tweezer Bottom Pattern
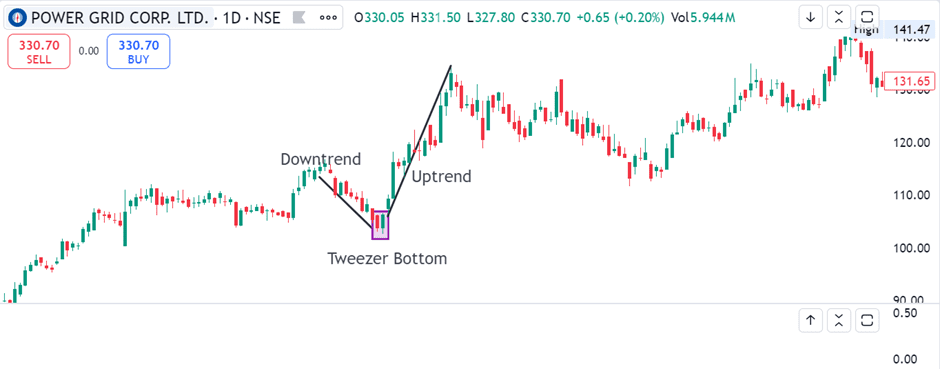
The above image shows the daily chart of Power Grid Corporation. A clear formation of the Tweezer Bottom candlestick pattern can be seen after a downtrend with almost similar low prices which is followed by an uptrend. The stock price was INR 106 on 1 February 2024 when the pattern was formed. The stock made a high of INR 133 on 18 February 2024.
Advantages of the Tweezer Bottom Pattern
Tweezer Bottom pattern acts as a powerful visual indicator of trend reversal in a downtrend. The advantages of a Tweezer Bottom pattern are:
Easy to Recognize: The pattern is easy to recognize due to its simple structure, due to which even new traders can use it.
Effective across Multiple Timeframes: This pattern can be used across various timeframes, effectively predicting bullish reversals in both short-term and long-term charts. This versatility enables traders with different trading styles to use this pattern easily.
Strong Reversal Signal: Once validated by other technical indicators or price movement, the Tweezer Bottom pattern can effectively determine bullish reversals near the low of a downtrend.
Limitations of the Tweezer Bottom Pattern
While the Tweezer Bottom Pattern offers remarkable benefits, it is important to understand that it does not assure a reversal. Some of its limitations are:
Dependent on other Technical Tools: The pattern depends on other technical tools for confirmation. It is recommended to use the Tweezer Bottom pattern with other technical indicators or price action signals for better reliability.
Ineffective in Volatile Markets: The effectiveness of the pattern can be significantly impacted by the prevailing market conditions. In highly volatile markets, the pattern’s signal of bullish reversal may be less reliable.
The Tweezer Bottom candlestick pattern helps traders spot potential reversals in a downtrend. Although it is easy to identify and use this pattern, its effectiveness significantly improves when combined with other technical analysis tools. Traders can enhance their accuracy in the market by recognizing this pattern, validating it with other indicators, and using effective risk management techniques. Practice and experience are essential for mastering the Tweezer Bottom pattern. However, it is essential to consult a financial advisor before trading.
Frequently Asked Questions (FAQs)
What does the Tweezer Bottom pattern indicate?
It suggests the weakening of the selling pressure, and buyers may be taking control, signaling a possible reversal in price direction.
Is volume important in interpreting a Tweezer Bottom pattern?
Yes, higher volume during the formation of the second bullish candle can confirm the strength of the bullish reversal.
Can a Tweezer Bottom appear in any timeframe?
Yes, the Tweezer Bottom pattern can be found across various timeframes, from minute charts to daily or weekly charts, but it is most reliable in higher time frames.
Is this pattern useful in a sideways market?
The Tweezer Bottom pattern is ineffective in the sideways market, as there are higher chances of false breakouts.
What is the difference between a Tweezer Bottom and a Tweezer Top?
A Tweezer bottom signals a reversal from a downtrend to an uptrend, while a Tweezer Top signals a reversal from an uptrend to a downtrend.
Technical analysis provides an extensive array of tools for forecasting price movements, and candlestick patterns are some of the most widely used. One such intriguing pattern that traders often look for is the Three Outside Up candlestick pattern, which significantly helps in identifying possible bullish reversals across various financial markets. This particular pattern helps traders gauge the market sentiment and provides pivotal insights into possible upward price movements. Understanding and using the Three Outside Up pattern can be a game changer for those capitalizing on market trends.
This blog will detail the Three Outside Up pattern and explore its structure, psychology, interpretation, and how to use it in a trading strategy.
What is the Three Outside Up Pattern?
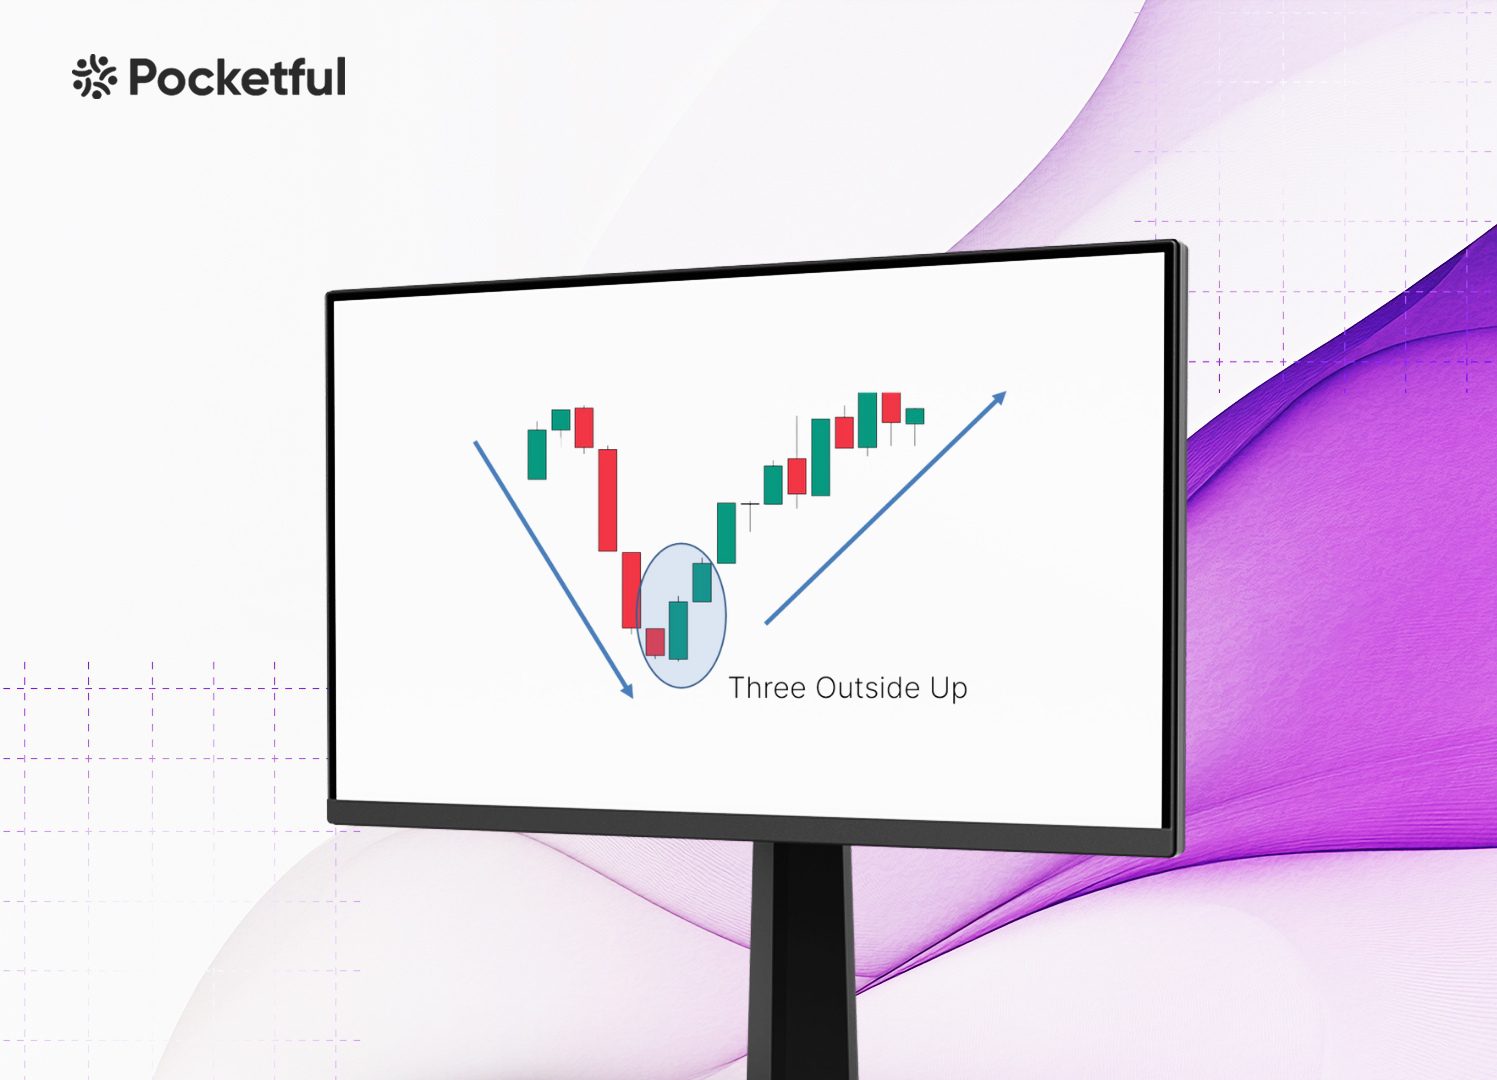
The Three Outside Up candlestick pattern is a bullish reversal pattern consisting of three consecutive candles that usually indicate a shift from a downtrend to an uptrend.
First Candle – A long, red, bearish candle.
Second Candle – The second candle must completely engulf the first candle, which means the second candle’s body completely covers the first candle’s body. This engulfing pattern shows strong buying momentum.
Third Candle – This is usually a long green candle that closes above the high of the first candle.
The pattern usually occurs at the end of a downtrend, suggesting that selling pressure is decreasing and a bullish reversal may be on the way.
Interpretation of the Three Outside Up Chart Pattern
The understanding of this pattern can be broken down into three parts.
Downtrend: The initial long red candle signifies that the prevailing downtrend is likely to continue, and sellers are driving prices down.
Decreasing selling pressure: The big bullish engulfing candle shows that selling pressure is easing and buyers are increasingly taking action, yet they have not yet managed to reverse the current downtrend.
Bullish Breakout: The appearance of another green candle that closes above the high of the previous candle shows a strong bullish sentiment, suggesting that buyers have effectively surpassed the selling pressure and are pushing the price upward.
How to Determine Target & Stop-Loss?
Determining a target is crucial to lock in profits before the markets move against you. An individual can determine the target levels using the following ways:
Resistance Levels: A common way to set a profit target is to identify previous resistance levels where the price had difficulty breaking through. These levels represent areas where sellers may intervene, leading to price consolidation or reversal.
Risk-Reward Ratio: Another effective method to set targets can be the risk-reward ratio. Frequently employed ratios are 1:2 or 1:3, which can significantly enhance your trading process. This method ensures that even if a small percentage of your trades succeed, the profits from winning trades will exceed the losses.
For any trading strategy, setting a stop-loss is important to limit losses in case of a false breakout. Some common ways to set a stop-loss for the Three Outside Up pattern are:
Low of the First Bearish Candle: A simple and effective strategy is to set the stop-loss just below the low of the first bearish candle in the Three Outside Up pattern. If the first candle’s low is broken, it invalidates the bullish reversal signal. If the price drops below the first candle’s low, it indicates that sellers are in control, suggesting the bullish reversal has likely failed.
Support Levels: Furthermore, support levels, marked by previous lows, can act as effective stop-loss points. Placing a stop-loss just under a key support level confirms a failed bullish reversal if the price falls below it.
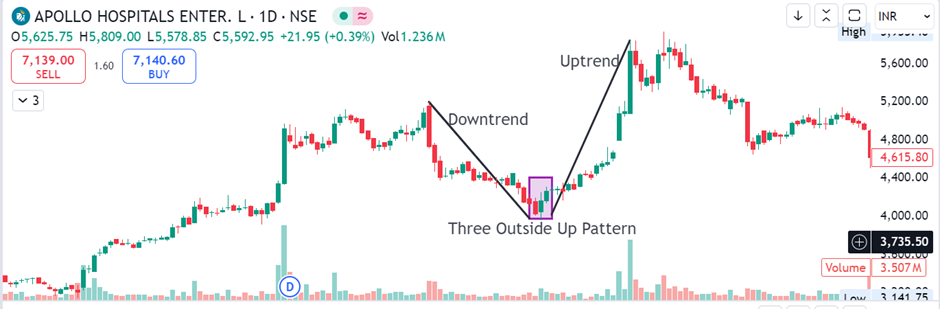
The example above illustrates the Three Outside Up pattern on the daily chart of Apollo Hospitals, which emerges after a decent downtrend. The long red candle signifies a sustained wave of selling pressure. However, the next green candle, which almost engulfs the first red candle, shows diminishing selling pressure and the subsequent long green candle closing above the first candle’s high shows a bullish breakout. We can see that the stock price increased from INR 4,276 to INR 5,733 between 27 October 2021 and 17 November 2021.
Advantages of the Three Outside Up Pattern
The advantages of using a Three Outside Up pattern are:
Strong Reversal Signal: The Three Outside Up pattern gives a strong signal for a bullish reversal, showing a potential shift from a downtrend to the onset of an uptrend. It gives traders clear visual signals of a market shift from bearish to bullish, helping them identify and trade bullish reversal opportunities.
Inherent Confirmation: A key benefit of this pattern is the inherent confirmation offered by the third bullish candle. The third bullish candle in the Three Outside Up pattern confirms that the reversal is genuine, unlike other candlestick patterns that may not provide clear confirmation.
Simple Formation: The pattern is easy to observe on price charts, making it accessible for beginner traders. The three-candle structure allows traders to quickly spot the pattern and take action.
Limitations of the Three Outside Up Pattern
The limitations of using a Three Outside Up pattern are:
False Signals: The pattern occasionally gives false signals, particularly in low liquidity or high volatility markets. Traders relying only on a single pattern may suffer losses if the market moves in the opposite direction.
Late Entry Point: The Three Outside Up pattern is characterized by a three-candle formation, indicating that it only becomes apparent after the third candle is closed. At this point, a considerable portion of the reversal movement may have already occurred, especially in dynamic markets. Traders seeking early entries may find that the pattern validates the trend too late, eventually diminishing the possible profit margins.
Misinterpretation: This candlestick pattern can be interpreted in different ways. Variations in candle size, shape, and the positioning of the subsequent candles can lead to different interpretations among traders. Traders may perceive patterns differently based on their analysis methods.
Common Mistakes When Trading the Three Outside Up Pattern
Although the Three Outside Up pattern is a valuable trading tool, traders often make errors that can diminish its effectiveness. Here are some common pitfalls to avoid when trading the Three Outside Up pattern.
Ignoring the Trend – The Three Outside Up pattern works best if it appears after a downtrend. In a sideways or bullish market, the pattern may not indicate a genuine reversal. Always consider the broader market context before making a trading decision.
Overlooking Volume – Volume plays an important role in validating candlestick patterns. A Three Outside Up pattern accompanied by low volumes may suggest weak market conviction, decreasing the chances of a bullish reversal. Ensure that the second and third candles form with increasing volumes to confirm the pattern’s validity.
Not using other Indicators – Exclusively depending on the Three Outside Up pattern without incorporating other technical indicators can be risky. Always use other indicators like RSI, MACD, or moving averages alongside the pattern for better trading decisions.
The Three Outside Up candlestick pattern is a simple method for recognizing possible bullish reversals. Its clear structure and confirmation make it popular among traders seeking bullish reversal signals in declining markets. Nonetheless, similar to all technical patterns, it is not foolproof. Integrating the pattern with effective risk management techniques and other technical tools can boost the probability of executing successful trades.
Frequently Asked Questions (FAQs)
How reliable is the Three Outside Up candlestick pattern?
It is considered more reliable than other reversal patterns because of inherent confirmation from the third candle. However, it should be used in combination with other indicators for better accuracy.
Can this pattern be used in any market?
Yes, this pattern works across different markets, including stocks, forex, commodities etc.
Can the Three Outside Up pattern fail?
The Three Outside Up pattern can fail, especially in strong downtrends or sideways markets, where the market conditions overpower the bullish reversal signal of the pattern.
What is the difference between Three Outside Up and Bullish Engulfing Pattern?
The Three Outside up pattern has a third bullish candle, which confirms the bullish reversal, making it more reliable than the two-candle Bullish Engulfing pattern, which lacks confirmation.
How do I know if the reversal signal is strong?
The size of the engulfing candle and the third candle’s strength, along with high trading volume, can show the strength of the reversal signal.
Candlestick patterns are important visual indicators that provide traders with a clear picture of market sentiment, helping them predict a future trend. Interestingly, among all the candlestick patterns, one of the best candlestick patterns is the white spinning top pattern— a sign that indicates market indecision and acts as a possible trend reversal, which makes it useful in both bearish and bullish markets.
In this blog, we will discuss the White Spinning Top candlestick pattern, its interpretation, advantages and limitations. Moreover, we will provide an example to better understand the trading setup.
What is the White Spinning Top Pattern?
The White Spinning Top is a single candlestick pattern often used in technical analysis for trading. It shows market indecision and often indicates a possible reversal or continuation, depending on the context of the previous trend. The characteristics of the pattern are:
Small Body: The body of the candle is quite small, suggesting that the closing prices were slightly higher than the opening price.
Long Wicks/Shadows: The long upper and lower shadows show substantial price movement throughout the session, yet neither the bulls nor the bears managed to seize complete control.
White/Green color: This pattern includes a white (or green) candlestick, showing a bullish trend.
Interpretation
The interpretation of the White Spinning Top candlestick pattern is largely determined by the previous trend and the broader market context in which it emerges. Let’s understand the White Spinning Top pattern in a downtrend and an uptrend:
1. In a Downtrend: Indicates a Possible Bullish Reversal
A White Spinning Top pattern emerging after a prolonged downtrend often shows a possible weakening of selling pressure. This suggests that while bears have maintained dominance, the appearance of the spinning top pattern shows a slowdown in bearish momentum, showing that buyers are beginning to enter the market. It is often interpreted as a possible trend reversal from bearish to bullish.
2. In an Uptrend: Indicates a Possible Pause or a Bearish Reversal
In a well-established uptrend, the emergence of a White Spinning Top signifies market indecision. This shows that while bulls have dominated, their strength might be fading, and the market lacks clear direction. Traders should be careful, as this may lead to a short consolidation before the uptrend continues. As the pattern suggests indecision, it can also signal a bearish reversal.
Furthermore, the White Spinning Top pattern is not very useful for predicting future trends in a sideways or range-bound market. The situation likely highlights the persistent uncertainty in the market, as buyers and sellers appear to be evenly balanced.
How to Determine Target and Stop-Loss?
Setting a target depends on your profit goals based on market conditions. Some of the methods for determining target levels are listed below:
Support or Resistance Levels: If the pattern appears after an uptrend, identify the closest support level below the White Spinning Top candlestick to determine the target. In case of a downtrend, identify the nearest resistance level above the White Spinning Top pattern to set your target.
Risk-Reward Ratio: This method ensures that even if a small percentage of your trades are profitable, the profits from winning trades will exceed the losses. Traders often use risk-reward ratios of 1:2 or 1:3.
A stop-loss is crucial to safeguard against huge losses if a trade goes bad. An individual can place a stop-loss based on the following information:
Low of the White Spinning Top Candle: If a bullish reversal is expected after a downtrend, then ensure that your stop-loss is placed beneath the low of the White Spinning Top candlestick.
High of the White Spinning Top Candle: In a bearish reversal scenario (after an uptrend), position your stop-loss above the high of the White Spinning Top candlestick. By doing so, you can minimize your risk and ensure that you are holding onto trades that align with the prevailing market sentiment.
Example of White Spinning Top Pattern of Shipping Corp of India ltd.
The above image shows the formation of a White Spinning Top pattern on the daily timeframe of the Shipping Corporation of India. The stock was in an uptrend, and then it made a White Spinning Top Pattern on 5 February 2024. As the previous trend was bullish, the occurrence of the pattern suggests market indecision and a potential pause in bullish momentum or a bearish reversal. The stock closed at INR 264, i.e., below the low of the White Spinning Top candlestick on 6 February 2024. The bearish candle after the pattern confirmed the bearish reversal, and the stock made a low of INR 210 on 12 February 2024.
The advantages of the White Spinning Top pattern are:
Reversal Signal: The White Spinning Top indicates a possible shift in the prevailing trend, whether transitioning from bullish to bearish or vice versa.
Useful in Multiple Time Frames: This pattern is versatile and can be used across multiple timeframes, be it daily, weekly, or even long-term charts. It allows traders to easily spot trading opportunities across various time frames.
Can be used with Other Indicators: The White Spinning Top pattern works best alongside other technical indicators, such as RSI, MACD, or moving averages. Pattern signals are quite reliable, especially when used with support/resistance levels or other indicators.
Limitations of White Spinning Top Pattern
The limitations of the White Spinning Top pattern are:
Indecision: The pattern is indecisive in nature as it doesn’t indicate a clear direction, making it difficult to make quick decisions, and traders may miss trading opportunities while they wait for confirmation.
False Signals in Short Time Frames: Short-term traders using 5- or 15-minute time frames may see White Spinning Tops often due to market noise. Unfortunately, these patterns often give more false signals than trading opportunities.
Dependence on Market Context: The White Spinning Top pattern has limited use without considering overall market trends or conditions. For example, it may occur during periods of sideways consolidation, reducing its significance for traders seeking trend reversals or breakout signals.
The White Spinning Top candlestick pattern is a simple yet useful pattern in technical analysis, providing traders with valuable insights into market indecision and the likelihood of trend reversals or continuations. Understanding this pattern can enhance a trader’s ability to anticipate market movements, allowing for more informed decision-making. By monitoring the context in which the White Spinning Top appears, traders can better position themselves for potential opportunities. Even though the pattern lacks clear buy or sell signals, it is beneficial when combined with other technical indicators and patterns.
Frequently Asked Questions (FAQs)
Example of White Spinning Top Pattern of Shipping Corp of India ltd.
It is neutral but can indicate a possible bullish reversal in a downtrend or a bearish reversal in an uptrend.
Can the White Spinning Top pattern be used in any market?
The White Spinning Top pattern can be used in stocks, forex, commodities, and other markets across different timeframes.
What is the difference between a White Spinning Top and a Doji?
A Doji has little to no body, indicating that the open and close prices of the trading session were approximately equal, while a White Spinning Top has a small body showing slight price movement.
How do I confirm the signal validity of a White Spinning Top pattern?
Individuals should wait for confirmation in the form of the next candlestick, which helps identify a clear directional move, either bullish or bearish.
Is the White Spinning Top pattern useful in very short time frames?
Unfortunately, price movements in a very short timeframe are affected by noise, due to which the pattern may generate false signals.
Open Free Demat Account
Join Pocketful Now
You have successfully subscribed to the newsletter
There was an error while trying to send your request. Please try again.