Candlestick patterns are important visual indicators that provide traders with a clear picture of market sentiment, helping them predict a future trend. Interestingly, among all the candlestick patterns, one of the best candlestick patterns is the white spinning top pattern— a sign that indicates market indecision and acts as a possible trend reversal, which makes it useful in both bearish and bullish markets.
In this blog, we will discuss the White Spinning Top candlestick pattern, its interpretation, advantages and limitations. Moreover, we will provide an example to better understand the trading setup.
What is the White Spinning Top Pattern?
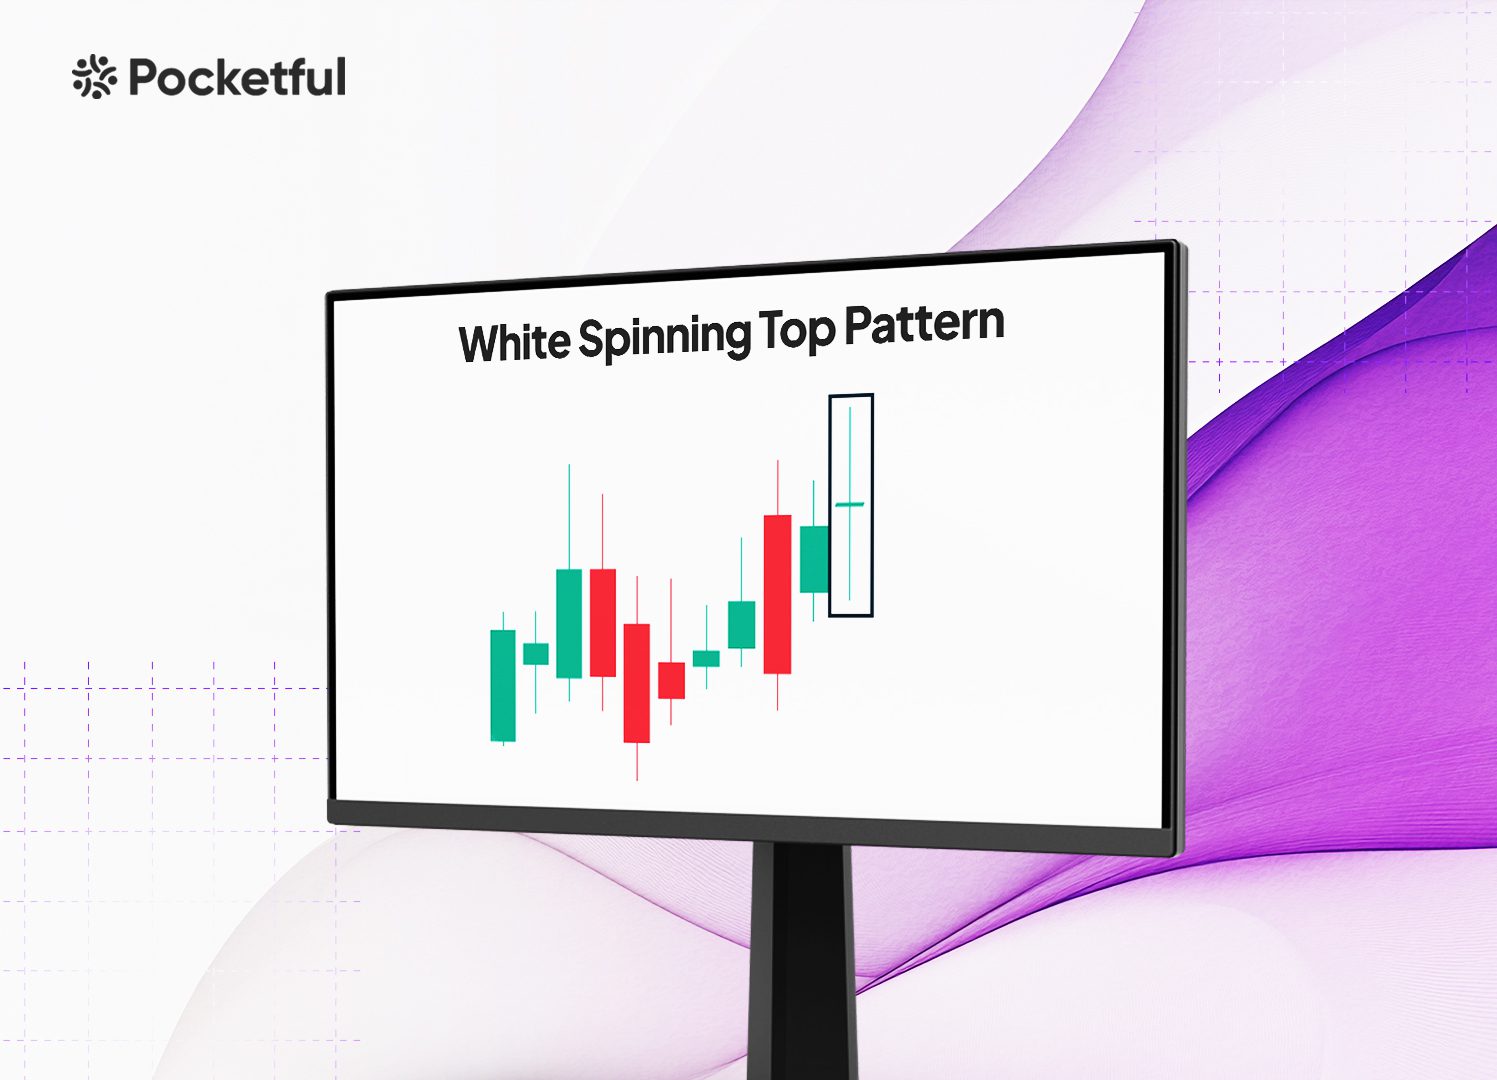
The White Spinning Top is a single candlestick pattern often used in technical analysis for trading. It shows market indecision and often indicates a possible reversal or continuation, depending on the context of the previous trend. The characteristics of the pattern are:
- Small Body: The body of the candle is quite small, suggesting that the closing prices were slightly higher than the opening price.
- Long Wicks/Shadows: The long upper and lower shadows show substantial price movement throughout the session, yet neither the bulls nor the bears managed to seize complete control.
- White/Green color: This pattern includes a white (or green) candlestick, showing a bullish trend.
Interpretation
The interpretation of the White Spinning Top candlestick pattern is largely determined by the previous trend and the broader market context in which it emerges. Let’s understand the White Spinning Top pattern in a downtrend and an uptrend:
1. In a Downtrend: Indicates a Possible Bullish Reversal
A White Spinning Top pattern emerging after a prolonged downtrend often shows a possible weakening of selling pressure. This suggests that while bears have maintained dominance, the appearance of the spinning top pattern shows a slowdown in bearish momentum, showing that buyers are beginning to enter the market. It is often interpreted as a possible trend reversal from bearish to bullish.
2. In an Uptrend: Indicates a Possible Pause or a Bearish Reversal
In a well-established uptrend, the emergence of a White Spinning Top signifies market indecision. This shows that while bulls have dominated, their strength might be fading, and the market lacks clear direction. Traders should be careful, as this may lead to a short consolidation before the uptrend continues. As the pattern suggests indecision, it can also signal a bearish reversal.
Furthermore, the White Spinning Top pattern is not very useful for predicting future trends in a sideways or range-bound market. The situation likely highlights the persistent uncertainty in the market, as buyers and sellers appear to be evenly balanced.
How to Determine Target and Stop-Loss?
Setting a target depends on your profit goals based on market conditions. Some of the methods for determining target levels are listed below:
- Support or Resistance Levels: If the pattern appears after an uptrend, identify the closest support level below the White Spinning Top candlestick to determine the target. In case of a downtrend, identify the nearest resistance level above the White Spinning Top pattern to set your target.
- Risk-Reward Ratio: This method ensures that even if a small percentage of your trades are profitable, the profits from winning trades will exceed the losses. Traders often use risk-reward ratios of 1:2 or 1:3.
A stop-loss is crucial to safeguard against huge losses if a trade goes bad. An individual can place a stop-loss based on the following information:
- Low of the White Spinning Top Candle: If a bullish reversal is expected after a downtrend, then ensure that your stop-loss is placed beneath the low of the White Spinning Top candlestick.
- High of the White Spinning Top Candle: In a bearish reversal scenario (after an uptrend), position your stop-loss above the high of the White Spinning Top candlestick. By doing so, you can minimize your risk and ensure that you are holding onto trades that align with the prevailing market sentiment.
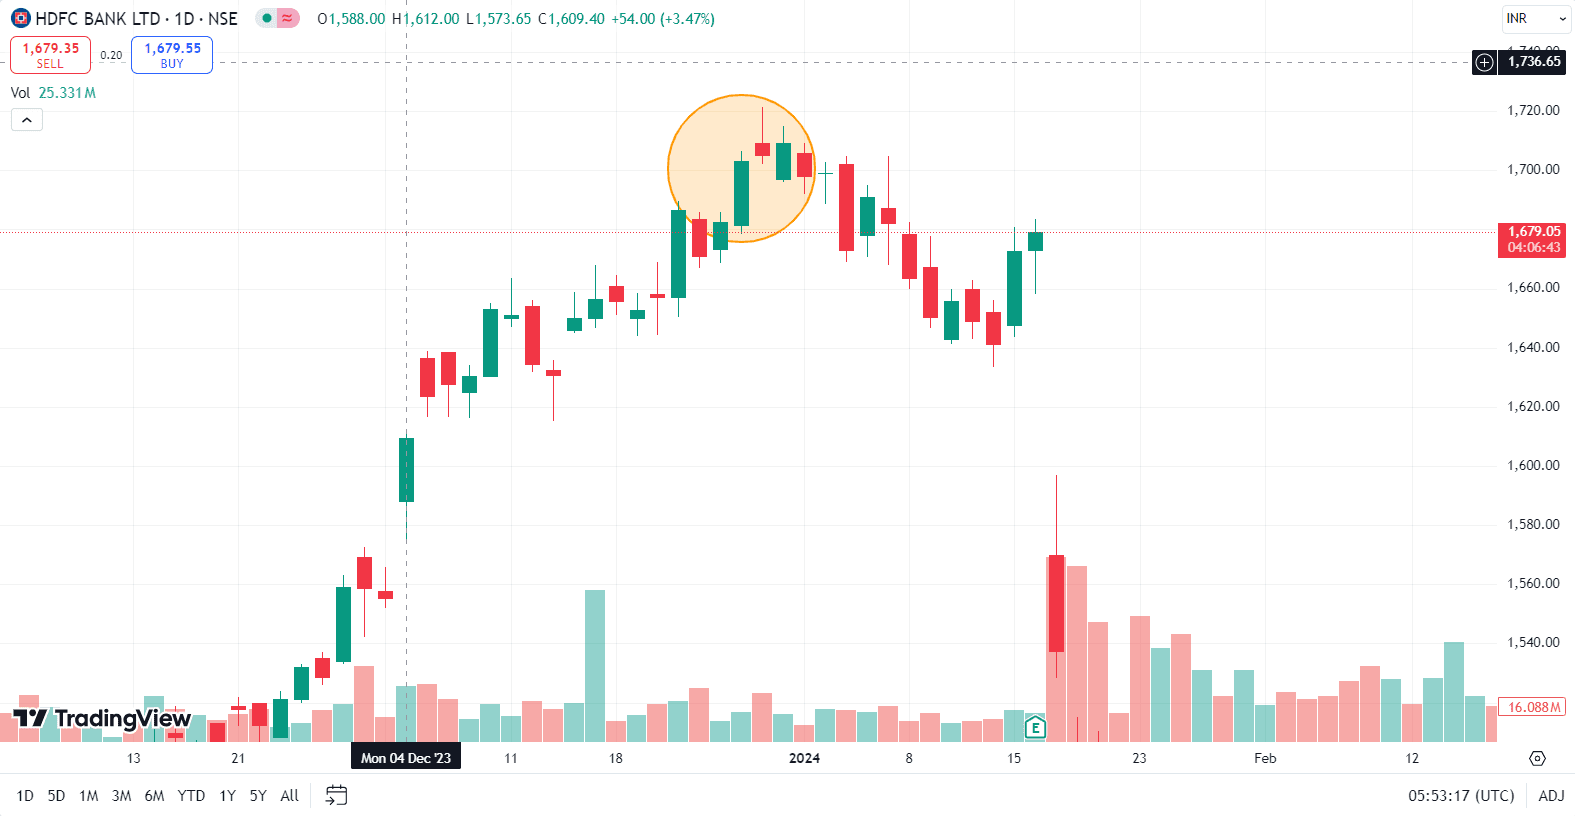
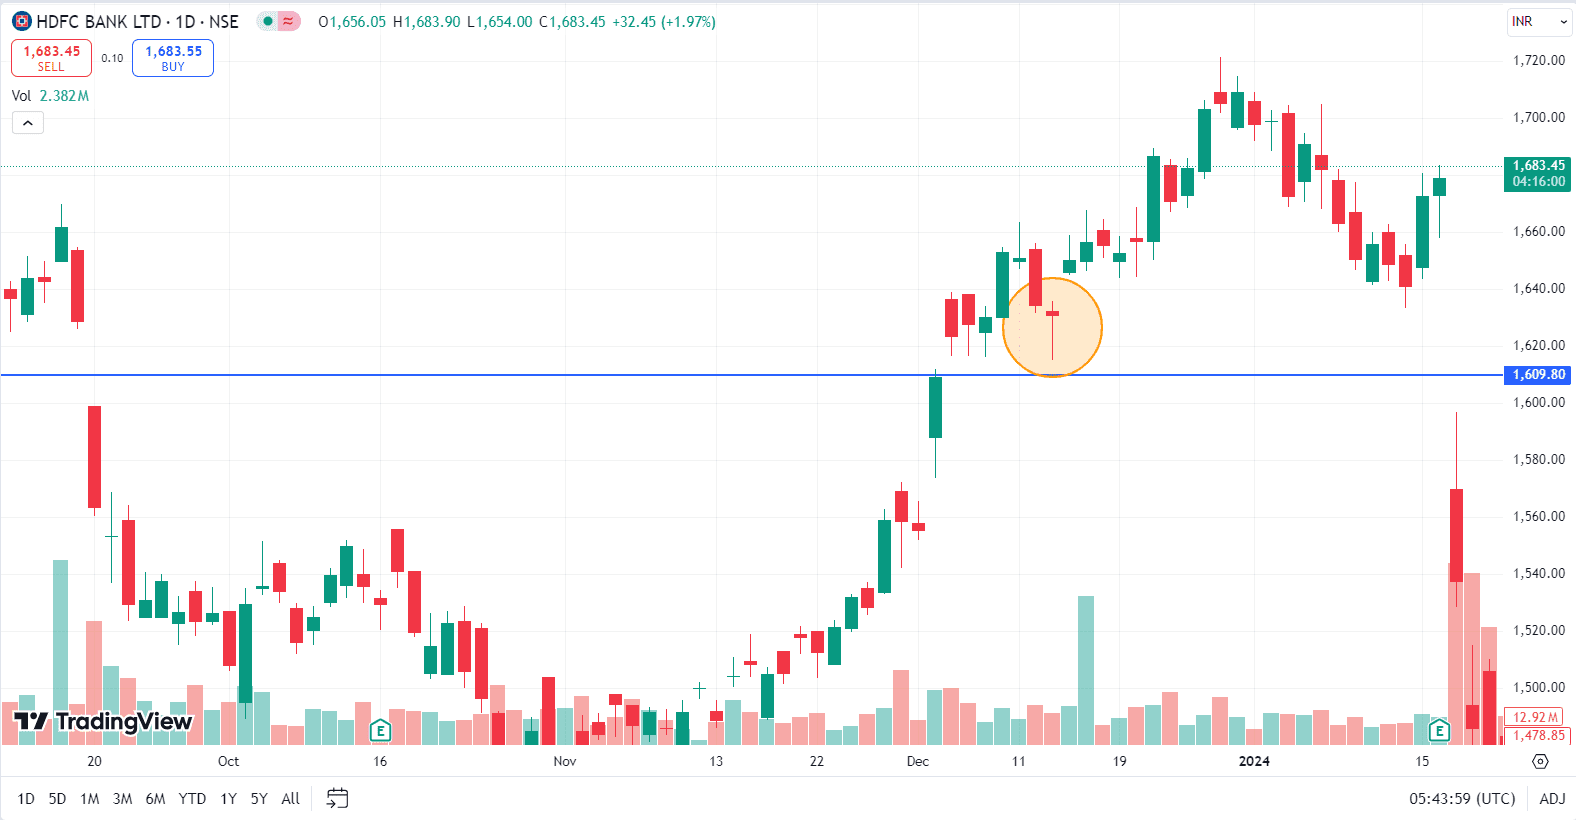
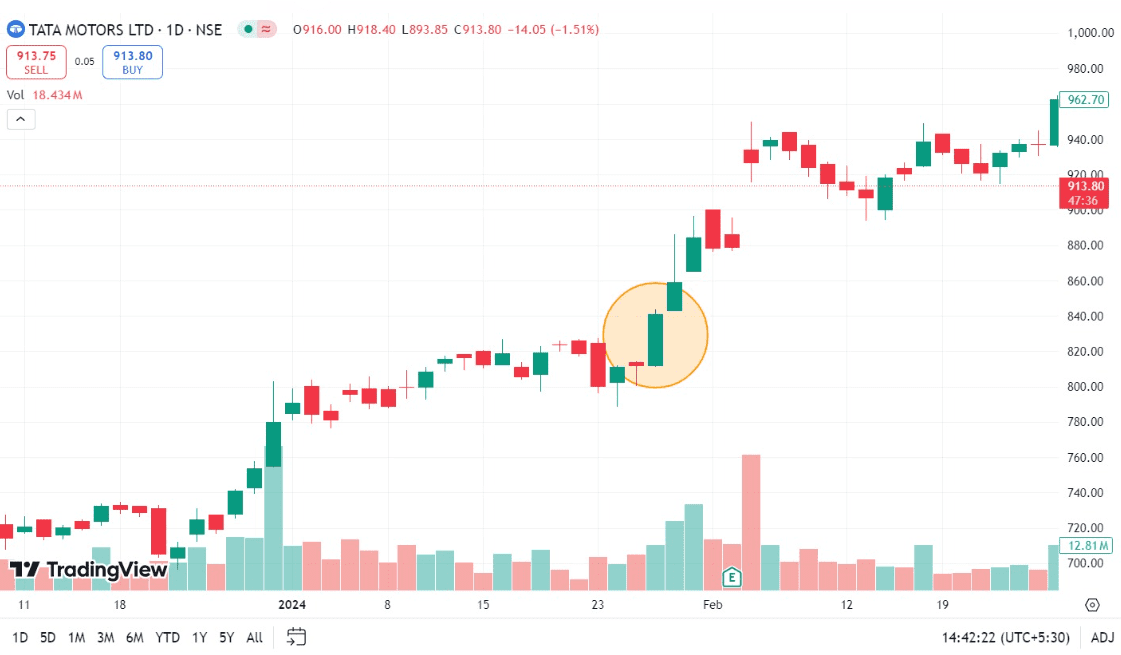
Example of White Spinning Top Pattern of Shipping Corp of India ltd.
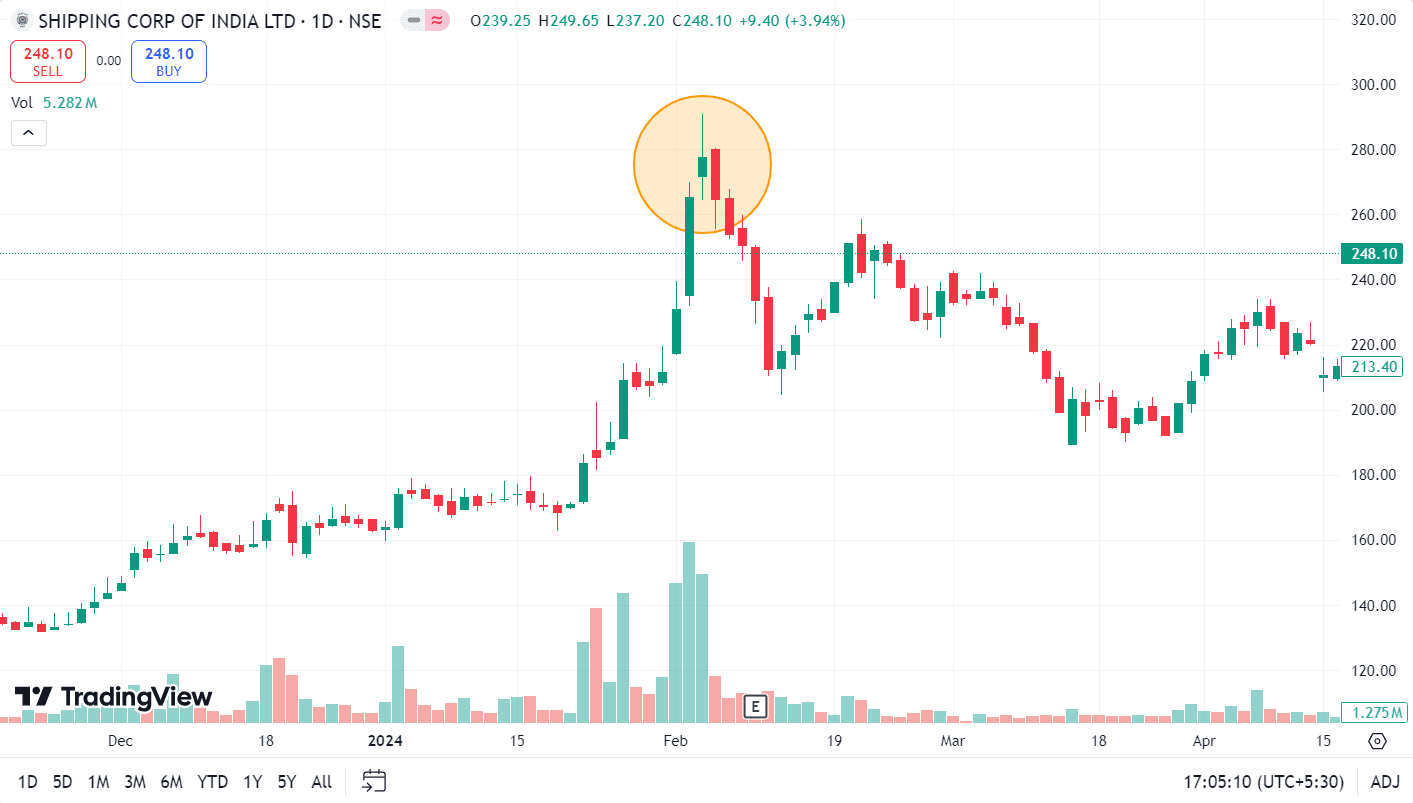
The above image shows the formation of a White Spinning Top pattern on the daily timeframe of the Shipping Corporation of India. The stock was in an uptrend, and then it made a White Spinning Top Pattern on 5 February 2024. As the previous trend was bullish, the occurrence of the pattern suggests market indecision and a potential pause in bullish momentum or a bearish reversal. The stock closed at INR 264, i.e., below the low of the White Spinning Top candlestick on 6 February 2024. The bearish candle after the pattern confirmed the bearish reversal, and the stock made a low of INR 210 on 12 February 2024.
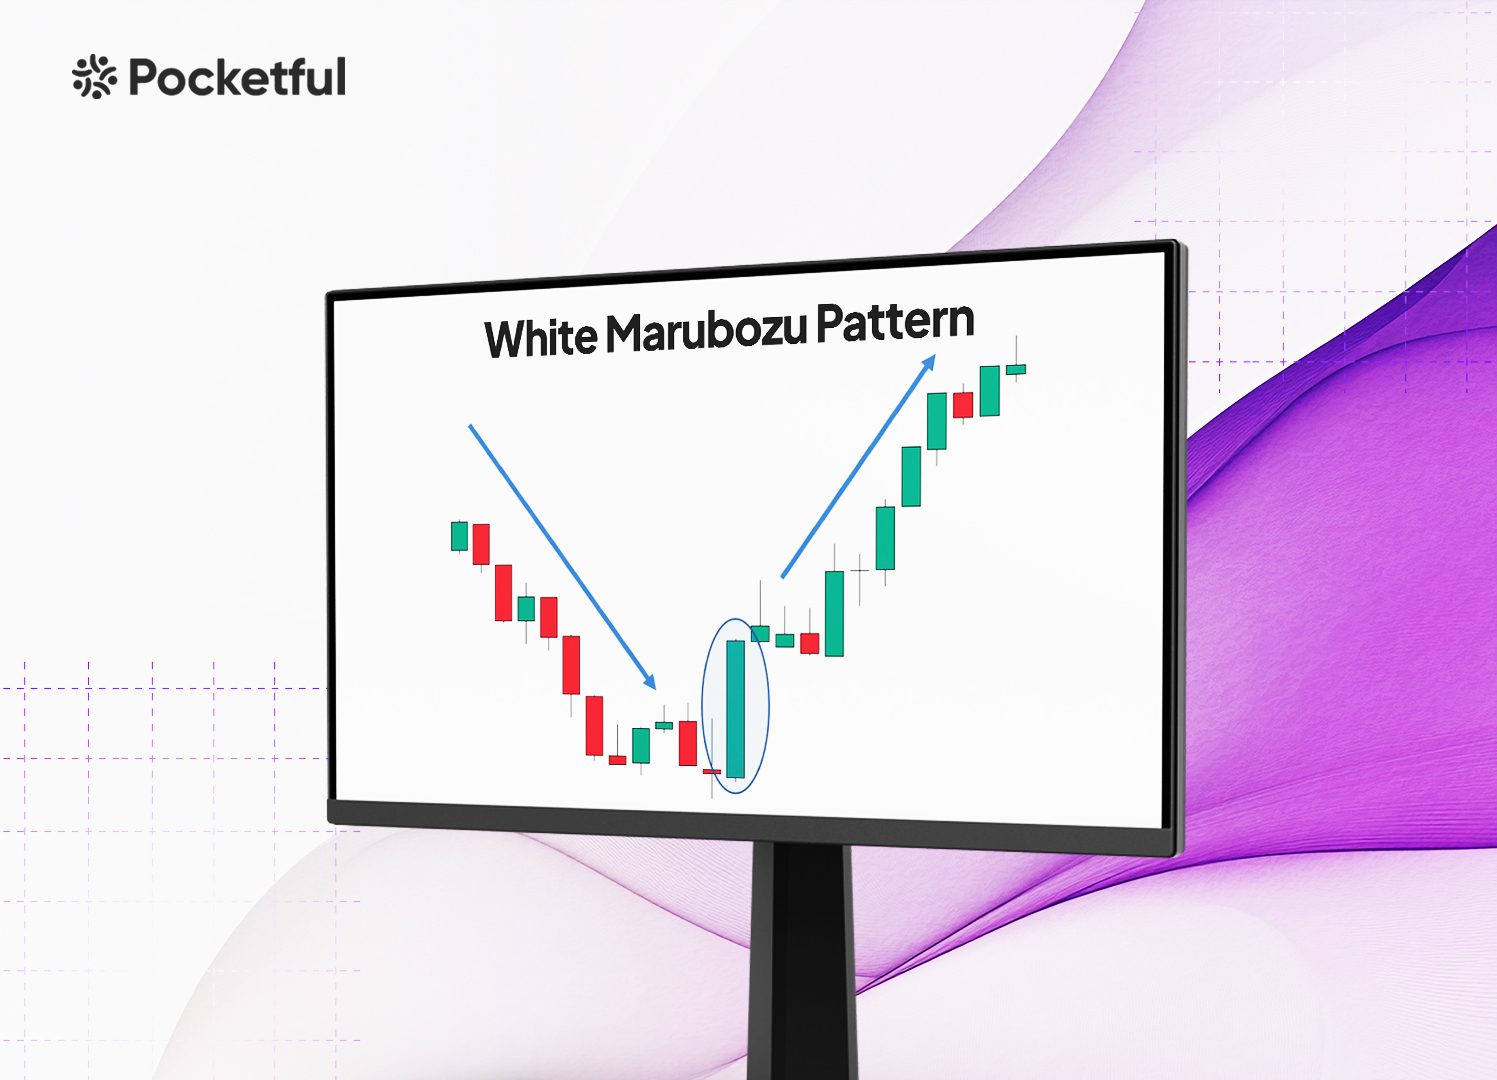
Read Also: Opening White Marubozu Pattern
Advantages of White Spinning Top Pattern
The advantages of the White Spinning Top pattern are:
- Reversal Signal: The White Spinning Top indicates a possible shift in the prevailing trend, whether transitioning from bullish to bearish or vice versa.
- Useful in Multiple Time Frames: This pattern is versatile and can be used across multiple timeframes, be it daily, weekly, or even long-term charts. It allows traders to easily spot trading opportunities across various time frames.
- Can be used with Other Indicators: The White Spinning Top pattern works best alongside other technical indicators, such as RSI, MACD, or moving averages. Pattern signals are quite reliable, especially when used with support/resistance levels or other indicators.
Limitations of White Spinning Top Pattern
The limitations of the White Spinning Top pattern are:
- Indecision: The pattern is indecisive in nature as it doesn’t indicate a clear direction, making it difficult to make quick decisions, and traders may miss trading opportunities while they wait for confirmation.
- False Signals in Short Time Frames: Short-term traders using 5- or 15-minute time frames may see White Spinning Tops often due to market noise. Unfortunately, these patterns often give more false signals than trading opportunities.
- Dependence on Market Context: The White Spinning Top pattern has limited use without considering overall market trends or conditions. For example, it may occur during periods of sideways consolidation, reducing its significance for traders seeking trend reversals or breakout signals.
Read Also: What is Three Outside Up Pattern
Conclusion
The White Spinning Top candlestick pattern is a simple yet useful pattern in technical analysis, providing traders with valuable insights into market indecision and the likelihood of trend reversals or continuations. Understanding this pattern can enhance a trader’s ability to anticipate market movements, allowing for more informed decision-making. By monitoring the context in which the White Spinning Top appears, traders can better position themselves for potential opportunities. Even though the pattern lacks clear buy or sell signals, it is beneficial when combined with other technical indicators and patterns.
Frequently Asked Questions (FAQs)
Example of White Spinning Top Pattern of Shipping Corp of India ltd.
It is neutral but can indicate a possible bullish reversal in a downtrend or a bearish reversal in an uptrend.
Can the White Spinning Top pattern be used in any market?
The White Spinning Top pattern can be used in stocks, forex, commodities, and other markets across different timeframes.
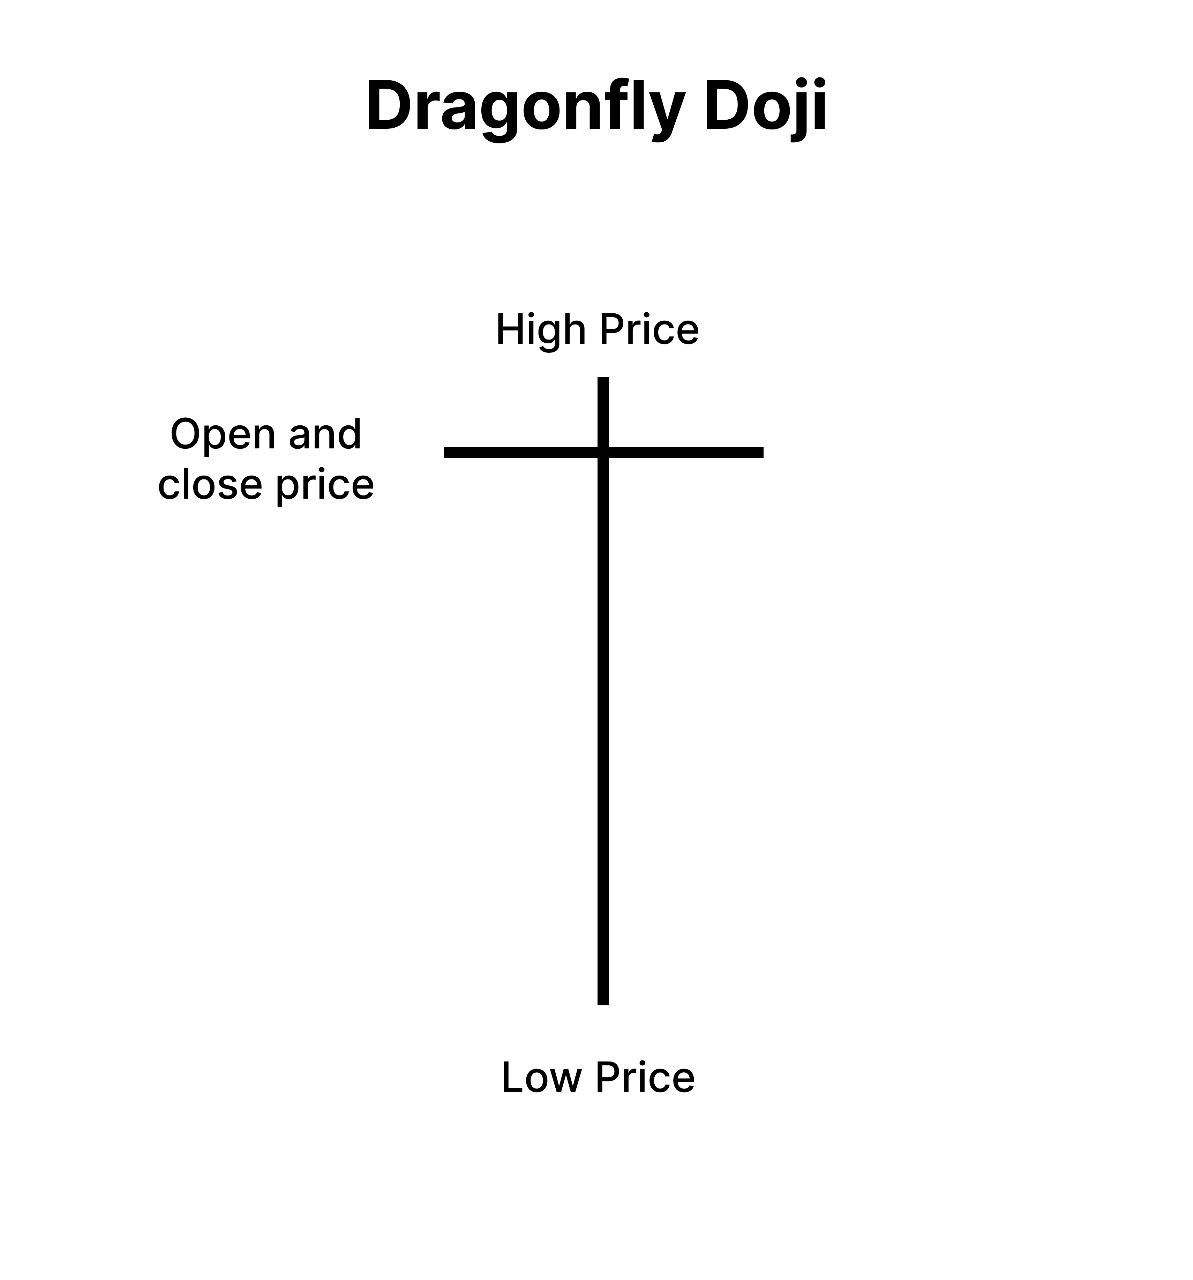
What is the difference between a White Spinning Top and a Doji?
A Doji has little to no body, indicating that the open and close prices of the trading session were approximately equal, while a White Spinning Top has a small body showing slight price movement.
How do I confirm the signal validity of a White Spinning Top pattern?
Individuals should wait for confirmation in the form of the next candlestick, which helps identify a clear directional move, either bullish or bearish.
Is the White Spinning Top pattern useful in very short time frames?
Unfortunately, price movements in a very short timeframe are affected by noise, due to which the pattern may generate false signals.