Every few months, something happens in the Indian stock market that gets everyone talking: your colleague mentions it at lunch, your family WhatsApp group suddenly fills up with forwarded messages, and even people who have never opened a Demat account start asking questions. More often than not, the reason behind all this noise is a Hot IPO.
Now, excitement is not always a bad thing. It brings new investors into the market, creates liquidity, and sometimes delivers good returns.
People have rushed into IPOs simply because everyone else seemed to be doing it, only to watch the stock fall below its issue price within weeks of listing.
In this blog, we will walk you through what makes an IPO hot, who is driving that demand, and most importantly, whether all that excitement is actually backed by something real.
What is a Hot IPO?
An IPO, or Initial Public Offering, is when a company opens its doors to the general public for the first time and invites people to become part-owners by buying its shares. Think of it like a new restaurant opening in your city; if the excitement is strong enough before it even opens, people are already lining up outside.
A Hot IPO is exactly that. It is an IPO that generates so much craze and interest among investors, even before the shares are listed on BSE or NSE, that people rush to apply in huge numbers.
Why Does an IPO Become Hot?
Not every IPO gets this kind of attention. A company earns this tag when investors genuinely believe it has something special going for it. This could be because of the following reasons:
- The company is a household name, like when Zomato or LIC came out with their IPOs, practically every Indian investor was talking about it
- It belongs to a sector that is booming at that time, whether it is fintech, defence, EVs, or renewable energy.
- The company has shown strong and consistent revenue growth over the past few years
- Big institutional players like mutual funds and foreign investors have already shown interest
- The promoters or founders have a proven track record that people trust
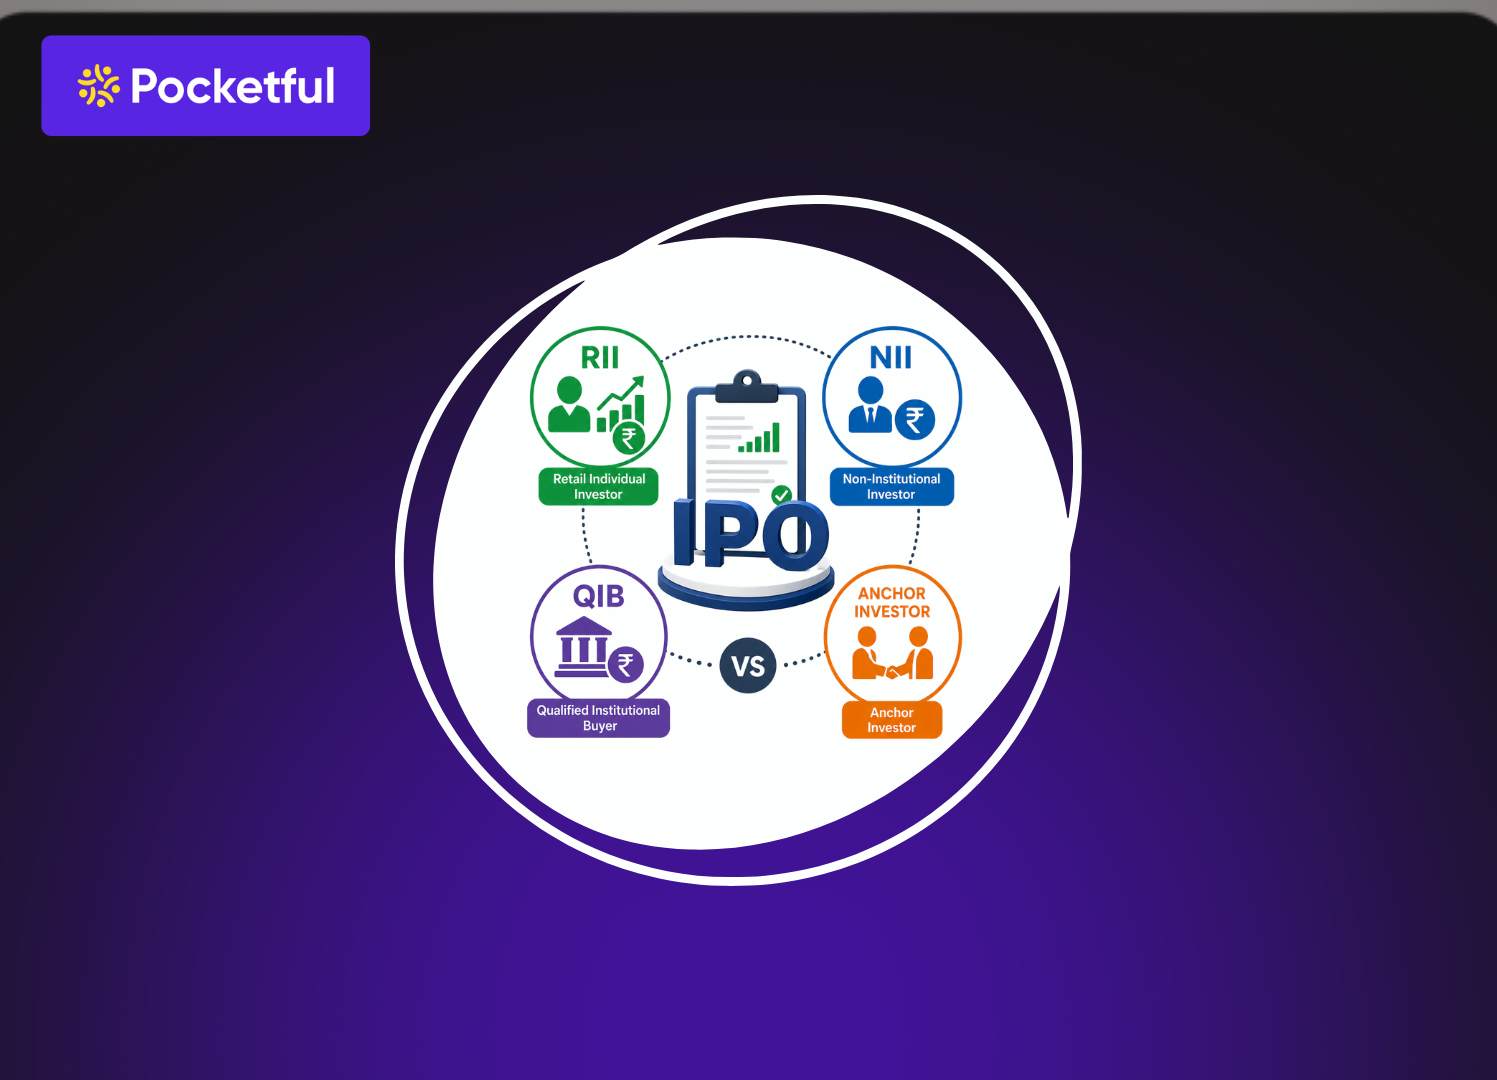
Who Drives the Demand?
The frenzy around a hot IPO is not just from one type of investor. It builds up from multiple sides at once:
- Retail Investors: Everyday people like you and me, applying through platforms like Zerodha, Groww, or Upstox. The minimum application is usually one lot, and millions of people apply hoping to get an allotment.
- High Net Worth Individuals (HNIs): Apply under the Non-Institutional Investor (NII) category. These are people investing above ₹2 lakhs. In hot IPOs, they often borrow money, called IPO financing, just to increase their chances of allotment.
- Qualified Institutional Buyer (QIB): Mutual Funds and Insurance Companies fall under this category. When big institutions put in large bids, it signals to retail investors that the IPO is worth taking seriously.
- Foreign Institutional Investors (FIIs): They also participate, and their interest often adds an extra layer of confidence among domestic investors.
Does a Hot IPO Always Mean a Profitable IPO?
- A hot IPO creates a lot of listing day excitement, and many investors chase what the listing gains, the profit made on the very first day of trading if the share opens above its issue price. But listing day performance and long-term performance are two very different things.
- For Example, Paytm’s IPO in 2021 was one of India’s biggest ever and generated massive interest, yet it listed at a sharp discount and took years to recover. On the other hand, companies like Tata Technologies are listed at a strong premium and continue to perform reasonably well.
- So while a hot IPO can absolutely give you quick gains, it can also burn you if you apply without understanding the business fundamentals. The heat of an IPO does not always reflect the health of a company.
Read Also: What is the IPO Cycle
Advantages of Hot IPO
- Chance of Listing Gains: Many investors apply for hot IPOs, hoping the stock will list at a higher price than the issue price. If that happens, investors may earn quick gains on listing day, and if not they will eventually end up losing their initial investment amount also.
- Invest Early in a Growing Company: An IPO gives investors an opportunity to become part of a company at an early stage of its listed journey. If the company grows well in the future, it may benefit long-term investors.
- Exposure to Growing Sectors: Many popular IPOs come from industries that are growing quickly, such as technology, finance, renewable energy, or consumer businesses.
Risks of Hot IPO
- Strong Subscription Does Not Guarantee Returns: An IPO getting heavily subscribed does not always mean it will give profits in the future. Market conditions and the company’s financial performance still matter.
- Limited Track Record: Some companies may not have a long history of profits or stable business performance, making it harder to judge their future growth.
- Hype Can Influence Decisions: Many people apply for hot IPOs just because everyone else is talking about them. Investing without understanding the business can become risky.
How to Evaluate the Hot IPO
1. Understand the Company’s Business
First, try to understand what the company does and how it earns money, its future growth potential, business model, and the ongoing demand. A strong and growing business usually attracts long-term investors.
2. Check the Financial Performance
Look at the company’s financial performance over the last few years. Important things that we need to check include:
- Revenue growth
- Profit growth
- Debt levels
- Cash flow
- Overall financial stability
Companies with consistent growth and healthy financials are generally considered stronger.
3. Know Why the Company is Raising Money
Read the purpose of the IPO carefully. Companies may raise funds for their business expansion, repaying debt, new projects or working capital needs.
If most of the money is going to existing shareholders instead of the business, investors should study the IPO more carefully.
4. Look at Subscription Numbers
Strong subscription numbers usually show investor interest in the IPO. Investors often track retail subscription, institutional subscription, and HNI subscription.
But remember, high subscription alone does not guarantee good returns.
5. Check the Grey Market Premium (GMP)
GMP gives an idea about market sentiment before listing. A strong GMP may indicate positive demand, but it is unofficial and can change quickly. It should not be the only factor while making an investment decision.
Read Also: What is the IPO Allotment Process?
Conclusion
At the end of the day, a hot IPO is not just a financial event, it becomes almost a cultural moment in the Indian market. Hot IPOs have a way of pulling people into the market who would otherwise never have opened a Demat account.
Undoubtedly, it brings energy, liquidity, and participation into the market. But excitement alone has never made anyone wealthy in the long run. Applying for an IPO because your colleague did, or because the GMP shot up overnight, is not investing. It is gambling with extra steps.
So the next time a hot IPO lands in your social media feed, check the DRHP. Look at the valuation. Invest in IPOs with Pocketful and enjoy zero brokerage on delivery trades through an easy-to-use investing platform.
Frequently Asked Questions (FAQs)
What does oversubscription mean?
It means far more people applied than there are shares available. If an IPO is subscribed 80 times, it means investors applied for 80 times the number of shares on offer.
Can hot IPOs give good returns?
They certainly can, but there are no guarantees. The ultimate truth is that hype and reality do not always match.
What is GMP in an IPO?
GMP stands for Grey Market Premium. It is the unofficial price at which IPO shares are being traded before they officially list. If an IPO has a GMP of ₹80 over an issue price of ₹500, it suggests people expect it to list around ₹580.
Can a hot IPO fall after listing?
Yes. Once the subscription excitement dies down and institutional investors begin booking profits, the price can correct sharply.
How can I check whether an IPO is good or not?
Start with the DRHP filed with SEBI, it is publicly available and contains everything from financial statements to business risks.