Blog

  • What is After Hours Trading: Definition, Benefits & Risks

    What is After Hours Trading: Definition, Benefits & Risks

    Imagine you come from the office in the evening and are scrolling through the news, and then you come across an important announcement from a company, and you expect that the stock price might go up in the next trading session. But you are worried that it might open a gap tomorrow, and you will not be able to purchase it at the desired price. After-hours trading is a tool through which one can place an order even after the regular trading session.

    In this blog post, we will give you an overview of after-hours trading along with its key benefits.

    What is After Hours Trading?

    After-hours trading refers to the process of placing buy and sell orders after the regular market hours. This is a facility that allows investors to place orders after the normal trading sessions are over. However, there is a misconception about the Indian trading ecosystem that retail investors can also participate in the live market after the trading session ends. Retail investors can only place after-market orders for the next trading session. 

    Key Features of After-Hours Trading

    The key features of after-hours trading are as follows:

    1. After-Market Order: This allows the investor to place valid buy and sell orders after market hours. It is suitable for traders who do not have time to place an order during market hours.
    2. Orders are Queued: The orders placed during after-hours trading hours are not executed immediately; they are queued for the next day’s trading session.
    3. No Guarantee of Execution: Simply placing an order after the normal trading session does not mean that the order will get executed; it will only get executed when the matching order is placed in the system.
    4. Different Timings: The after-hours timings can vary from broker to broker. Therefore, it is advisable to check the timing with the broker with whom you have a trading account.

    How Does After-Hours Trading Work?

    The process of after-hours trading is as follows:

    1. End of Regular Market Hours: The normal trading hours of the Indian stock market end around 3:30 PM. After the normal trading hours end, investors cannot place regular market orders.
    2. Placing of Orders after trading hours: If your broker provides the facility of after-market orders, then you can easily log in to your trading account and place buy and sell orders.
    3. Order in a Queue: The order is not instantly executed; it remains in the queue according to the broker and exchange process.
    4. Opening of Market: As soon as the market opens the next day, the order that has already been placed will be entered into the market. However, the execution is not guaranteed. It will be executed only after the order is matched with the relevant order.

    Timings of After-Hours Trading in India

    The details of after-hours trading in India are as follows:

    1. Regular Market Hours: The main trading session runs from 9:15 AM to 3:30 PM. During this session, investors can place buy and sell orders in different securities such as stocks, bonds, ETFs, etc.
    2. Post-Market Session: Once the regular trading session ends, the exchange has a different closing process. This session runs from 3:30 PM to 3:40 PM. During this session, eligible orders can be placed for the next trading session.
    3. After-Market Order Trading: This is an after-hours trading session that depends on the broker. This window generally operates from 4:00 PM to 8:55 AM. During this period, an investor can place an order for the next trading session.
    Trading SessionsTimings
    Regular Market Hours9:15 AM to 3:30 PM
    Post Market Session3:30 PM to 3:40 PM
    After-Hours Trading4:00 PM to 8:55 AM*

    The after-hours trading session depends on the broker and type of order.

    Read Also: What is Overnight Trading?

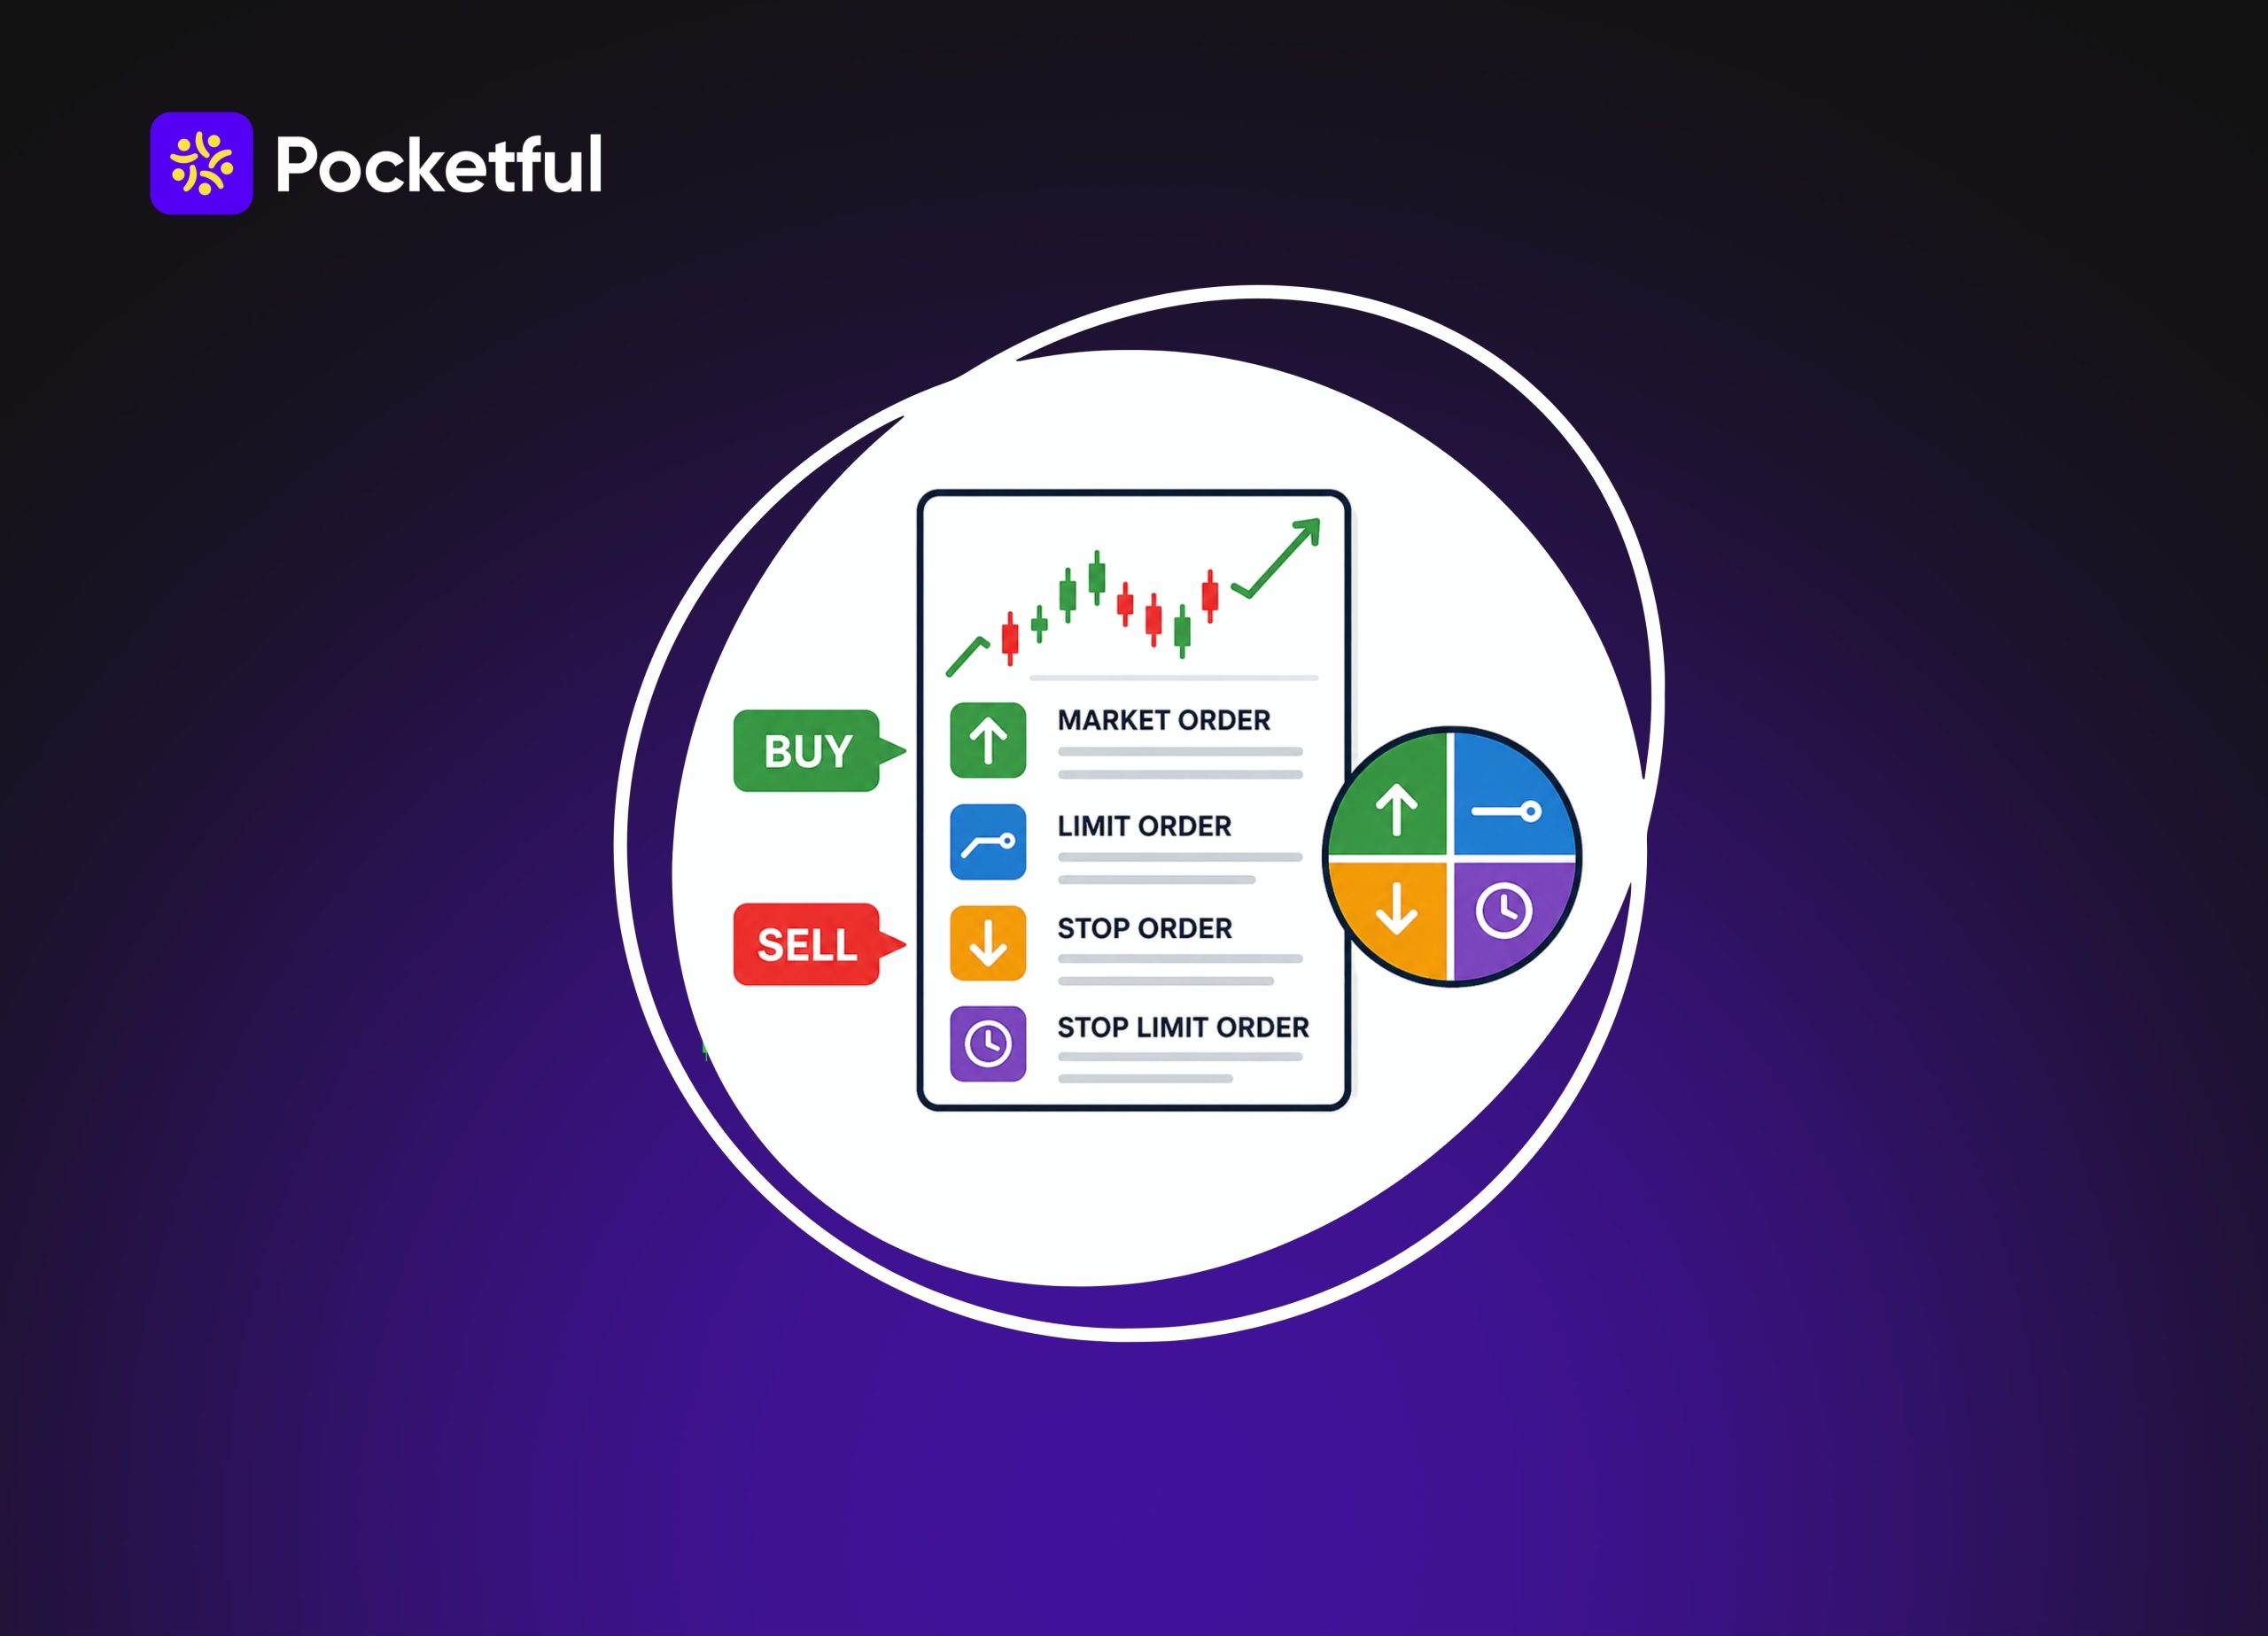
    Types of Orders in After-Hours Trading

    The following are the different types of after-hours trading orders that one can place:

    1. Limit Buy Order: In this type of buy order, one can place a bid at a specific price at which you are willing to pay to purchase a stock.
    2. Limit Sell Order: The limit sell order allows you to specify the minimum price at which you are willing to sell your shares.
    3. Stop-Loss Order: There are various brokers that provide a way to place a stop-loss order after trading hours. In this type of order, one can place a stop-loss trigger below the current market price for a stock you already own.
    4. Market Order: This order is designed to execute at the best available market price. However, this order is not available for all after-hours trades.

    Benefits of After-Hour Trading

    The key benefits of after-hour trading are as follows:

    1. Convenience: One is not required to be available in front of the trading screen during the regular market hours. They can place eligible orders after trading hours.
    2. Advance Planning: If one finds an opportunity in any stock and does not want to wait for the next trading session in the morning. They can place orders in advance.
    3. No Need for Morning Rush: The initial trading hours in the morning are very hectic, especially when the market is volatile.
    4. Suitable for Working Professionals: After-hour trading is suitable, especially for working professionals, because they are busy with their work commitments during trading hours. This helps them to place orders even after market hours. 

    Risk of After-Hour Trading

    The risks related to after-hour trading are as follows:

    1. Morning Volatility: Due to significant volatility during the morning trading session, the market and stocks may open gap up and gap down. This might not allow an investor to get their expected market price.
    2. No Guaranteed Execution: Placing the order only after market hours does not guarantee execution. The order will only be executed when there is a matching order available in the system.
    3. Liquidity Risk: Various stocks have low trading volume. If there are not enough buyers and sellers, it will impact liquidity.
    4. Restrictions from the Broker’s End: Not every broker allows after-hour trading. Also, there are certain brokers that do not allow some specific types of orders, such as stop-loss orders, etc. 

    Difference Between Regular and After-Hour Trading

    The key difference between regular and after-hours trading is as follows:

    ParticularsRegular Trading HoursAfter-Hour Trading
    Timing9:15 AM to 3:30 PMAfter regular trading hours, depending on the broker.
    ExecutionOrders are executed during the trading session.Orders are queued only for the next trading session.
    PricePrices change continuously based on demand and supply in the market.There will be no real-time price update during the after-hours trading session.
    Certainty of PriceThe price depends on the order type and market conditions.The opening price of the next day can vary from the previous day’s closing price. 
    SuitablilityThis is suitable for active traders.After-hour trading is suitable for investors who want to place orders outside market hours.

    Things to Keep in Mind Before Placing After-Hour Trades

    The key factors to keep in mind before placing after-hour trades are as follows:

    1. Check the Timing with Your Broker: As the after-hour trading time varies from broker to broker. Therefore, it is advisable to check the timings with the broker with whom you have your demat account.
    2. Overnight News: Before placing any overnight order, one must look for any important development that could affect the performance of any stock. Any negative news can significantly impact stocks.
    3. Realistic Prices: If you are using any limit order type while placing an order during after-hours trading, then one must carefully select the price.
    4. Checking Order Status: One should not assume that the order placed after the trading session will get executed automatically. It is advisable to check whether it was executed, rejected, cancelled, etc. 

    Read Also: What Is Day Trading and How to Start With It?

    Conclusion

    On a concluding note, after-hours trading is a convenient option that helps investors place orders after the regular market hours. These orders are queued for the next trading session. This allows an investor to analyse the development of the market and have a more flexible option while placing trades. However, this does not guarantee execution at a specific price, and overnight news can significantly impact market movements. Therefore, it is advisable to consult your investment advisor before placing an after-hours trade.

    S.NO.Check Out These Interesting Posts You Might Enjoy!
    1What is the Best Time Frame for Swing Trading?
    2MCX Trading: What is it? MCX Meaning, Features & More
    3Silver Futures Trading
    4What is Crude Oil Trading and How Does it Work?
    5What is Spread Trading?
    6What is Tick Trading?
    7What is Algo Trading?
    8What Is Colour Trading
    9What is Options Trading?
    10What is Quantitative Trading?

    Frequently Asked Questions (FAQs)

    1. What is after-hours trading?

      After-hours trading is a process through which a trader can place after-market orders even after the regular trading session has ended.

    2. How can I place a buy and sell order after 3:30 PM?

      To place a buy and sell order after 3:30 PM through an After-Market Order. However, one needs to check the timing with the broker.

    3. Are there any additional charges to place an after-market order?

      No, there are no additional charges to place an after-market order. This service is offered free of charge by the brokers.

    4. Can I place AMO for commodities?

      Yes, you can place AMO for commodities along with equity and other asset classes. However, it depends on the broker which segment they support.

    5. Can I place an after-hours order on weekends?

      Yes, you can place an after-hours order on weekends, but it will be considered for the next applicable trading session.

  • Minimum Capital Required for Options Trading in India

    Minimum Capital Required for Options Trading in India

    Every second trader you meet on Twitter or in a Telegram group seems to be trading options full-time. What most of them do not talk about is the capital cushion behind their trades, the number that decides whether they survive a bad month or blow up their account trying to recover from one.

    If you are thinking about quitting your job to trade options full-time, capital planning is not optional since the minimum capital required for trading can be a setback for you.

    Let us break down what enough capital looks like for an Indian retail trader.

    Why isn’t the Margin the Whole Story?

    So many people who enter F&O think about capital in terms of margin, i.e., how much money the exchange or broker asks for to open a position. 

    A full-time trader also needs money to survive the months when trades do not work, money to cover living expenses without touching the trading account, and money set aside for the mistakes every trader makes in year one, no matter how good the strategy is on paper. One should treat options trading like any other trading business. 

    Understand it this way:

    A shop owner does not just plan for rent, they also plan and budget for slow months, unexpected repairs, and unpredictable profits. Trading also works in the same manner.

    How Much Capital Do You Need to Trade?

    1. Trading Capital

    It is the core fund and the money you will deploy in the market for buying options, writing options, or running spreads. 

    For someone trading Nifty and Bank Nifty options, ₹5-10 lakh is a realistic starting range for position sizes. 

    If you are planning to sell options, your capital needs a hike because option writing requires margin, which is often 10 to 15% of the contract value. 

    2. The Buffer Margin

    As per SEBI’s margin rules, your broker blocks margin the moment you take a position, and if your margin dips below the required level in intraday, you can get auto-squared off. This is where a lot of traders lose money. 

    This is why it is suggested that you never deploy more than 60-70% of your available margin on any single day. Keep the rest as a buffer against adverse moves, especially during expiry week or around major events.

    3. Living Expenses 

    This is the part that separates people who last from people who quietly go back to a 9-to-5 within eight months. If your monthly household expenses are ₹50,000, you need at least 12-18 months of that in a separate account, untouched by your trading capital. 

    That is ₹6-9 lakh minimum. The reason this has to be separate is simple psychology. If your rent money is inside your trading account, every red day feels like an emergency, and you will start making decisions out of fear instead of strategy. Keep the two completely disconnected. 

    4. Drawdown Reserve

    A trader with a good strategy might still see a 20-30% drawdown at some point due to how markets behave.

    If your trading capital is ₹8 lakh and you hit a 25% drawdown, that means you are down to ₹6 lakh. 

    Build in a mental and financial rule: if your capital drops by a certain percentage, say 20%, you pause, reassess your strategy, and possibly trade smaller sizes until you rebuild confidence and capital. Having a reserve fund specifically for this phase. 

    Capital Requirements for Full-Time Option Traders

    Trading Capital ₹5 to ₹10 Lakh
    Living Expenses 12 – 18 months or ₹6-₹12 Lakh, depending on lifestyle and city
    Drawdown Buffer₹1 – ₹2 Lakh

    This means that a sustainable starting point to become a full-time options trader is somewhere around ₹12-24 lakh in total resources, and not all of which needs to be in the market at once.

    Someone starting with less than ₹5 lakh in trading capital alone can still learn and grow, but then calling that person a full-time options trader will be risky.

    Capital Needed for Option Buying vs. Option Selling

    The Minimum capital required for options trading is as follows,

    Option buying only needs the premium amount upfront and nothing more. 

    If you are buying a Nifty call for ₹150 and the lot size is 75, you need ₹11,250 for one lot, also a little amount for brokerage and taxes. That is the entire capital; your maximum loss is capped at the premium paid. 

    This is why option buying is less expensive to get into, and also why so many beginners over-trade it: 

    Option selling (writing) minimum capital works very differently. Since your potential loss is theoretically unlimited (or very large on the writing side), SEBI-mandated margin requirements are far higher and include SPAN and exposure margin, which can work out to 10-15% of the contract value for index options.

    On Bank Nifty or Nifty, this can mean the minimum capital required for option selling lies anywhere from ₹1.5-3 lakh blocked per lot, depending on volatility 

    Selling strangles or naked options without adequate margin buffers is exactly how accounts get wiped out during a sudden move.

    Capital Required for Futures Trading

    Futures work on a different capital logic than options. 

    For index futures like Nifty or Bank Nifty, margin requirements fall between 10-15% of the contract value, similar to option selling, since your risk profile as a futures trader is symmetrical, and you can lose (or gain) on either side without a cap. 

    For a Nifty futures contract with a value of several lakh rupees, this can mean ₹1.5-2.5 lakh blocked per lot, and this amount can change with market volatility, so you can check your broker’s margin calculator regularly. 

    For stock futures, margin requirements vary widely from stock to stock based on volatility, and illiquid stock futures can have wider spreads that eat into your returns. 

    If you are planning to trade multiple futures positions together, ₹8-12 lakh is a more realistic starting point than jumping in with the bare minimum margin, because futures do not cap your downside the way buying options does.

    Read Also: What is Futures and Options Trading in India

    Margin and Capital Allocation in F&O Trading

    Knowing your total corpus is one thing. Understanding how that money gets blocked by the exchange when you place a trade is what most beginners skip, 

    Here’s how it works, step by step.

    • Step 1: The upfront premium demand, if you are buying options. As a buyer, your capital allocation is simple, you pay the entire premium upfront, in full. Brokers are not allowed to hand you intraday leverage or credit to buy options, so if a Nifty call costs ₹100 and the lot size is 75, you need ₹7,500 in your account before you can execute. 
    • Step 2: SPAN and ELM margin: Writing options or holding futures positions blocks your capital through a two-tier system. SPAN margin is worked out through a standardised portfolio analysis that estimates the worst-case loss a contract could see in a single day. On top of that exists Extreme Loss Margin (ELM), usually around 2% for index contracts, which is an extra cushion the clearing house adds to protect itself against an unexpected move. Together, these two get blocked in your account the moment you write an option or take a futures position, and they can shift day to day depending on volatility.
    • Step 3: The 50:50 cash-collateral rule. You cannot fund your entire F&O margin by pledging your long-term stock portfolio. 

    SEBI requires at least 50% of your active trading margin to be in pure cash or cash equivalents, with the remaining 50% coming from non-cash collateral like pledged shares. 

    Once you understand this mechanism, allocation gets easier to reason about. 

    Do not forget about Taxation in India

    A lot of people planning to become full-time options traders completely overlook it. 

    F&O income is treated as non-speculative business income, not capital gains. You will also need to maintain proper records of every trade, not just for your own tracking, but because turnover beyond a certain limit can trigger tax audit requirements. 

    Hence, it becomes important to keep aside a portion of your profits and capital specifically for tax throughout the year. 

    Points to Keep in Mind while you Plan your Capital 

    1. Pick a broker built for active trading

    When you are placing multiple trades a day, execution speed, low brokerage, and a clean options interface matter more than most beginners realize. 

    Platforms like Pocketful, for instance, are built specifically around active F&O traders. 

    2. Track your Costs

    Do not forget to account for your actual costs apart from P&L. Brokerage, STT, exchange charges, and slippage together can make up a large chunk of a full-time trader’s expenses. Review all these costs monthly, not just your directional wins and losses.

    3. Re-analysing your Capital

    Your living expenses, your risk appetite, and your strategy’s performance will all change over your first couple of years.

    What felt like enough capital in month one might not hold up by the last month of the year, especially if you have family responsibilities

    4. Do not Confuse Capital with Income

     Having ₹15 lakh aside does not mean you are entitled to a ₹1 lakh monthly income from trading. Let your expectations be realistic and size them according to your trading strategy. 

    5. Do not deploy the entire Capital on Day 1

    There is a temptation to jump in with your full trading capital, especially if you’ve been paper trading or trading part-time for a while. 

    Avoid this and start with maybe 30-40% of your total trading capital for the first few months and see how your strategy works in live markets. 

    Read Also: What is Options Trading?

    Conclusion 

    Capital requirements for full-time options trading are not just about the margin your broker demands. 

    The reality of options trading in India is different from what is often shown on social media. 

    If we talk about how much we can earn in option trading in India, data shows roughly 88% to 91% of individual retail options traders lose money while a disciplined 9% to 12% make a profit.

    Traders who separate their trading capital, living expenses, and drawdown reserve tend to last far longer. 

    Futures & Options trading can absolutely become a full-time career in India, but it rewards preparation more than confidence.

    S.NO.Check Out These Interesting Posts You Might Enjoy!
    1Physical Settlement in Futures and Options
    2Types of Futures and Futures Traders
    3Option Chain Analysis: A Detail Guide for Beginners
    4Option Buying vs Option Selling: Key Differences
    5Bullish Options Trading Strategies Explained for Beginners

    Frequently Asked Questions (FAQs)

    1. How much money do I need to trade options full-time in India? 

      There is no single number, but most people need somewhere between ₹12-₹24 lakh in total. Anything less, and you are probably trading too small to call it full time.

    2. Can I start full-time options trading with ₹2-3 lakh? 

      You can trade with that. But calling it full-time is definitely not a good idea. Your position sizes will be too small to actually pay your bills.

    3. Should my trading capital and living expenses be in the same account? 

      No, keep them apart. When EMIs are lying in your trading account, every losing day feels like a crisis.

    4. How many months of expenses should I save before going full-time?

      12-18 months is a reasonable minimum. If you can stretch to 24 months, again a good option. 

    5. Is option selling more capital-intensive than option buying? 

      Generally, yes. Selling requires margin, while buying only needs the premium amount.

  • Trading Terminal: Meaning, Features, Types & Benefits

    Trading Terminal: Meaning, Features, Types & Benefits

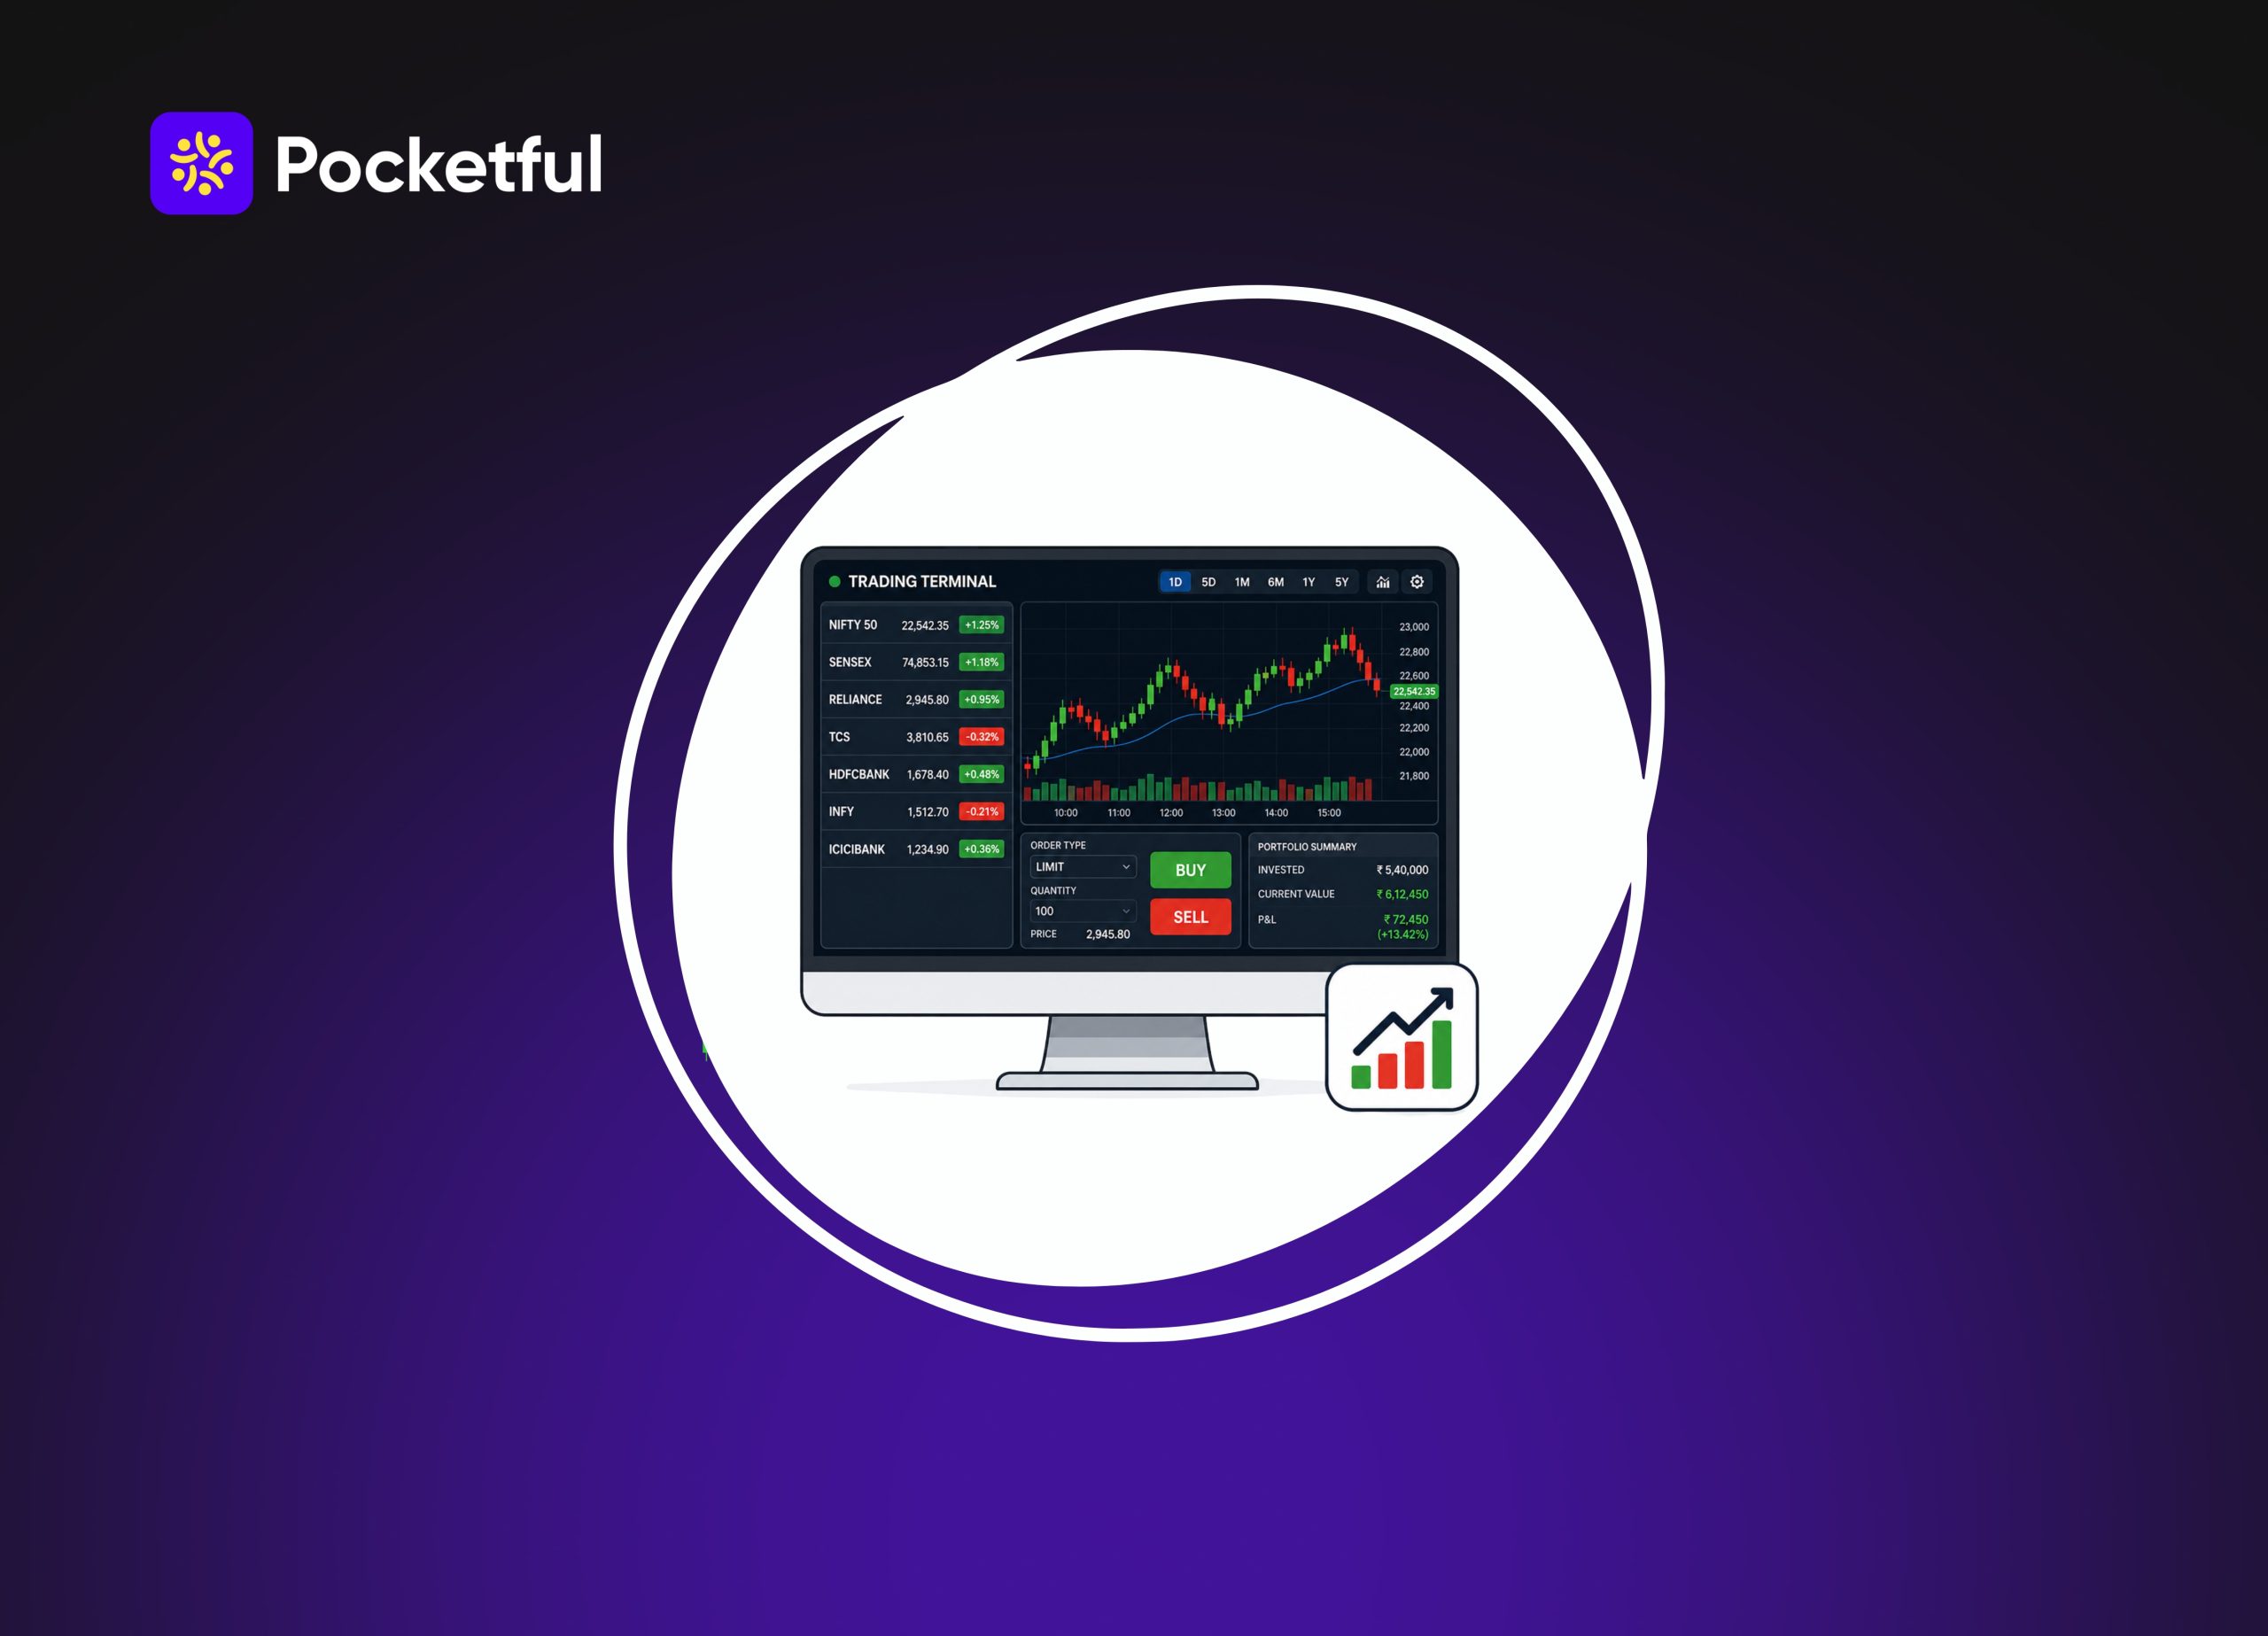
    The stock market has evolved exponentially over time, and so have trading patterns. Earlier, one used to call their broker to get their trades done, but it took time and delayed the execution of the trade. That’s where a trading terminal comes in because it is a personalised workspace for trading.

    In today’s blog post, we will give an overview of a trading terminal key benefits.

    What is Trading Terminal?

    A trading terminal is a platform or software provided by your broker that allows a trader to execute their trade. It provides real-time market updates and has built-in tools for analysing various securities. Trading terminals allow you to execute trades across different asset classes, such as stocks, commodities, and other financial instruments. Through a trading platform, one can check prices of stocks, create a watchlist, analyse charts, place orders, track positions, etc., from a single screen. 

    Key Features of a Trading Terminal

    The key features of a trading terminal are as follows:

    • Real-Time Market Data: A trading terminal provides live market data such as trading volume, stock prices, etc. This helps investors make informed decisions.
    • Market Depth: A trading terminal shows the market depth, which shows available buy and sell orders at different price levels. This gives traders an idea about demand and supply.
    • Execution of Order: A trader can directly place an order from the trading terminal. This helps them execute trades faster.
    • Secure Access: Security is another important feature of a trading terminal. It uses a secure login method and protects investors’ financial information. 

    How Does a Trading Terminal Work?

    The working process of a trading terminal is as follows:

    • Login: The first step is to log in to the trading terminal provided by your broker using your credentials.
    • Checking Market Information: The next step is to check the live market information, including stock price movement, trading volume, etc.
    • Technical Charts: Before placing any purchase order, one should analyse stocks based on various parameters such as technical indicators, etc.
    • Selecting Type of Order: After you decide on your trade, the next option will be selecting the order type. There are various types of orders, such as market orders, limit orders, stop-loss orders, etc.
    • Matching Order: The exchange system of trading matches your order with a corresponding order from the available orders in the system.
    • Monitor Portfolio: Once the execution is completed, your trades start to appear in your trading account. One can use their terminal to monitor their positions.
    • Exit Position: Whenever you decide to close your position, you can place a sell or buy order depending on your initial position.

    Read Also: What is a Stock Broker?

    Types of Trading Terminal

    Depending on the investor’s requirements, they can choose a suitable trade terminal for accessing the market. The common types of trading terminals are as follows:

    1. Desktop-Based Trading Terminal: This type of trading terminal is installed on your computer or laptop. It is commonly preferred by active traders who regularly trade and use advanced charts, technical tools, multiple screens, etc. It runs on a computer; therefore, it is convenient for traders who prefer to spend several hours on screen analysing charts.
    2. Web-Based Terminal: This terminal is accessible directly through an internet browser and does not require separate software. One can simply log in to the website of their broker and access their trading account. You can access this from any computer that has an internet connection and a browser.
    3. Mobile Trading Terminal: This is a trading application through which you can access the market. It is installed on your mobile device and offers features such as a watchlist, market data, etc. The mobile trading terminal is preferred by traders who prefer trading on the go.

    How to Invest with Your Trading Terminal

    The step-by-step process to invest through a trading terminal is as follows:

    1. Opening a Trading and Demat Account: To start using a trading terminal, you are required to open a trading and demat account.
    2. Login into Trading Terminal: After your account is opened, you can log in to the trading terminal of your choice from a desktop platform, website, or mobile application.
    3. Research and Analysis: The next step would be analysing the companies in which you wish to invest. The stock must be evaluated based on various factors such as historical price movement, financial performance, volume, etc.
    4. Adding stocks to watchlist: The selected stock needs to be added to the watchlist. This helps an investor track the price movement of the chosen stock.
    5. Placing a Buy Order: Once you have decided to invest, you can place the buy order based on your capital. The order can be entered using different order types such as market, limit, etc.
    6. Tracking Order Status: The placed order needs to be tracked in the order book, and investors are required to check whether it has been placed or not.
    7. Monitoring Investment: One can also use a trading terminal to keep track of their holdings and overall portfolio so the profits can be booked in a timely manner. 

    Benefits of Using a Trading Terminal

    With the adoption of online investing, a trading terminal India has become an important tool for traders, and the benefits of using a trading terminal are as follows:

    • Quick Access: One can easily access the commodity and capital market data through the trading terminal. This allows an investor to track and manage market movements.
    • Instant Order Execution: The buy and sell orders can be executed immediately from the trading terminal. It is especially useful for intraday traders.
    • Real-Time Updates: Trading terminals provide access to market data such as bid and ask prices, volume, market depth, etc. This helps traders in making informed decisions.
    • Customised Watchlist: Traders who regularly track certain stocks can use a trading terminal to add to a customised watchlist. It allows easy monitoring of securities without the hassle of searching for them repeatedly.
    • Tracking: One does not need to maintain a separate record to track how their investments are performing. The trading terminal can easily show your holdings, open positions, etc., in one place.

    Read Also: What Is Day Trading and How to Start With It?

    How to Choose a Trading Terminal

    The key factor that one is required to consider before choosing a trading terminal is as follows:

    • Comparison of Brokerage Charges: One should evaluate the brokerage cost and other account-related charges and should choose a broker that offers affordable brokerage along with other features.
    • User Interface: The trading terminal must have a clean and easy-to-use interface. It makes trading easier, and one can find watchlists, charts, etc., in one place.
    • Check for Speed and Reliability: Active traders rely on the speed and reliability of the trading terminal. It should load market information smoothly and allow placing trades instantly.
    • Analysis Tools: Traders rely on various technical tools and charting features to analyse stocks. Hence, the trading terminal must be equipped with advanced trading tools.

    Conclusion

    On a concluding note, a trading terminal is a one-stop solution for active traders who generally prefer to track live market data regularly and study charts. A trading terminal brings the convenience of order placement, portfolio tracking, market data, etc., in one place. However, choosing a trading terminal should not be based only on the number of features; it must be equipped with speed, charting tools, etc. But it is advisable to consult your investment advisor before choosing a broker and evaluate all the key features of the trading terminal. 

    S.NO.Check Out These Interesting Posts You Might Enjoy!
    1What Is Cash Trading?
    2What is Averaging Up in Stock Trading?
    3What is Speculative Trading in Stock Market?
    4What is Quoted Price in Commodity Trading?
    5How To Use Directional Movement Index In Trading?

    Frequently Asked Questions (FAQs)

    1. What is the difference between a trading terminal and a trading account?

      A trading account is a type of account through which an investor buys and sells securities of different types, such as shares, ETFs, etc. Whereas a trading terminal is a platform or interface provided by your broker through which you can operate and access your trading account.

    2. Are there any charges for using a trading terminal?

      Yes, there are fixed fees charged on a monthly basis by the brokers to use a trading terminal. However, there are certain brokers that allow an investor to use a trading terminal at zero cost.

    3. What is market depth in a trading terminal?

      Market depth in a trading terminal shows the total number of buy and sell orders placed at different price levels. This only gives an idea about the liquidity, demand, and supply of a stock.

    4. Can I do algo trading through trading terminals?

      Yes, there are various brokers that offer algo trading through their trading terminals.

    5. What are the factors that need to be considered while choosing a trading terminal?

      The key factors to consider while choosing a trading terminal are charting tools, fast order execution, customer support, etc.

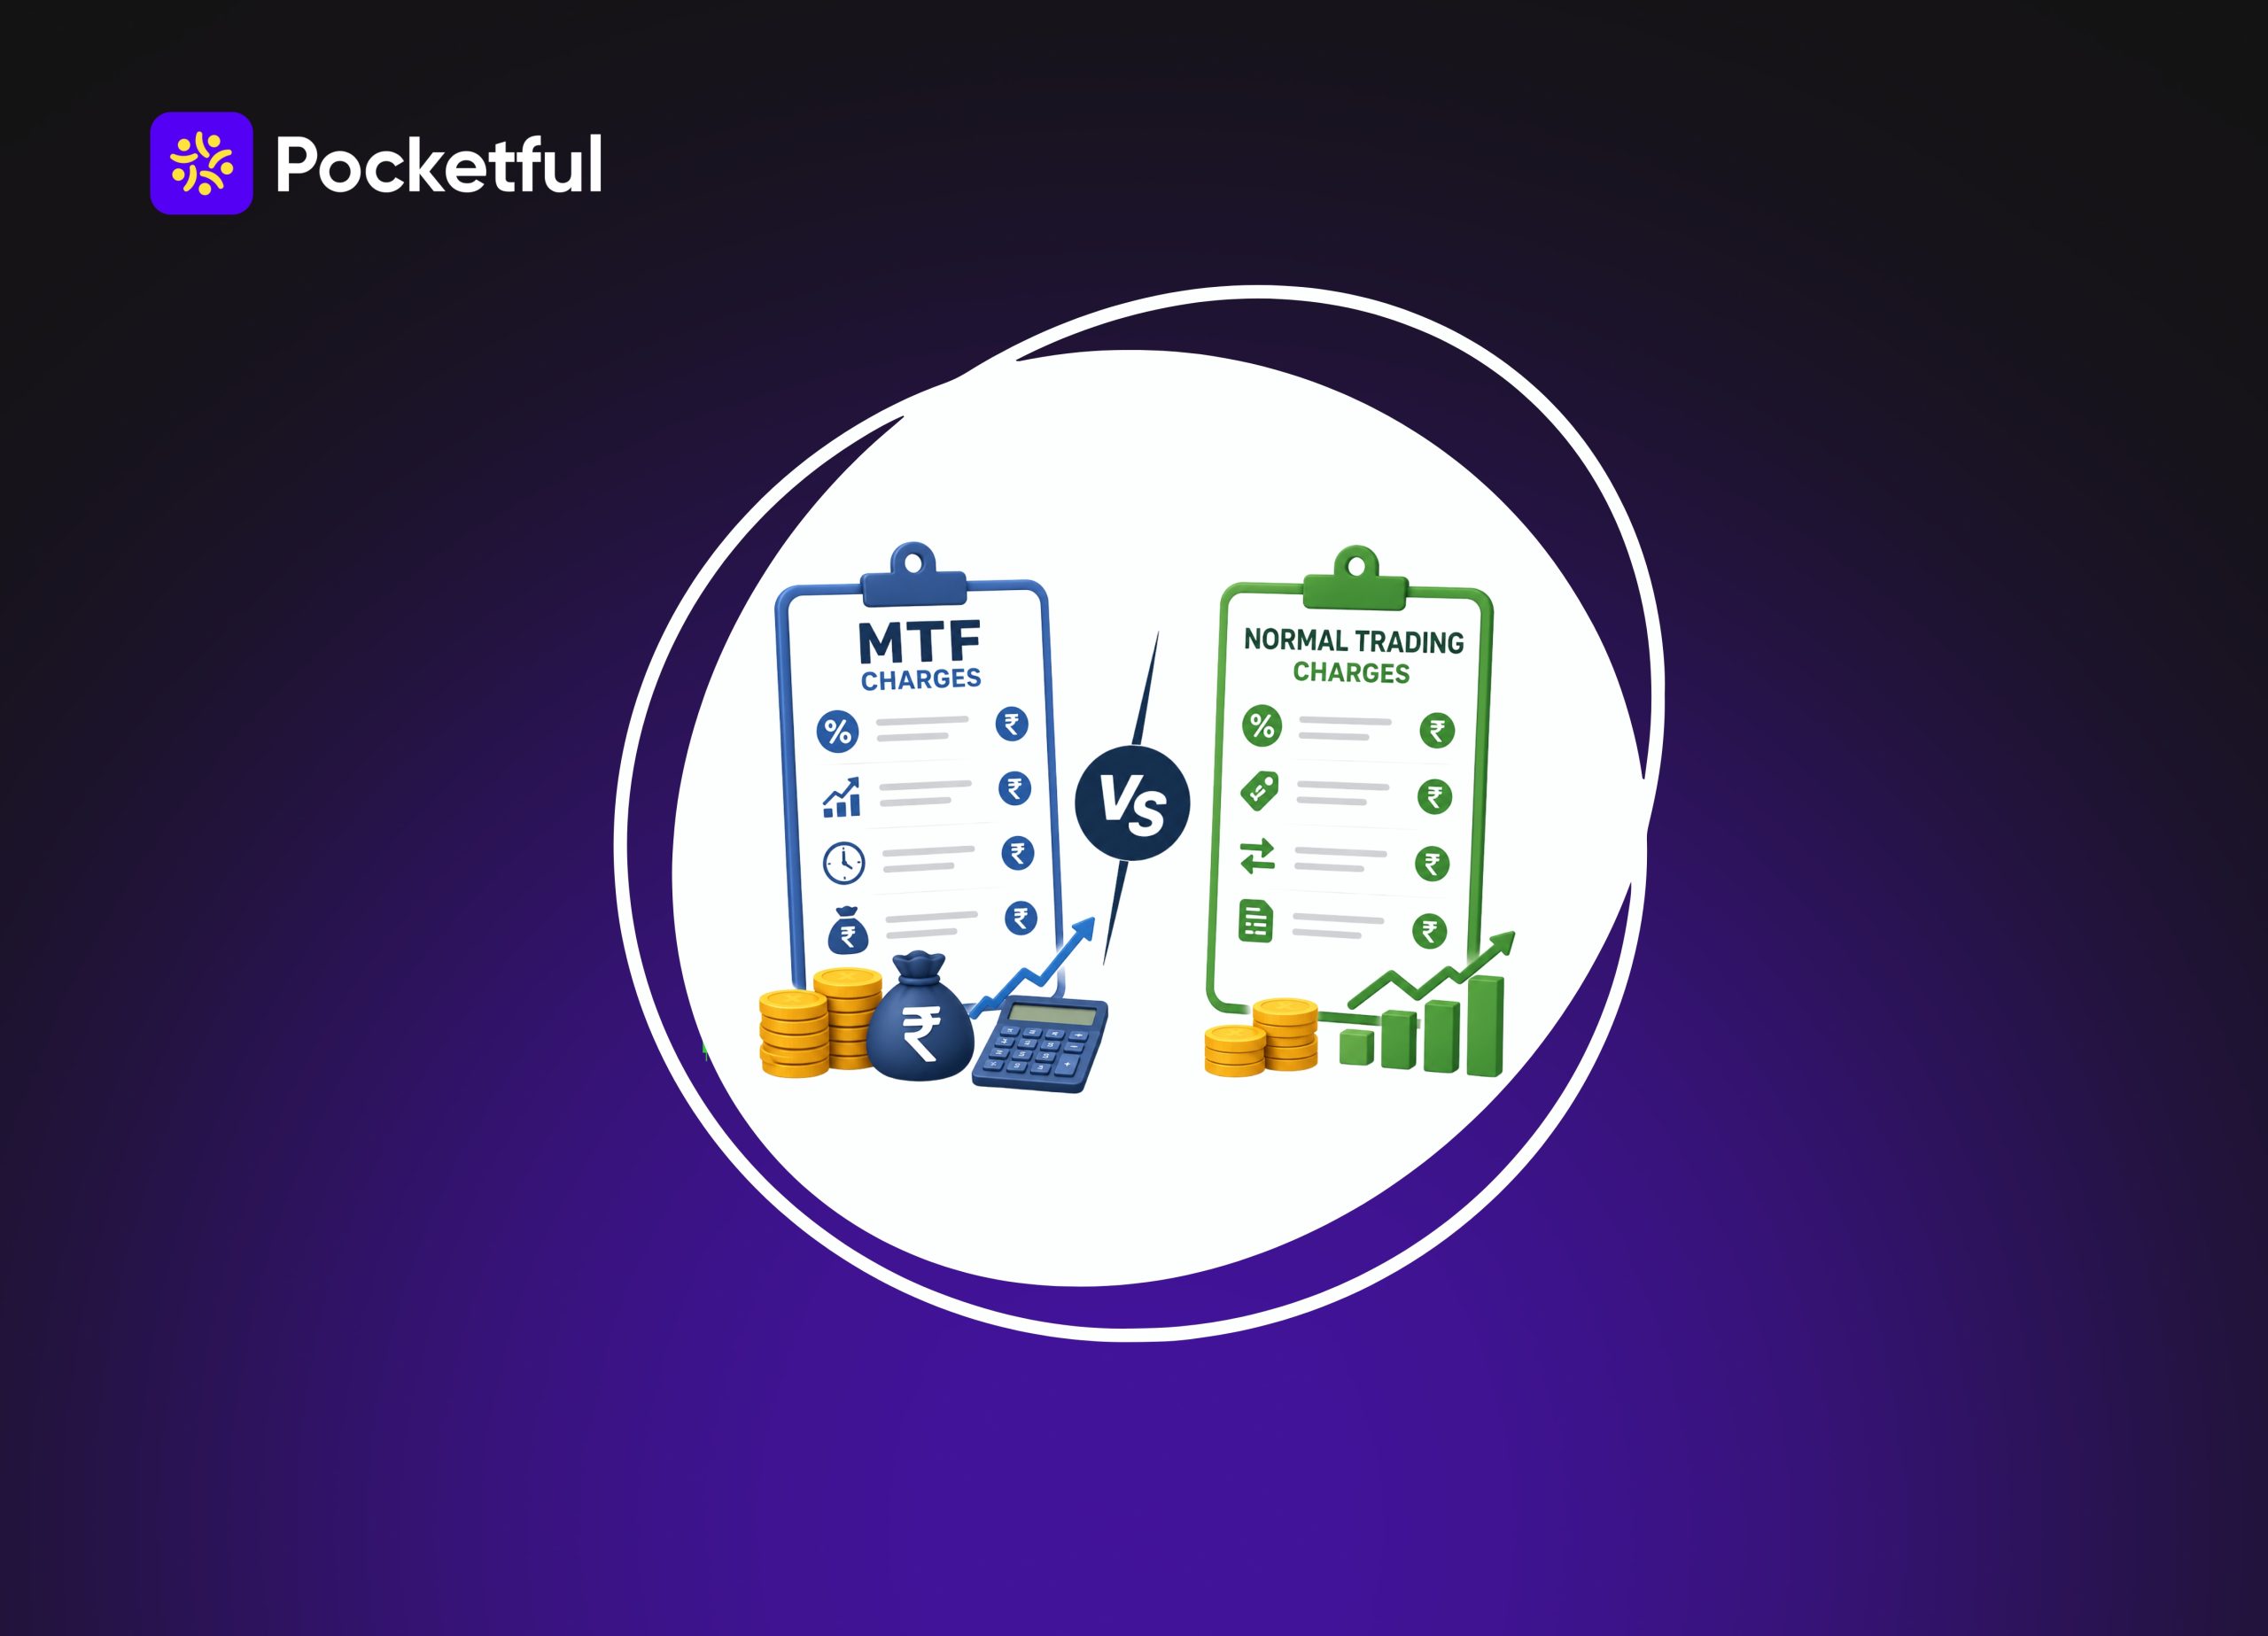
  • MTF Charges vs Normal Trading Charges: Key Differences

    MTF Charges vs Normal Trading Charges: Key Differences

    Entering the stock market opens doors to exciting financial opportunities and wealth creation. Understanding the costs associated with buying and selling shares remains a critical step for every retail investor. Different investment approaches carry distinct fee structures that directly impact overall profitability. A clear grasp of these specific financial commitments helps market participants build smarter and safer investment strategies. This comprehensive guide explores the fees involved in standard cash transactions and borrowed capital trades to help investors navigate market expenses seamlessly.

    What is Margin Trading Facility (MTF)?

    The Margin Trading Facility is a special service offered by stockbrokers in India. It allows investors to buy shares even if they lack the full cash amount in their trading account. The investor simply pays a small portion of the total cost upfront, which is known as the margin.

    The stockbroker funds the remaining balance on behalf of the investor. This specific setup acts like a short-term loan designed purely for buying approved equity shares. Retail traders frequently use this feature to increase their purchasing power.

    For instance, an investor with ten thousand rupees can purchase shares worth fifty thousand rupees using this leverage. The broker provides the extra forty thousand rupees to complete the trade. This extra buying power helps traders take much larger positions in the equity market.

    The Securities and Exchange Board of India regulates this facility strictly to protect retail investors from excessive risk. Brokers must follow exact regulatory rules regarding how much margin an investor must provide. The margin amount required is calculated using specific risk metrics to ensure market stability. Furthermore, not all listed shares can be bought using this borrowed capital.

    Margin Trading Facility Charges

    When using borrowed funds, investors must pay specific trading fees to the broker. These costs are naturally higher than standard cash trades because broker capital is involved. The total cost can significantly impact the final net profit of any trade. Here are the primary charges involved:

    • Interest Charges: Brokers charge a daily interest rate on the exact amount they lend to the investor. This is the most significant cost in margin trading. It adds up every single day until the loan is completely repaid. Pocketful offers a highly competitive interest rate starting at 5.99 percent per year for amounts up to one lakh rupees. This translates to a low daily rate of 0.0164 percent. Other brokers generally charge standard interest rates around 12 to 18 percent per year.
    • Brokerage Fees: This is the standard commission charged by the broker for executing the buy and sell orders. Depending on the platform, this can be a flat fee or a small percentage of the total trade value. Pocketful charges 0.1 percent of the turnover per order for these leveraged trades.
    • Pledge and Unpledge Charges: To secure the borrowed funds, the purchased shares must be formally pledged to the broker as collateral. The central depositories charge a small fee for processing this security hold.
    • Statutory Taxes: These are mandatory government and regulatory fees applied to all stock market transactions. They include the Securities Transaction Tax, which is usually 0.1 percent on both the buy and sell sides. Additional charges include an 18 percent GST on the brokerage fees, state stamp duty, and exchange transaction fees.

    Read Also: MTF Charges Explained

    What is Normal Trading?

    Normal trading is the traditional and most straightforward way of buying and selling shares in the cash market. This popular method is also commonly known as equity delivery trading. In this approach, the investor pays the full price of the shares upfront using personal money.

    There is absolutely no borrowing or leverage involved in a normal transaction. Once the purchase is successfully completed, the shares are delivered directly to the investor’s personal demat account. The settlement usually happens on the next working day. The trader then has complete and absolute ownership of the purchased stocks.

    Investors can hold these shares for a few days, several months, or even decades without any pressure. Because the investor uses personal capital, there are no daily interest costs to worry about. The stockbroker cannot force the investor to sell the shares if the market price suddenly drops.

    Normal Trading Charges

    The cost structure for normal delivery trades is much simpler and generally cheaper. The complete absence of a broker loan removes several recurring fees from the trading equation. Investors only pay for the execution of the trade and the mandatory government taxes. Here are the charges associated with normal trading:

    • Delivery Brokerage: Many modern discount brokers offer zero brokerage on normal equity delivery trades. This zero-fee structure helps retail investors save a significant amount of money over time. 
    • Depository Participant Charges: A flat fee is applied by the depository whenever shares are sold and removed from a demat account. This fee is applied per stock symbol, regardless of the quantity of shares sold. 
    • Statutory Levies: Normal delivery trades attract the Securities Transaction Tax at 0.1 percent on the total transaction value. Investors must also pay GST, state stamp duty, and exchange transaction fees to the respective authorities. These taxes are automatically collected by the broker and securely passed on to the government.
    • Annual Maintenance Charges: Some stockbrokers charge a fixed yearly fee to keep the demat account active and fully functional. However, many newer digital platforms try to reduce this financial burden for retail investors. Pocketful currently offers a zero annual maintenance charge policy for standard accounts.

    Differences Between MTF Costs and Normal Trading Charges

    FeatureMTF CostsNormal Trading Charges
    Capital SourceThe investor pays a small margin while the broker funds the remaining amount.The investor pays the full total amount using personal funds.
    Interest FeesDaily interest is strictly applied on the borrowed funds.No interest charges are applied because no funds are borrowed.
    Pledge CostsInvestors must pay fees for pledging shares as collateral.Pledging is not required for simple cash delivery trades.
    Holding RiskHigh risk due to potential margin calls and accumulating daily interest.Low risk with absolutely no forced selling pressure from the broker.
    Brokerage FeesUsually charged as a flat fee or a percentage of the turnover.Often zero brokerage with discount brokers for delivery trades.

    Why MTF Charge Structure Differs From Normal Trading?

    The fee structure for margin trades differs from normal trading because it functions as a short-term loan. Brokers take on financial risk by lending capital to investors. To compensate for this risk, brokers levy a daily interest charge on the funded amount. Regulatory guidelines also mandate the pledging of shares as collateral. This introduces extra administrative costs, such as pledge fees, which simply do not exist in standard cash transactions.

    When Normal Trading Is More Cost-Effective Than MTF?

    While borrowed capital provides excellent extra buying power, it is not always the best financial choice. There are specific market scenarios where relying on normal cash trading saves a considerable amount of money. Here are situations where normal trading is superior:

    • Long-Term Investments: For investors planning to hold stocks for several months or years, normal trading is significantly cheaper. The daily interest in margin trading compounds constantly over time. This heavily accumulated interest can easily wipe out any long-term profits generated by the stock price appreciation.
    • Low Volatility Markets: When stock prices are moving very slowly, the financial returns generated might not cover the interest costs of the borrowed funds. Normal trading ensures that slow capital growth is not quietly eaten away by daily borrowing charges.
    • Limited Risk Appetite: Traders who prefer total peace of mind will always find normal trading much more cost-effective. It completely eliminates the hidden emotional cost of stress and the risk of margin calls. This protects the investor from amplified financial losses during sudden market crashes.
    • Dividend Yield Strategies: Investors buying shares strictly to earn annual dividends benefit vastly more from normal trading. The interest paid on a broker loan will almost always exceed the small dividend payouts received from the company. Keeping holding costs at zero is vital for successful dividend investors.
    • Tax Planning Considerations: Income generated from normal delivery trading is smoothly treated as capital gains, which offers clear tax benefits. When traders use borrowed funds heavily, tax authorities might classify the income as business income. This classification can lead to a higher tax bracket and much stricter reporting requirements.

    Read Also: Differences Between MTF and Loan Against Shares

    Conclusion

    Both normal trading and margin trading offer excellent advantages for active market participants. Normal trading provides a strong sense of security and remains a brilliant choice for building long-term wealth steadily. By carefully calculating expected returns and understanding the associated costs, investors can choose the perfect approach. 

    S.NO.Check Out These Interesting Posts You Might Enjoy!
    1Margin Against Shares: How Does it Work?
    2Margin Pledge: Meaning, Risks, And Benefits
    3What is Intraday Margin Trading?
    4Is Margin Trading Facility (MTF) Safe in India?
    5What Is Liquidation in MTF?

    Frequently Asked Questions (FAQs)

    1. What is the meaning of Margin Trading Facility?

      It is a service where investors buy shares by paying a small margin, while the broker funds the remaining balance as a short-term loan.

    2. What are the benefits of using margin trading?

      It successfully increases purchasing power. This allows traders to buy more shares with limited funds and potentially amplify profits during short-term price movements.

    3. How to use the margin trading feature?

      Open a trading account, select eligible stocks, maintain the required initial margin amount, and choose the margin option before placing a buy order in the system.

    4. What does normal trading mean?

      Normal trading means buying shares using only personal capital. The investor pays the full price upfront and takes full ownership of the purchased stocks.

    5. What is the main benefit of normal trading?

      It is highly secure and cost-effective for retail investors. Individuals face zero borrowing fees, no daily interest charges, and no risk of sudden margin calls.

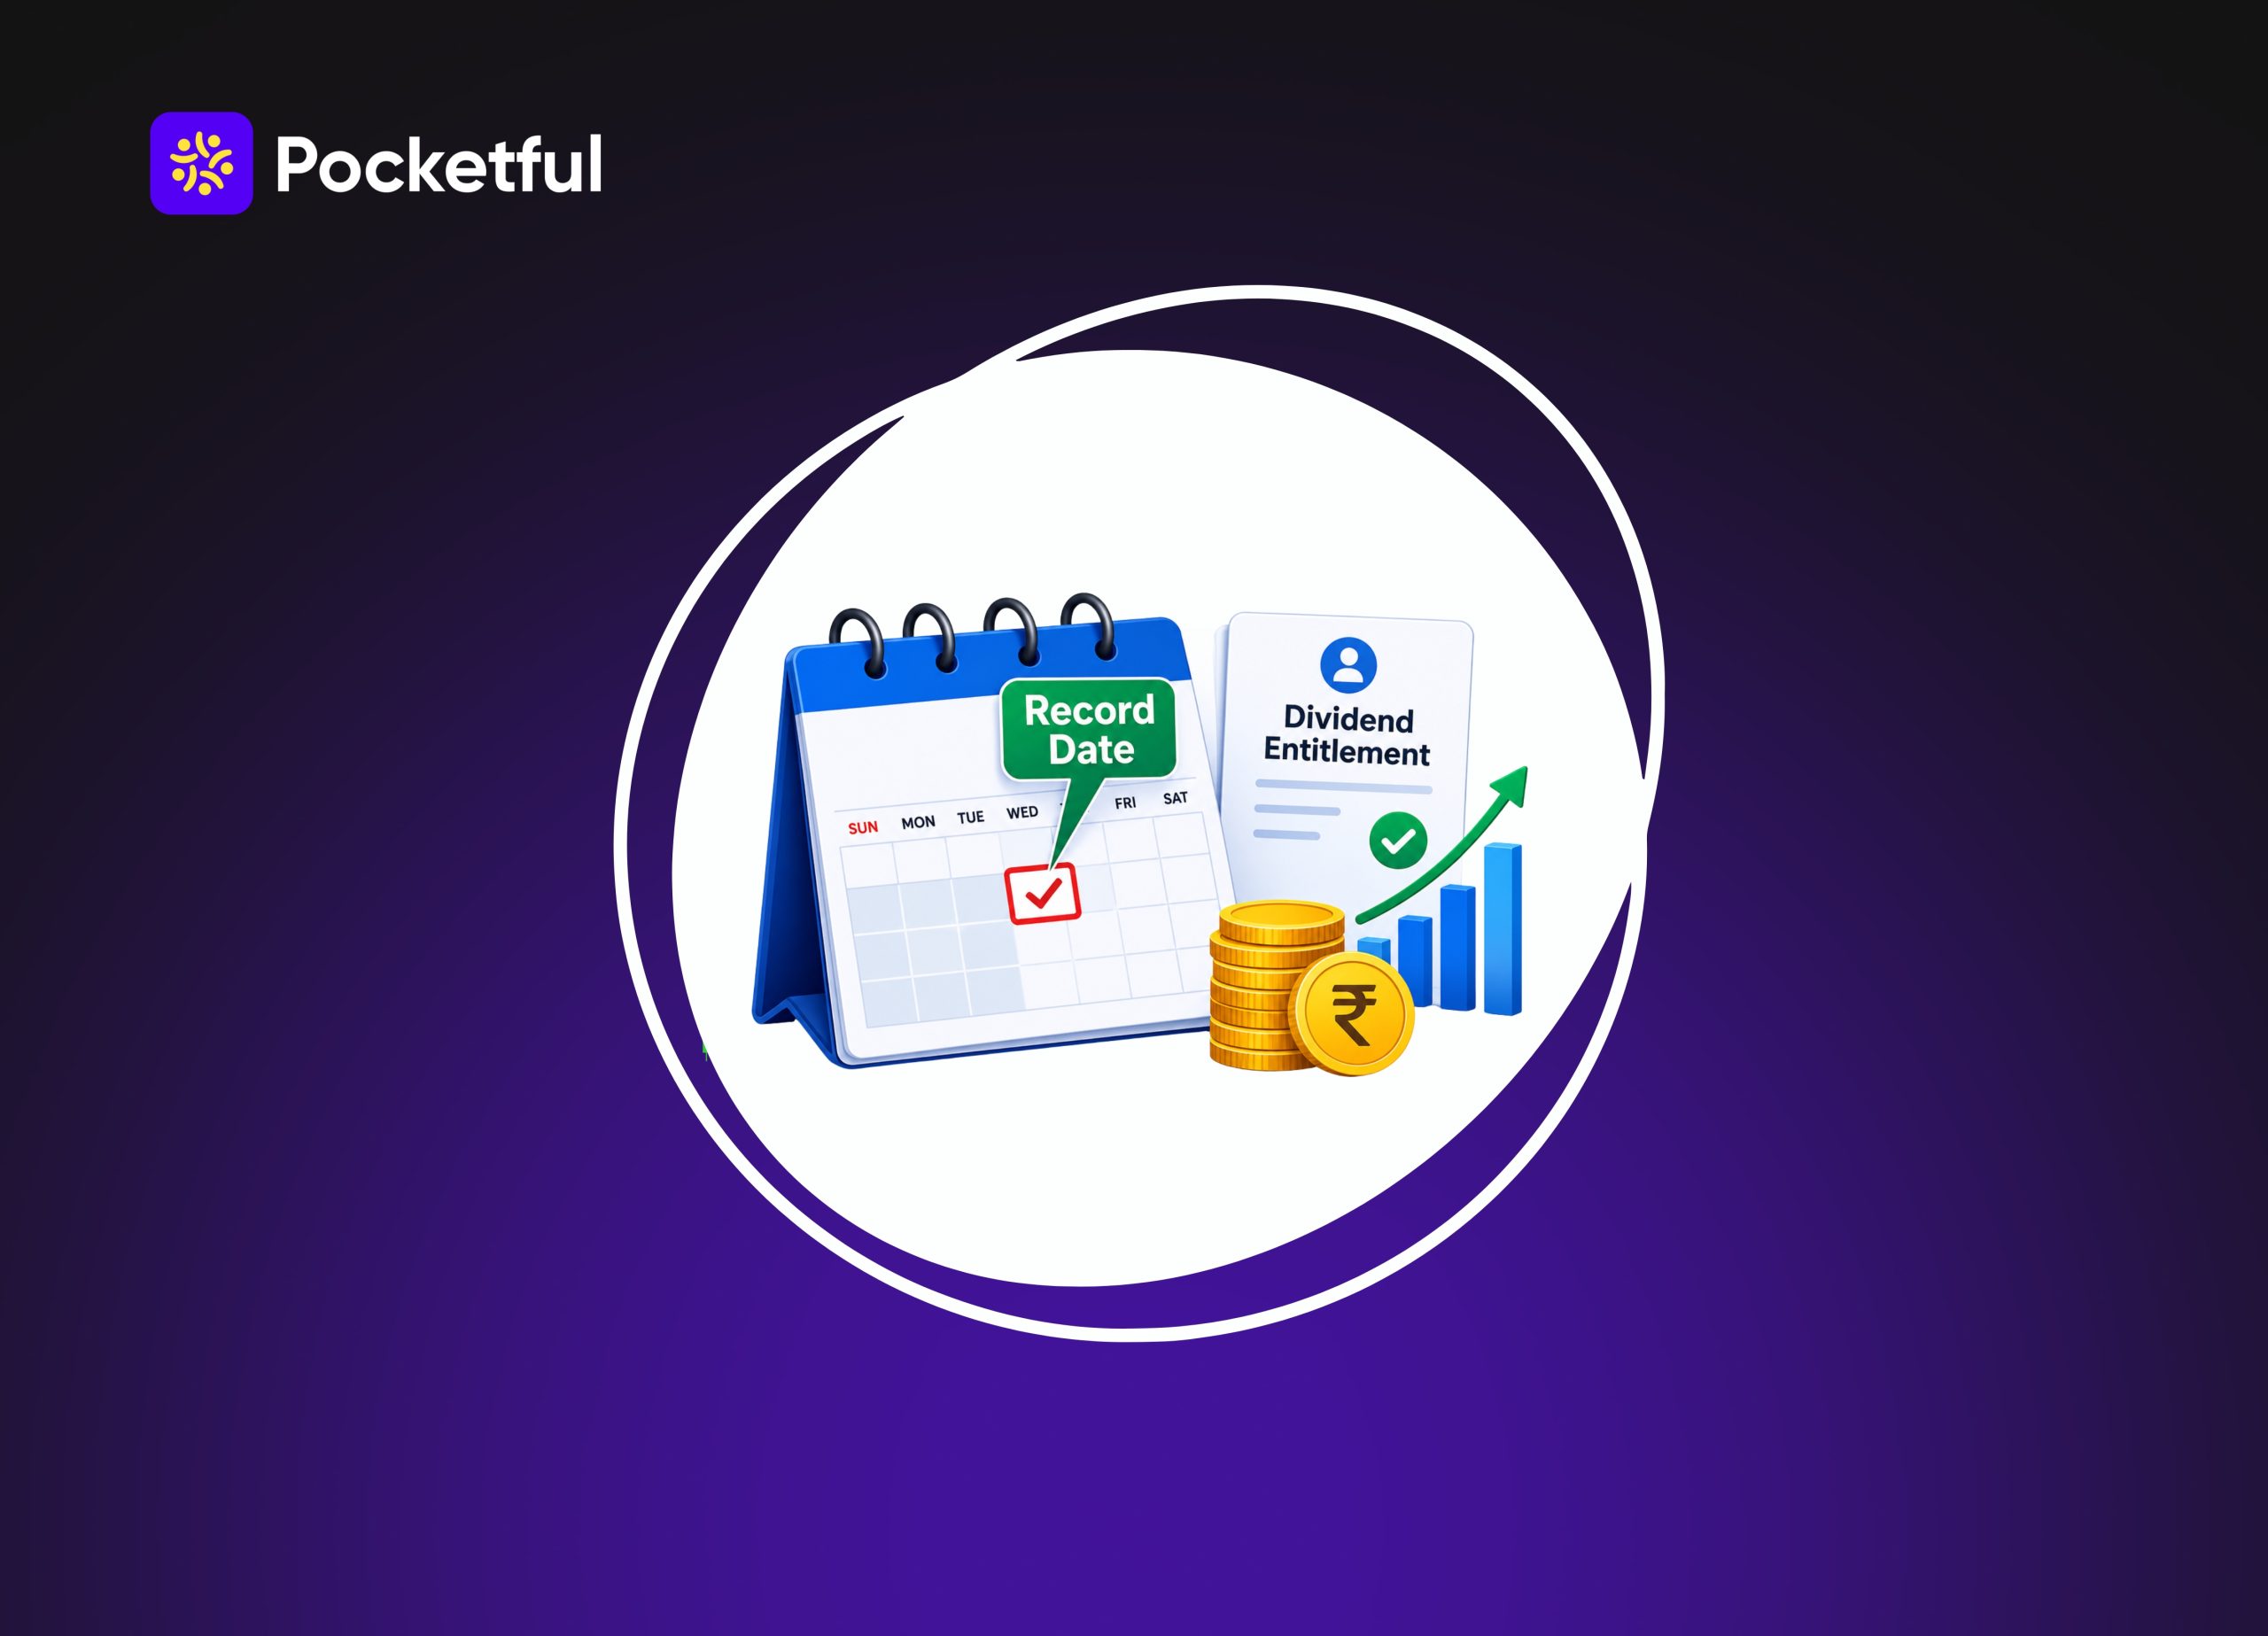
  • What is a Record Date in Stock Market?

    What is a Record Date in Stock Market?

    You may hold a stock for months, but your eligibility for a dividend or bonus shares can depend on one date. The record date in share market determines which shareholders qualify for a corporate action. Missing the relevant buying deadline by even one trading day can mean missing the benefit.

    So, what is record date in share market, and why does it matter? So, let us explore the details here.

    What Is a Record Date?

    A record date is the date fixed by a company to identify shareholders eligible for a specific corporate action. The company checks its shareholder records on this date to determine who should receive the announced benefit.

    In simple terms, if we have to define record date, it is the cut-off date used to determine shareholder eligibility.

    Corporate actions for which a company may announce a record date include:

    • Dividends
    • Bonus shares
    • Stock splits
    • Rights issues
    • Buybacks
    • Mergers or demergers

    The company announces the record date in advance and informs the relevant stock exchanges. Investors can then check the announcement and understand whether their holdings qualify for the corporate action.

    How Does Record Date Work for Corporate Actions?

    The purpose of the record date remains largely the same across corporate actions. It identifies eligible shareholders. However, the benefit you receive depends on the type of corporate action.

    1. Dividends

    When a company declares a dividend, it fixes a record date to identify eligible shareholders. If you are an eligible shareholder, you receive the declared dividend as per the same schedule. 

    2. Bonus Issues

    A bonus issue gives existing shareholders additional shares. The record date determines who qualifies. For example, in a 1:1 bonus issue, the eligible shareholders will get one bonus share for each share they already hold.

    3. Stock Splits

    A stock split divides existing shares into a larger number of shares. But all the shares are now with a lower face value. Now, say a stock has a ₹10 face-value share. It is split into two shares with a face value of ₹5 each. The record date determines which shareholders are eligible for this adjustment.

    4. Rights Issues

    A rights issue allows eligible existing shareholders to apply for additional shares based on a specified ratio and price.

    The company uses the record date to determine which shareholders receive the rights entitlement.

    5. Buybacks

    Companies may also use a record date for buybacks conducted through the tender offer route.

    It helps identify shareholders eligible to participate in the buyback according to its announced terms. For example, NSE corporate-action records show record dates for buybacks as well as dividends and bonus issues.

    Record Date vs Ex-Date

    Record date and ex-date are closely related, but they serve different purposes. Understanding this difference is important when deciding when to purchase a stock.

    ParticularsRecord DateEx-Date
    MeaningDate used to determine eligible shareholdersDate from which the stock trades without the corporate action benefit
    Decided forIdentifying eligible shareholdersDetermining entitlement when shares are traded
    Buying on the dateGenerally too late to qualifyBuyer generally does not qualify
    T+1 impactOften coincides with ex-dateOften coincides with record date

    The ex-date is the first trading day when the share trades without the benefit attached to it. If you purchase shares on or after the ex-date, you generally do not qualify for that corporate action.

    Under India’s T+1 settlement system, the ex-date and record date commonly fall on the same day. However, exceptions can occur because of trading or settlement holidays. Investors should therefore check the dates announced for the specific corporate action rather than assuming they will always match.

    Read Also: Understanding the Equity Trade Life Cycle

    How Does T+1 Settlement Affect the Record Date?

    Under the T+1 settlement cycle, an equity trade is generally settled one business day after the trade date. This settlement period directly affects whether your shares are available in your demat account by the required date.

    For example, suppose the ex-date and record date are Friday.

    • You purchase the shares on Thursday.
    • The transaction settles on Friday.
    • You become eligible for the corporate action.
    • If you purchase on Friday, settlement happens later.
    • You generally do not qualify for the announced benefit.

    This gives investors a simple rule to follow: buy before the ex-date, not on the ex-date.

    Settlement holidays can affect this timeline. If a settlement holiday prevents the shares from being credited by the record date, an earlier purchase may be required.

    Record Date Example

    Consider a company that announces a dividend of ₹10 per share. It fixes Friday as the record date, and Friday is also the ex-date.

    The eligibility would generally look like this:

    Purchase DateExpected SettlementEligible for Dividend?
    WednesdayThursdayYes
    ThursdayFridayYes
    FridayNext settlement dayNo

    If you purchase the shares on Thursday, they generally settle by Friday. Your holding can therefore qualify for the dividend.

    If you purchase on Friday, you have bought the shares on the ex-date and will generally not receive the announced dividend.

    Interestingly, if you already hold eligible shares and sell them on the ex-date, you can generally remain eligible. This is because the shares are debited from your demat account on the following settlement day.

    How to Find a Company’s Record Date

    You should check the record date before buying a stock specifically for an upcoming corporate action. Exchange announcements are useful because they provide the official dates reported for listed companies.

    You can check the record date in share market through:

    • NSE corporate action announcements
    • BSE corporate action announcements
    • The company’s investor relations page
    • Corporate action information provided by your broker
    • Official company announcements

    NSE, for example, provides corporate action information showing details such as the purpose, ex-date and record date for listed securities.

    It is also worth checking the announcement again closer to the date. This helps you account for any revised dates, trading holidays or settlement-related changes.

    Common Mistakes Investors Make With Record Dates

    Knowing the meaning of record date is only one part of the process. Investors also need to understand how buying and settlement affect eligibility.

    1. Buying Shares on the Ex-Date

    This is one of the easiest mistakes to make.

    Buying a share on the ex-date generally does not make you eligible for the corporate action. You should usually purchase it before the ex-date.

    2. Confusing Record Date With Payment Date

    The record date determines who is eligible. The payment date determines when the benefit is paid.

    For a dividend, for example, the money may reach eligible shareholders after the record date. The two dates should not be treated as the same.

    3. Buying Shares Only for the Dividend

    A dividend may look like an opportunity to earn additional money, which is passive in nature and safer too. 

    However, the share price can adjust when a stock begins trading ex-dividend. Taxes and transaction costs can also affect the final return.

    Therefore, a dividend alone should not be treated as a guaranteed short-term profit opportunity.

    4. Assuming Every Corporate Action Has the Same Timeline

    The record date determines eligibility, but the actual credit or payment timeline can differ.

    A dividend may be paid according to one schedule, while bonus shares, rights entitlements or shares following a split may follow another.

    Why Is the Record Date Important for Investors?

    The record date may look like a small detail in a corporate announcement. However, it directly affects whether you qualify for the benefit.

    Understanding it helps you:

    • Check dividend eligibility
    • Know whether you qualify for bonus shares
    • Track stock split eligibility
    • Understand rights issue entitlement
    • Check eligibility for applicable buybacks
    • Plan share purchases around corporate actions

    More importantly, it prevents a common assumption that buying a stock on the record date itself is enough. In most cases, the buying decision needs to be made earlier.

    Read Also: What are T2T (Trade to trade) stocks?

    Record Date and Dividend Taxation

    Receiving a dividend also has tax implications. Dividend income received by shareholders is generally taxable in their hands under applicable Indian income-tax provisions.

    This means buying a stock just to capture a dividend should not be evaluated based only on the dividend amount. You also need to consider the share-price movement, applicable taxes and transaction costs.

    The record date determines eligibility for the dividend, while the applicable tax treatment depends on prevailing tax rules and your individual circumstances.

    What About T+0 Settlement?

    India has also introduced an optional T+0 settlement mechanism alongside the existing settlement system. It allows eligible transactions within the framework to be settled on the same trading day.

    However, investors should not assume that every stock transaction follows T+0.

    For corporate actions, always check the officially announced ex-date and record date. Settlement systems can evolve, but the dates published for the particular security remain important for determining eligibility.

    Conclusion

    A record date determines which shareholders qualify for corporate actions such as dividends, bonus shares, stock splits, rights issues and applicable buybacks. Under the T+1 settlement cycle, you generally need to purchase shares before the ex-date rather than waiting for the record date itself.

    But when you are trading in the stock market, you need a reliable platform by your side. Investing using Pocketful can help you greatly. 

    S.NO.Check Out These Interesting Posts You Might Enjoy!
    1What Is Common Stocks?
    2What is Auction Market?
    3What is MIS in Share Market?
    4What is Pledging of Shares?
    5What is Earnings Per Share (EPS)?

    Frequently Asked Questions (FAQs)

    1. What Is Record Date in Share Market?

      The record date is the date fixed by a company to determine the shareholders who will get the benefits, such as dividends or additional shares.

    2. How Do You Define Record Date in Simple Words?

      To define record date simply, it is the cut-off date on which a company identifies shareholders who are eligible for benefits.

    3. Is the Record Date the Same as the Ex-Date in India?

      Under T+1 settlement, the record date and ex-date commonly fall on the same day. But it can change if there is a holiday.

    4. How Many Days Before the Record Date Should I Buy Shares?

      You generally need to buy the shares before the ex-date. When the ex-date and record date are the same under T+1 settlement, this usually means buying at least one trading day earlier.

    5. What Happens If I Buy Shares on the Record Date?

      If the record date is also the ex-date, buying shares on that day generally means you will not qualify for the announced corporate action.

  • Tax-to-GDP Ratio in India: Formula, Trends & Importance

    Tax-to-GDP Ratio in India: Formula, Trends & Importance

    Have you ever thought about where the government gets money for building roads, running schools, and paying for overall development of the country? It all starts with the money we contribute as taxes. But how do we know if we are contributing enough or not? Here comes the role of Tax-to-GDP ratio.

    Refer to tax-to-GDP as a measure to know how much tax is being collected in comparison to the total size of the economy also known as GDP. This can be imagined as a scoreboard where you can see what portion of the collected wealth is being directed to public welfare. To calculate this the formula is very simple, you need to divide the total tax revenue by the total GDP of the country. A high ratio depicts that the government is spending more money on developmental activities, while a lower ratio gives us an idea that most of the economy is not being taxed. In India’s tax system the ratio helps us in understanding the fiscal health of the country. 

    What Is the Tax-To-GDP Ratio?

    India’s tax-to-GDP ratio measures the amount of tax revenue collected by the government as a percentage of the country’s total economic output, or GDP. It is an important indicator of the government’s ability to generate tax revenue relative to the size of the economy. 

    Tax-to-GDP Ratio = (Total Tax Revenue ÷ GDP) × 100 

    Financial YearTax-to-GDP Ratio (%)
    2016–1711.1%
    2017–1811.2%
    2018–1911.0%
    2019–2010.0%
    2020–2110.2%
    2021–2211.5%
    2022–2311.3%
    2023–2411.7%
    2024–25 (Revised Estimates)11.9%
    2025–26 (Budget Estimates)12.0%

    India’s Tax-To-GDP Ratio at a Glance

    For a period of time India’s tax collection has moved between a specific range. The Indian tax-to-GDP ratio has stayed between 11% and 12%. 

    • Changes Over Time: There has been very little change because of the economic cycles and policy changes, as it has relatively stayed stable during the last decade. 
    • Direct vs. Indirect Taxes: The Indian taxation system has two pillars in it direct and indirect taxes. Direct taxes are paid directly by the individual and companies to the government (like income tax and corporate tax) and Indirect taxes are collected via goods and services (like GST).
    • Centre vs. State: The central government and state governments have direct powers to levy taxes on the citizens. The total tax-to-GDP ratio is the combination of both the authorities. 

    The journey of India’s tax collection has been quite interesting over the decades.

    • Before 1991: Tax collections were often low, and the system was very rigid.
    • After 1991 Reforms: The economy opened up, leading to better growth and more revenue.
    • The 2000s: This decade saw steady improvements as technology began to enter the tax department.
    • Impact of GST: The introduction of the Goods and Services Tax was a massive change. It helped bring many businesses into the formal tax net.
    • Post-Pandemic: After a dip during the pandemic, tax collections have shown a strong recovery, helping the ratio climb back toward the 12% mark.

    Key Factors Influencing India’s Tax-To-GDP Ratio

    Several things decide how much tax flows into the government’s coffers. The main drivers are: 

    • Economic Growth: With growing GDP grows the income of the businesses and people also earn more that results in higher tax collection. 
    • Rising Taxpayer Base: When more people and companies file returns it means there is a huge base for tax collection.
    • Corporate and Personal Income: As incomes rise, tax contributions from salaries and business profits naturally go up.
    • GST and Indirect Taxes: Efficient collection of consumption taxes plays a major role in the overall tax-to-GDP ratio.
    • Digitalisation: With rising use of tech it has become easier for the public to pay taxes and easier for governments to track. 
    • Government Policies: Changes in tax policies and new reforms incorporated by the government have a direct effect on tax collection. 
    • Inflation: With rising prices the direct tax collection increases, although the purchasing power gets impacted. 

    Direct Taxes and Their Role in India’s Tax-To-GDP Ratio

    Direct taxes are a sign of a maturing economy. As more people join the formal workforce, the government sees better results here.

    • Personal Income Tax: There is a rising number of people that are falling under the tax bracket, ultimately increasing the collection. 
    • Corporate Income Tax: Tax collected from companies helps the government to maintain a healthy tax-to-GDP ratio. 
    • Formalisation: With rising entrepreneurship and new businesses getting registered the informal sector is moving towards being formal. All this helps in tracking their income and levying taxes correctly. 

    Role of GST in India’s Tax-To-GDP Ratio

    GST has brought a change in how India deals with indirect taxes. Before the introduction of GST there were multiple taxes that were imposed differently in every state, making it confusing. GST brought everything under one roof.  

    • Simplified System: It has become easier for businesses to pay taxes along with easy compliance.
    • GST Collections: GST has turned out to be a reliable source for the government’s revenue source. 
    • E-Invoicing: Tax evasion has seen a decline due to this digital step.
    • Challenges: Different slabs, rates need to be simplified a little so that it can become easier for every person to understand. 

    India’s Tax-To-GDP Ratio Compared With Other Countries

    Looking at the global economies we witness so many interesting differences. 

    • Developed Economies: Most of the developed economies have a much higher ratio that may exceed up to 30-40%. 
    • Emerging Markets: Indian economy is emerging and is now being compared with the development of emerging nations across the world. 
    • Why the Difference? The main difference is due to the huge size of India’s informal economy which leads to less number of people falling under the taxable income slab.
    • What Can We Learn? Other economies say that widening the tax base is much better than increasing the tax rates. 

    Read Also: What is Angel Tax?

    Why Does India Have a Relatively Low Tax-To-GDP Ratio?

    India’s ratio is lower than many rich countries for several logical reasons:

    • Large Informal Economy: Many people work in small shops or as daily wage earners without proper records.
    • Limited Direct-Tax Base: A large portion of our population earns below the income tax threshold.
    • Income Distribution: When a large part of the wealth is held by a few, it limits the total potential for income tax.
    • Compliance Challenges: It takes time to build a system where everyone finds it easy and natural to pay taxes.
    • Exemptions: Agriculture and certain other sectors have tax exemptions to support them.
    • Regional Differences: There is a significant difference between tax collection in urban centers and rural areas. 

    Government Initiatives to Improve Tax Collection

    The government is taking many steps to boost India’s tax revenue.

    • GST Implementation: Creating a unified national market for goods and services.
    • Digitalisation: The possibility of human error and dependence on manual work is reduced. 
    • PAN-Aadhaar Integration: By linking them helps in tracking the earned money and the expenses done. 
    • E-Filing and Faceless Assessments: Returns can now be easily filed from home and assessments can be done digitally. 
    • Data Analytics: This helps in using smart tech so that patterns can be easily spotted and look for tax evasion. 
    • Compliance Measures: This helps in easier registration and paying taxes so that more people can participate in it. 

    What Does a Rising Tax-To-GDP Ratio Mean for India?

    A steady rise in this ratio is generally a good sign for the nation.

    • More Revenue: With increased tax collection the government gets money to spend on nations’ development. 
    • Infrastructure Spending: More funds can give better infrastructure to the country. 
    • Fiscal Position: It helps the government manage its debt better.
    • Lower Fiscal Deficit: Lowers down the government’s requirement to borrow money from the market.
    • Public Services: The government can put more money in public welfare like hospitals, schools and social welfare schemes.  
    • Economic Development: Helps the economies in growing at a faster rate. 

    Is a Higher Tax-To-GDP Ratio Always Better?

    It is not always better, rather it requires a balance. 

    • Growth First: If taxes are too high, they can hurt business growth and consumer spending.
    • Efficiency Matters: It is better to collect taxes efficiently from a wide base rather than just increasing rates on a few.
    • Fairness: The goal should be to have a system where the burden is shared fairly, without discouraging people from working or starting businesses.

    Future Outlook for India’s Tax-To-GDP Ratio

    The future looks promising as India continues to evolve.

    • Formalisation: More small businesses are moving into the formal sector every year.
    • Digital Transactions: As we use more UPI and digital payments, the economy becomes more transparent.
    • Middle-Class Growth: As the middle class grows, the number of people in the tax bracket will naturally increase.
    • Long-Term Growth: With better tech and simpler policies, we expect the ratio to improve steadily over the coming years.

    Read Also: Types Of Taxes In India: Direct Tax And Indirect Tax

    Conclusion

    The tax-to-GDP ratio acts as a health checkup for the economy. In the Indian context, we get to know about the transforming of the cash rich informal sector to a formal and digital economy. India has shown good progress in the previous decade but there is still possibility to improve. With introduction of better compliance, usage of tech and making sure the tax system is simple to understand for the general public can lead India to give a stronger financial future for all citizens. 

    For more market news and insights, download Pocketful – offering users zero brokerage on delivery trades and an easy to use platform designed for both beginners and experienced investors. 

    S.NO.Check Out These Interesting Posts You Might Enjoy!
    1Tax Implications of Holding Securities in a Demat Account
    2Mastering Your Finances: Beginner’s Guide To Tax Savings
    3What Is The Difference Between TDS and TCS?
    4What is Non-Tax Revenue – Sources and Components
    5Top 10 Tax Saving Instruments in India
    6Old Regime Vs New Tax Regime: Which Is Right For You?
    7Why Do We Pay Taxes to the Government?
    8What is Capital Gains Tax in India?
    9Inheritance Tax: Past, Progression, And Controversy

    Frequently Asked Questions (FAQs)

    1. Explain tax-to-GDP in simple terms. 

      It helps in measuring the total amount of tax collected by a country in comparison with the total value of goods and services produced within the political frontiers of the country.

    2. Is tax-to-GDP an important ratio for the Indian economy? 

      It highlights the government’s ability to spend on public services like health, infrastructure and education.

    3. Does a higher tax-to-GDP ratio indicate better economic health? 

      A higher tax-to-GDP indicates better tax collection by the government and a stronger formal economy thus showing better economic health.

    4. Why do developed countries have a higher tax-to-GDP ratio in comparison to India? 

      India has a large population that is engaged in the informal sector that leads to lower numbers of people under the direct tax slab along with this there are additional tax exemptions for the people.

    5. What are the initiatives taken by the Indian government to improve the tax collection?

      With the advancement of technology the tax process has become easier and simpler for people. Initiatives like PAN-Aadhaar integration, introduction of GST and stronger enforcement of tax collection has helped in increasing the number of people paying taxes.

  • Slippage in Trading: Meaning, Types, Causes & How to Reduce It

    Slippage in Trading: Meaning, Types, Causes & How to Reduce It

    Suppose you are trading, you place an order at one price, and to your surprise, it got executed at something completely different?

    Slippage is one of those things that eats into your profits without you even realising it half the time. New traders do not realise this much, but once you start trading in volume or in fast-moving markets, it becomes something you simply cannot ignore. 

    So let us break it down properly, in an easy and simple way. 

    What is Slippage?

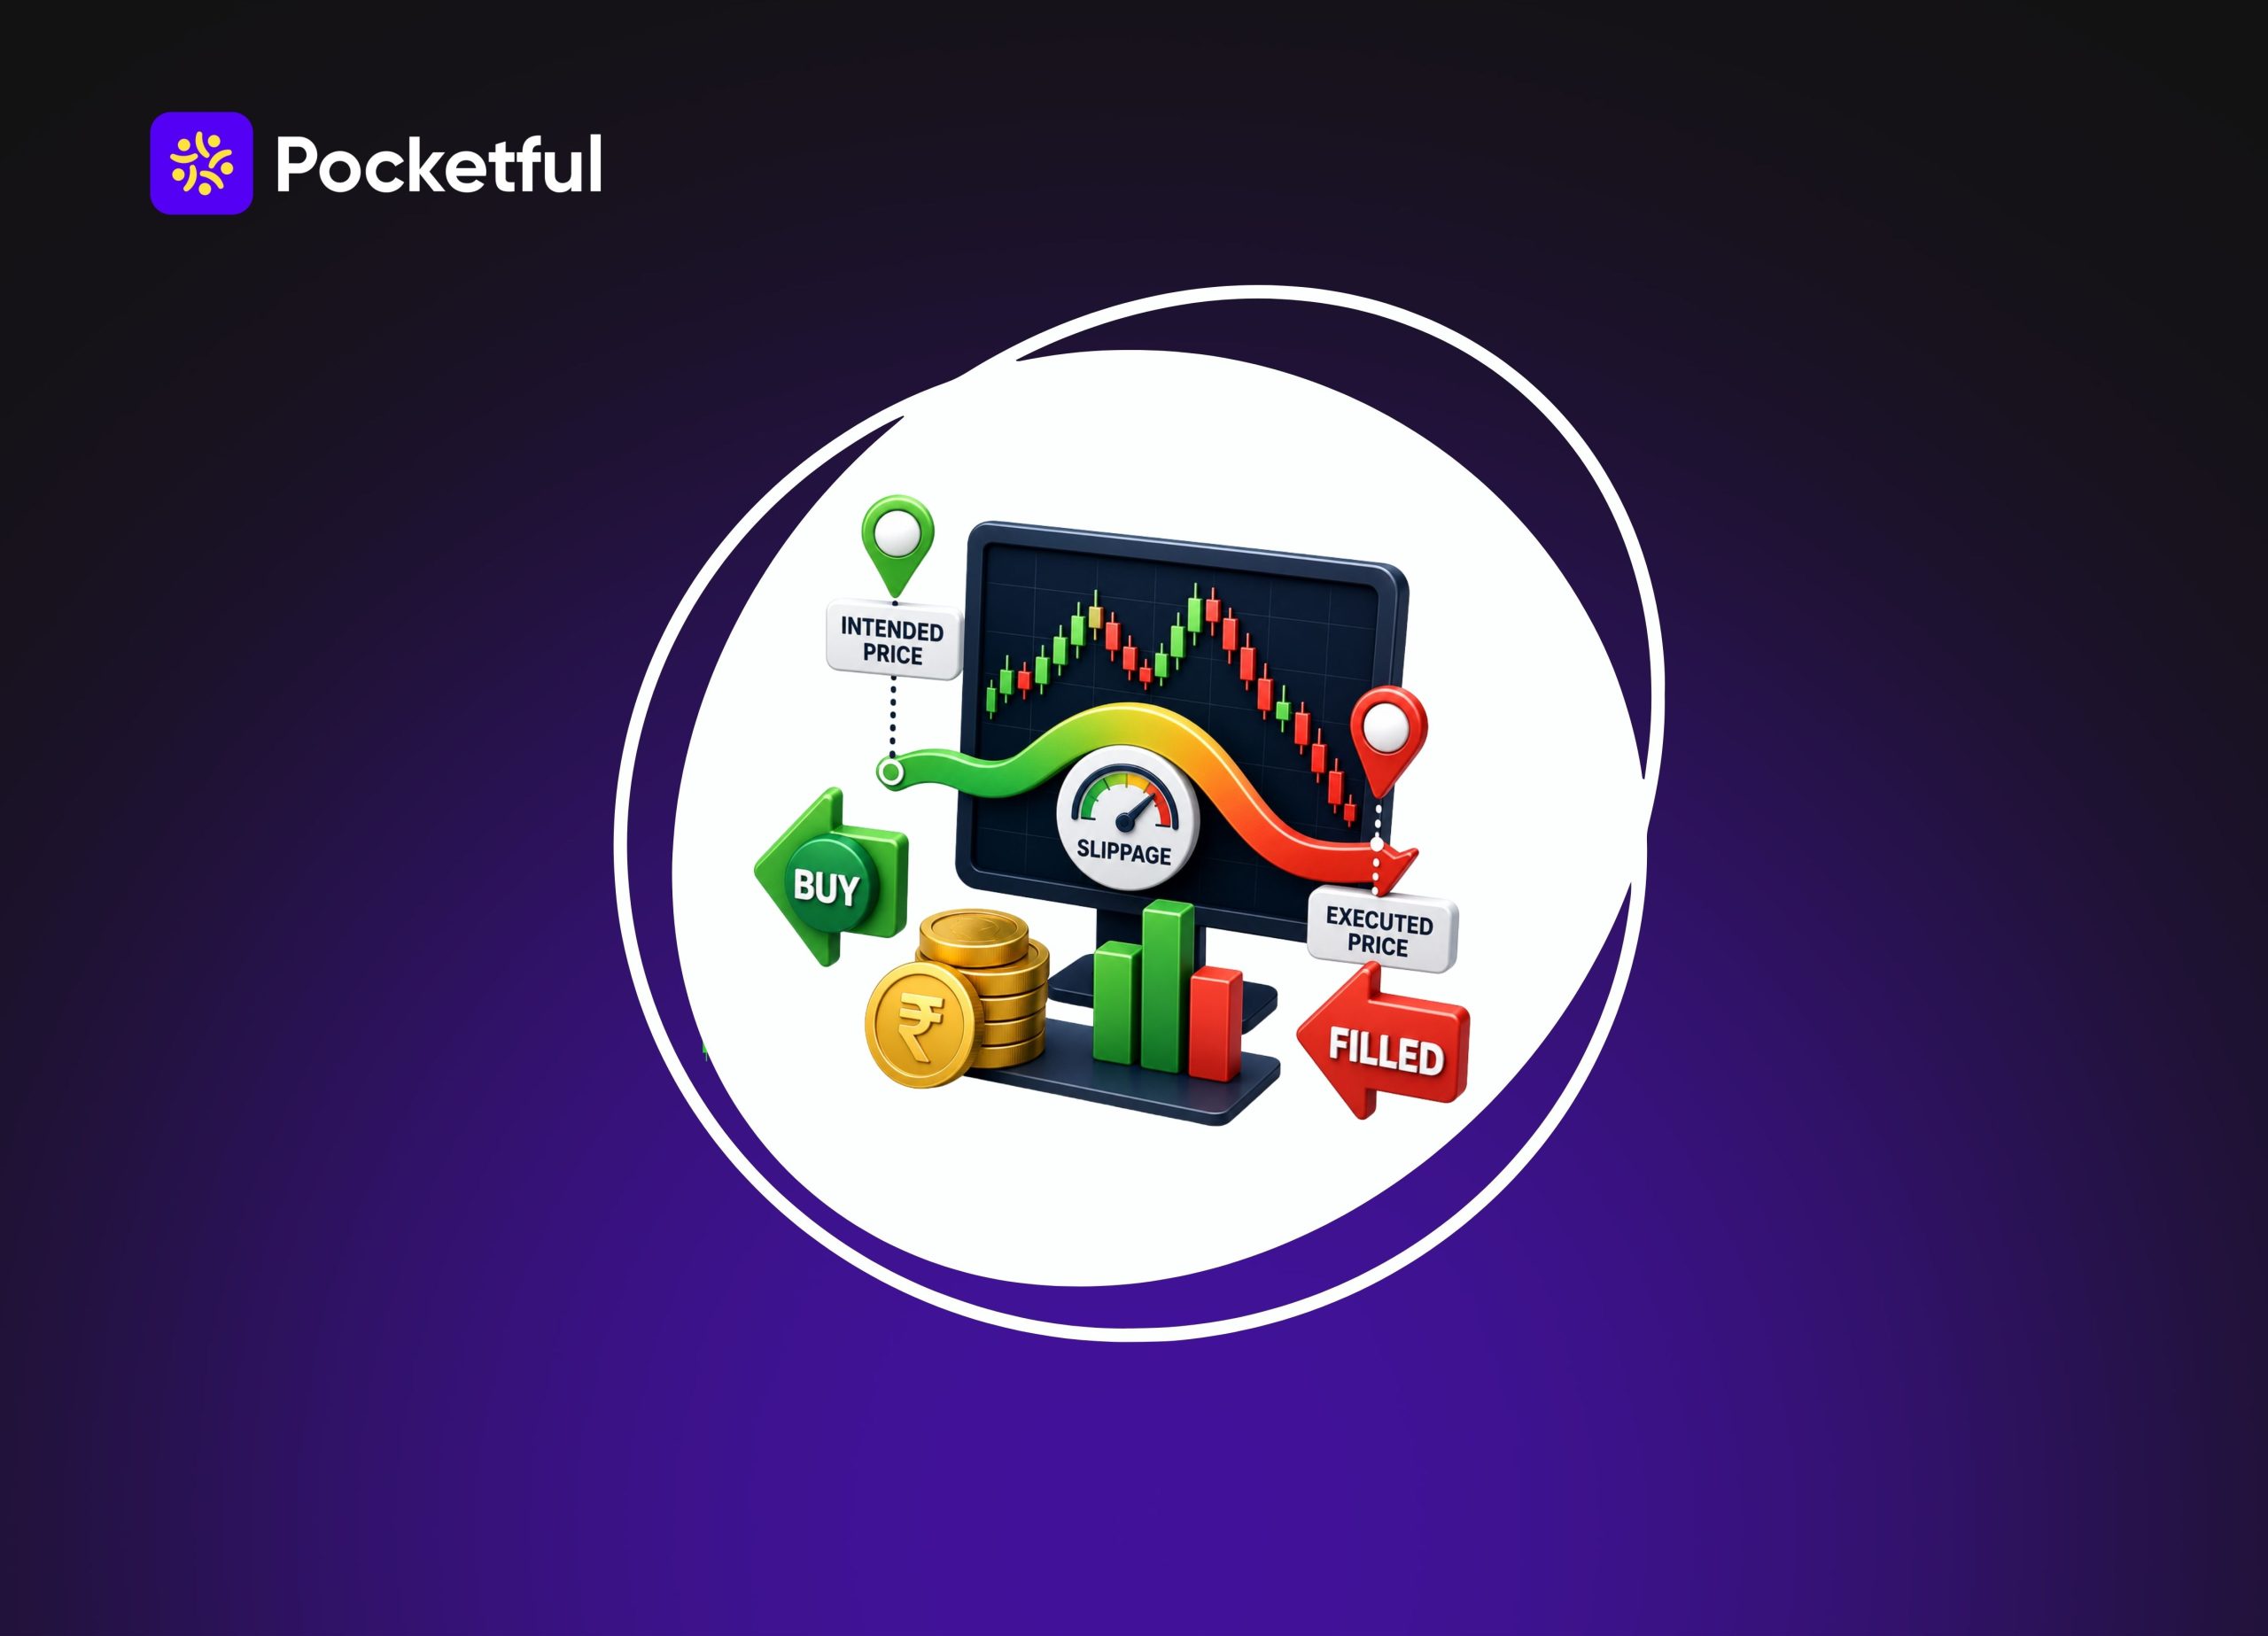
    Slippage meaning in trading is the difference between the price at which you expected your order to execute and the price at which it got executed. Slippage can work both ways. Sometimes it goes against you (negative slippage), and sometimes, by luck, it works in your favour (positive slippage). Identifying slippage can help traders make better decisions about order types and manage trading costs more effectively. 

    Positive Slippage vs. Negative Slippage 

    1. Positive Slippage

    It happens when your order executes at a better price than what you expected. If you place a buy order at Rs 100 and it executes at Rs 98, that is positive slippage working in your favour. Similarly, a sell order placed at Rs 100 that executes at Rs 102 is also a positive slippage.

    2. Negative Slippage

    It is the opposite. A buy order placed at Rs 100 that executes at Rs 103, or a sell order at Rs 100 that fills at Rs 97, both represent negative slippage. This is the one that eats into your profits or adds to your losses

    Example: 

    Suppose you buy 1,000 shares of a stock at an expected price of ₹200. You are targeting a ₹5 move and expect to make ₹5,000. But because of volatility, your actual execution happens at ₹201.50. You have already lost ₹1,500 in profit because of slippage.

    Now imagine you make 10-15 such trades every day. Even small differences in execution price can add up quickly. This is why professional traders do not just look at whether their strategy is profitable on paper; they also pay attention to execution costs.

    Why does Slippage Happen?

    1. Market Volatility

    When there is sudden news, say an RBI policy announcement or a company’s quarterly results, prices can move within seconds. Your order might be in the queue for even half a second, and in that time the price has already moved.

    2. Liquidity

    Stocks that do not get traded or are traded with less volume, like mid-cap or small-cap are more prone to slippage. If the buyers and sellers in a stock are few, then chances are likely that large orders matching may cause more movements. 

    Compare this to something like Reliance or HDFC Bank, where liquidity is good and slippage is usually minimal.

    3. Order Size

    Order size also plays a role. If you are placing a large order, it might not get filled at a single price point. Instead, it gets executed in parts, and the average of those becomes your final execution price.

    4. Type of Order

    Market orders are far more susceptible to slippage than limit orders, simply because a market order says “execute me at whatever the current price is,” while a limit order says “only execute me at this price or better.” 

    Read Also: What Is Cash Trading? Meaning, How It Works & Benefits

    How much Slippage is Acceptable?

    There is no predetermined acceptable amount of slippage as this can vary based on the trade and the trading approach. When you are investing for a longer period, a few paise or a rupee change may not matter that much.

    However, for an intraday trader or a scalper, even a slight amount of slippage can become a problem. Let us say you wanted to make ₹2-₹3 per trade, and you ended up losing ₹0.50 due to slippage. In this case, you are already losing a chunk of the profit you were expecting to make.

    To understand slippage meaning, you must take into account your trade size, liquidity, volatility, and estimated profit margin per trade. When slippage continues to eat into your profits, you need to once again analyse the stock, order size or order type that you are using.

    Therefore, do not search for a single acceptable slippage figure; rather, ask yourself, Will this small slippage still be a reasonable fit for my trading strategy?

    How to Reduce Price Slippage?

    1. Limit Orders

    Switching to limit orders instead of market orders is probably the single most effective step. Sometimes your limit order might not get filled at all if the price moves away too fast. But at least you are in control of the price you are willing to accept.

    2. Do not start trading as soon as the market opens

    Avoiding trades during the first and last fifteen minutes of the trading session also helps a lot. These windows tend to be the most volatile, partly because of overnight news getting priced in at the open, and partly because of squaring-off activity near the close.

    3. Trade Liquid Stocks Only

    Sticking to liquid stocks can also fix your concern about slippage. You will usually find high-volume Nifty, Bank Nifty, and large-cap stocks and thus lesser slippage compared to illiquid small-caps or far-out-of-the-money options that barely trade.

    4. Breaking up large orders 

    Breaking up large orders into smaller chunks is also a trick. Instead of placing one huge order that moves the price against you, splitting it into smaller pieces can help you get a better average execution price.

    5. Pay Extra Attention 

    Being extra cautious around major news events and earnings announcements goes a long way. If you know a company is announcing results at 4 PM, or the RBI is making a policy statement, it’s often wiser to avoid placing market orders in such cases. 

    6. Slippage vs. Bid & Ask Spread

    People often mix these two up, but they are different if you look closely.

    The bid-ask spread is something you can see on your screen before you hit buy or sell. It is just the gap between the highest price that a buyer is offering and the lowest price a seller is asking for. 

    Slippage works the opposite way and is only known after your order executes, and it results from the market moving between the time you place the order and the time it gets executed.

    So if you had to put it simply: the spread is the entry fee for stepping into the market, while slippage is more like bad timing or placing a large order at the wrong moment.

    How Slippage Affects Profit & Loss

    For long-term investors, slippage hardly matters. A few rupees of difference in your entry price should not worry you when your investment horizon runs into years.

    It is a different story for intraday traders, options buyers, and people who trade on margins. When you are targeting a small, specific move in price, slippage can turn what should have been a profitable trade into a loss-making one, or reduce your gains more than expected. Traders who place a high number of trades in a day feel this effect cumulatively.

    As far as risk management is concerned, your stop-loss and target levels are usually calculated based on your expected entry price. If slippage shifts your entry away from what it initially was, your entire risk-reward calculation for the trade shifts along with it, sometimes without you even realising it in the moment.

    Read Also: What is Quoted Price in Commodity Trading?

    Conclusion 

    Slippage is not something to be scared of, but it is definitely something worth understanding properly, especially if you are active in intraday or F&O trading. It is simply a natural part of how markets function. The traders who do well over time are not the ones who avoid slippage entirely, because nobody can. They are the ones who understand when and why it happens, and adjust their order types, timing, and stock selection accordingly. So the next time your order executes at a different price than expected, you will know the exact reason.

    S.NO.Check Out These Interesting Posts You Might Enjoy!
    1What is the Best Time Frame for Swing Trading?
    2MCX Trading: What is it? MCX Meaning, Features & More
    3What is Pair Trading?
    4What is Speculation in Trading
    5What is Spread Trading?

    Frequently Asked Questions (FAQs)

    1. Can we avoid slippage?

      No, we cannot avoid slippage, but traders can reduce it by using the right order types and trading liquid securities.

    2. In which order type does more slippage happen?

      Market orders are usually more prone to slippage. 

    3. Does slippage happen in options trading? 

      Yes, slippage can exist in less-liquid options, especially those with low volumes.

    4. What effect does slippage have on long-term investors?

      The impact of slippage on long-term investors is usually smaller. 

    5. Why is slippage higher during volatile markets?

      It is high because prices can change quickly even before an order gets executed. 

  • Turnaround Stocks: Meaning, Features, Risks & How to Identify

    Turnaround Stocks: Meaning, Features, Risks & How to Identify

    Turnaround stocks are shares of companies that went through a genuine rough patch, weak earnings, falling revenue, and a beaten-down price, and are now showing real signs of recovery. These companies may not be weak in terms of the fundamental base. They have the potential to rebuild and recover over time, which is why investors usually consider them.

    So, if you are an investor who is looking for an answer, then read this guide. Understand what turnaround stocks are and know what makes them unique in nature. 

    Turnaround Stocks Definition

    A turnaround stock is a company that suffered a period of poor financial performance, often losses or shrinking margins, and is now working through a deliberate recovery plan. The stock price usually reflects the bad years. 

    You will be able to notice that these were trading well below what the business could be worth once the recovery actually plays out. The opportunity lies in that gap, which is buying before the market reprices the stock and improves the fundamental value.

    Not every beaten-down stock qualifies. A company stuck in permanent decline, losing market share to better competitors with no real plan to fix it, is not a turnaround candidate. It’s just a weak business. The difference lies in whether the company has identified its problems and is actively addressing them.

    Why Do Companies End Up Needing a Turnaround?

    There are many reasons why a company might need this turnaround, but some of the key reasons that you should actually consider analysing are as follows:

    • Rising input costs: A weaker rupee or a spike in raw material prices can hit import-dependent companies hard. This can lead to lower margins and cost impacts, which will stay until prices are set back.
    • Poor capital allocation: Overexpansion, bad acquisitions, or excess debt are some of the reasons that will impact the company badly. It can take over the good years and will need time to recover.
    • Industry-wide disruption: New competitors or changing consumer behavior can have a great impact. It will take time to be in balance again. 
    • Management missteps: Sometimes the business itself is fine, but leadership makes poor calls on pricing, expansion, or product direction. This is where a change at the top becomes the actual fix.

    Key Characteristics of Turnaround Stocks

    Genuine turnaround candidates tend to show a specific set of changes rather than being focused on the points that are not meaningful. Some of the key points that you should know here are as follows:

    1. Management Change

    A new leadership team is one of the clearest early signals. It’s far easier for an incoming CEO or CFO to admit past mistakes and reverse bad strategy than for the same team that caused the problems to fix them. Watch for management commentary in quarterly earnings calls, specifically whether they name the actual problem and lay out a concrete plan, not vague promises about “improving performance.”

    2. Business Strategy Reset

    A real turnaround usually comes with a defined strategy shift. It can be exiting unprofitable segments, renegotiating supplier contracts, repricing products, or refocusing on the core business. The idea is to actually look for the segment that made money in the first place. By simply focusing on this, the company can actually recover with time.

    3. Debt Reduction and Cash Flow Discipline

    Selling non-core assets, cutting unnecessary costs, and pushing harder on collections are common moves once new management takes over. The goal is straightforward: improve operating cash flow, pay down debt, and free up capital to reinvest in the business that’s actually working. A shrinking debt-to-equity ratio over consecutive quarters is one of the more reliable signs that this is happening.

    4. Valuation Reset

    Turnaround stocks typically trade at low PE and PB ratios relative to their sector, since the market is still pricing in the company’s recent weak performance. This is exactly the gap turnaround investors are betting on. But context matters here. A low PE can also mean earnings are extremely poor. Also, a low or negative PB can mean liabilities exceed assets entirely, both signs of a company in real trouble rather than a genuine turnaround setup.

    Read Also: Risk Management In Trading

    How to Identify a Genuine Turnaround Candidate

    A falling stock price alone tells you almost nothing. A few checks separate a real opportunity from a value trap.

    • Check for consecutive quarters of improvement and see where you are able to see consistency.
    • Read the management commentary closely and look for the specific signs that can help you understand the market well. 
    • Track the debt trend, since a company still piling on debt is not turning around, regardless of what management says.
    • Compare against sector peers, since a stock can look cheap in isolation but still be expensive relative to healthier competitors.
    • Watch promoter and institutional holding changes, since insiders buying more shares during the recovery phase is a meaningful signal.

    Turnaround Stocks vs Value Stocks

    These are two different stocks, but people get confused. So, here is a simple differentiation that you should know:

    FeatureTurnaround StocksValue Stocks
    DefinitionCompanies recovering from financial difficultiesCompanies trading below their estimated value
    Financial ConditionWeak but improvingFundamentally strong and undervalued
    Growth PotentialDepends on a successful recoveryDepends on the market recognising the stock’s value
    RiskHighModerate
    Investment StrategyInvest during the recovery phaseInvest when the stock appears undervalued
    Time HorizonMedium to long termLong term

    Risks of Investing in Turnaround Stocks

    When you invest in turnaround stocks, there are some risks that you should keep in mind. These are:

    • Recovery may fail: A company may not achieve the expected financial recovery as expected. So, a deeper analysis is important.
    • High debt levels: Excessive debt can continue to affect profitability. This will limit the profit-making capacity. 
    • Difficult entry timing: Buying too early or too late is wrong and can impact the profit you can generate.
    • Value traps: A low-priced stock does not automatically mean it is a turnaround opportunity. It can be undervalued, so proper analysis is important.

    A Practical Approach to Evaluating One

    Before investing in a turnaround stock, consider these factors:

    • Review quarterly results: Before investing, check for 4-6 months of data. This would be helpful in proper analysis. 
    • Assess management performance: Check the results and see if the management delivered what it promised previously. 
    • Compare with competitors: Start with the analysis of the company and its competitors. See how they sit in the entire sector.
    • Monitor financial trends: You must check the cash flows and revenues. The focus on debt and liabilities is important as well. 
    • Invest cautiously: Turnaround stocks carry a higher risk. This means you should not invest a lot, but try to balance the portfolio.

    Sectors Where Turnarounds Show Up Most Often

    Some sectors see turnaround stories more frequently than others, simply because of how their business cycles work.

    1. Banking and NBFCs

    A spike in bad loans can hammer a lender’s stock for years, and a genuine turnaround usually shows up as shrinking non-performing assets alongside improving provisioning coverage, quarter after quarter.

    2. Metals and commodities

    These businesses are naturally cyclical. When you look at a company that was broken during a commodity downturn, you can see a completely different situation once prices recover and cost discipline from the tough years sticks around.

    3. Aviation and capital-intensive industries

    High fixed costs mean these businesses swing hard between profit and loss. This will depend on fuel prices, demand, and competition. This can create frequent turnaround setups when a weak player restructures its cost base.

    4. Pharma and manufacturing facing regulatory issues

    A company that resolves a regulatory problem, like a manufacturing facility clearing a compliance issue, can see a sharp re-rating once the overhang lifts, even if the core business barely changes.

    None of this means every stock in these sectors is a turnaround candidate. It just means the pattern shows up more often here than in steadier, less cyclical businesses.

    Read Also: What is Price Action Trading & Price Action Strategy?

    Conclusion

    Turnaround stocks reward investors who do the work, like reading past the headline price drop, checking whether the fundamentals are actually improving, and being honest about how much risk they’re taking on. The characteristics are consistent across most genuine turnaround stories: a management change, a defined strategy shift, improved cash flow, and a valuation still lagging the recovery. If you miss any one of these, you’re likely looking at a value trap wearing a turnaround story’s clothes. 

    Pocketful’s screener lets you filter stocks by debt trend, margin improvement, and valuation metrics directly, making it easier to separate genuine turnaround candidates from stocks that just look cheap.

    S.NO.Check Out These Interesting Posts You Might Enjoy!
    1What is Insider Trading?
    2What is Options Trading?
    3What Is Day Trading and How to Start With It?
    4What is Quantitative Trading?
    5How to Trade in the Commodity Market?

    Frequently Asked Questions (FAQs)

    1. What is the difference between a turnaround stock and a penny stock? 

      A turnaround stock is a company recovering from a specific period of weak performance, regardless of its price level. A penny stock refers purely to a low share price, often under ₹10, and doesn’t necessarily involve any recovery story at all.

    2. How long does a typical stock turnaround take? 

      There’s no fixed timeline. Some companies show measurable improvement within two to three quarters. But then there are companies that might take a year to recover.

    3. Are turnaround stocks safe for beginner investors? 

      Not particularly. They carry a higher risk than established, financially stable companies since the recovery isn’t guaranteed. Beginners should size these positions small, then work around to come to the right point.

    4. What financial ratios matter most when evaluating a turnaround stock? 

      Debt-to-equity trend, operating cash flow, and PE or PB ratios are some of the key factors to consider. These can show the company’s finances and can help you judge the performance better.

    5. Can a turnaround stock fail even with a strong strategy? 

      Yes. Execution risk, industry headwinds, and excessive debt can all derail a well-planned turnaround. This is why tracking actual quarterly results matters more than trusting management’s stated intentions alone.

  • Types of Stock Market Orders Explained

    Types of Stock Market Orders Explained

    If you have just started trading in the Indian stock market, chances are you have clicked buy or sell without thinking about how that order gets executed. 

    As a beginner, once you start trading frequently, understanding the different types of orders in the stock market becomes important. Otherwise, your trade will slip away in seconds. If you are placing an order, the order type you pick decides how, when, and at what price your transaction goes through.

    Let us break this down properly in today’s blog.

    Why do we need Types of Order?

    The movement in the Indian stock market is high. Prices can shift by a rupee or two within seconds, especially for volatile stocks or during results season. 

    A well-chosen order type protects you from bad fills, helps you lock in profits, and can even save you from panic-selling at the worst possible moment.

    Indian brokers today, like Zerodha, Groww, Upstox, and Pocketful, all offer similar types of order in the stock market on their trading apps. 

    The names might look slightly different in the UI, but the core mechanics remain the same. So once you understand these basics, you can apply them anywhere.

    Types of Orders in the Stock Market

    1. Market Order 

    This is the very commonly used order type, especially by beginners. It tells your broker: “Buy or sell this stock right now, at whatever price is currently available.”

    Your order gets executed almost instantly because you do not wait for a specific price; instead, you accept the best available one. This works great for highly liquid stocks.

    However, for stocks with low trading volume, market orders can lead to slippage, i.e., you might end up buying at a higher price (or selling at a lower price) than you expected. So while market orders are convenient, they are not always the smartest choice.

    2. Limit Order

    A limit order lets you set the exact price at which you are willing to buy or sell a stock. If you want to buy ABC shares only if the price drops to ₹1,450, you place a limit buy order at that price. The order will only execute if the market reaches your specified level.

    You have full control over your entry and exit price. Also, there is no guarantee your order will get filled. If the stock never touches your limit price, your order simply sits there unexecuted.

    Traders who like to plan their entries carefully, buying on dips or selling at resistance levels, rely heavily on limit orders. 

    3. Stop-Loss Order 

    If there is one order type every Indian trader should master, it is the stop-loss order. The primary objective of this order type is to protect you from big losses. You set a trigger price, and once the stock hits that level, your stop-loss order converts to a market order and gets executed automatically.

    Say you bought shares of XYZ at ₹950, and you do not want to lose more than ₹30 per share. You will set a stop-loss at ₹920. If the price falls to that level, your shares get sold automatically 

    This is a lifesaver for intraday and F&O traders, where price swings can be brutal. Decision-making based on your emotions is one of the biggest reasons traders lose money, and a stop-loss removes that emotional element entirely. 

    There are two types of Stop-Loss orders: Stop-Loss Market Order and Stop-Loss Limit Order.

    4. Bracket Order 

    This order type is particularly popular among intraday traders in India. A bracket order combines three orders into one: your entry order, a target order, and a stop-loss order; all placed simultaneously.

    So the moment your entry order executes, the system automatically places both a target order and a stop-loss order. If the stock hits your target, you book profit. If it falls to your stop-loss, you exit with limited damage. Either way, one of the two orders cancels the other automatically once triggered; that is the bracket part.

    5. Cover Order 

    A cover order is similar to a bracket order but simpler.  It pairs your entry order with a compulsory stop-loss order. There is no target order involved here. The idea is to give traders extra leverage for intraday positions while ensuring there is always a safety net in place.

    Most brokers offer higher margin (leverage) on cover orders because the mandatory stop-loss reduces the platform’s risk exposure. It is a decent option if you want more buying power while still having protection against losses. 

    6. Good Till Triggered Order (GTT)

    In a GTT order, you can set a trigger price for a stock, even weeks in advance, and the order stays active until either it is triggered or you cancel it manually.

    Let us say you are eyeing a stock at ₹500, but it is currently trading at ₹560. Instead of checking the price every single day, you set a GTT buy order at ₹500. The moment the stock touches that price, your order executes.

    This is incredibly useful for long-term investors who track specific entry or exit points without wanting to actively monitor the markets daily.

    7. After-Market Order (AMO) 

    Indian markets are open between 9:15 AM and 3:30 PM, but that does not mean your trading decisions have to wait until the next morning. After-market orders let you place buy or sell orders after trading hours, in the evening or early morning before the market opens.

    These orders get queued and executed as soon as the market opens the following session, based on the opening price and available liquidity. It is a good tool for people who plan their trades after work hours.

    Read Also: Market Order Vs Limit Order: What’s the Difference?

    How to Choose the Right Order in the Stock Market?

    The stock order type you use depends on what kind of trader you are.

    If you are a long-term investor who does not mind waiting for the right price, limit orders and GTT orders will be more useful for you

    If you are into intraday trading, bracket orders and cover orders offer built-in risk management that can save your capital on volatile days. 

    If speed matters more than price, say, during a breaking news event, market orders will be the best to use.

    Conclusion 

    Once you start understanding order types, do not try to memorise all seven types. You will forget half of them by tomorrow anyway. Start with the market and limit orders because you will use these two the most, in almost every single trade. Once buying and selling feels comfortable, add a stop-loss into the mix. 

    So many traders learn this after watching a stock crash 8% overnight with no safety net in place. Bracket orders, cover orders, GTT, AMO can wait till you are placing enough trades to need them.

    None of this is complicated once you learn. And in a market that moves as fast as ours, having this kind of clarity puts you ahead of a lot of traders.

    S.NO.Check Out These Interesting Posts You Might Enjoy!
    1Different Types of Trading in the Stock Market
    2Order Book Explained: How It Works and Its Importance
    3What Is an After Market Order (AMO)? Meaning, Timing & How It Works
    4What is Overnight Trading?
    5What is a good rule for investing in stocks?

    Frequently Asked Questions (FAQs)

    1. Which order type should a beginner start with? 

      Limit orders to pre-define what price you are getting, or market orders if you are confident about the next movement.

    2. Should I always add a stop-loss after buying a stock?

      It is a good habit. A lot of traders skip. Setting the stop-loss just takes that risk off the table.

    3. Are GTT orders only for long-term investors? 

      If you have got a price in mind and do not want to check the app every hour, GTT does that watching for you. 

    4. What if my After Market Order does not work?

      It can happen sometimes, especially if there is a big gap between your price and where the stock opens the next day. Just check your order status once the market opens instead of assuming. 

    5. Do all brokers offer the same order types? 

      Yes. Pocketful, along with most other Indian platforms, gives you the same core set, market, limit, stop-loss, bracket, cover, GTT, AMO. Layout might differ a little from app to app. 

  • SIF Regulations in India – SEBI Rules, Eligibility & Investment Limits

    SIF Regulations in India – SEBI Rules, Eligibility & Investment Limits

    Recently, you might have come across the term SIF or Specialized Investment Fund. SEBI introduced this new category to fill a long-standing gap in India’s investment landscape. It was positioned between regular mutual funds and Portfolio Management Services (PMS). 

    Understanding SIF regulations in India is important if you are an investor exploring advanced strategies, or someone trying to analyse where this product fits in your portfolio. 

    This blog breaks down what SEBI says about SIFs.

    What was the Need for SIF?

    Before SIFs came along, investors who wanted more flexibility than a regular mutual fund scheme but were not ready for the high ticket size and complexity of a PMS did not have a middle option. 

    Many of them ended up drifting toward unregulated products just to chase better returns or more tactical strategies. SEBI noticed this pattern and, through an amendment to the SEBI (Mutual Funds) Regulations, 1996, established SIF effective from December 16, 2024. 

    The idea was simple: to bridge the gap between mutual funds and PMS by giving experienced AMCs to run more sophisticated strategies, but still within a regulated mutual fund structure that comes with SEBI oversight, transparency norms, and investor protection.

    The Official SEBI Circular!

    The official notice came a couple of months later. 

    SEBI, through its circular dated February 27, 2025, laid down a comprehensive regulatory framework for SIFs, which came into effect from April 1, 2025. 

    SEBI also directed AMFI to release standardised guidelines to support implementation, and there have been follow-up circulars since then, improvising application formats and disclosure documents.

    Who Can Launch SIFs?

    Not every AMC can simply decide to start an SIF. A registered mutual fund may establish an SIF only if it meets the eligibility criteria under one of two defined routes.

    Route 1: Sound Track Record 

    • Under this route, the mutual fund must have been in operation for a minimum of three years 
    • Must have maintained an average AUM of not less than ₹10,000 crore over the immediately preceding three years. 
    • On top of that, no action should have been initiated or taken against the sponsor or AMC under Sections 11, 11B, or 24 of the SEBI Act, 1992, during the last three years. 

    Route 2: Alternate Route 

    • This route exists for AMCs that may not have the scale mentioned above but do have the right talent 
    • Under this route, the AMC needs to appoint a Chief Investment Officer for the SIF who has at least 10 years of fund management experience and has managed an average AUM of not less than ₹5,000 crore, along with an additional fund manager who meets SEBI’s specified experience requirements, provided the clean regulatory track record condition applies.
    • Whichever route an AMC takes, prior SEBI approval is mandatory before an SIF can be launched, and the fund manager running the SIF must hold the relevant NISM certification specified by SEBI.

    Read Also: Top Specialized Investment Funds (SIFs) in India

    What Are the Investment Strategies Under SIF?  

    An SIF investment strategy has to fall under one of three broad categories: Equity, Debt, or Hybrid, spread across seven eligible subcategories.

    1. Equity

    Under Equity, you have strategies like the Equity Long-Short Fund, the Equity Ex-Top 100 Long-Short Fund, and the Sector Rotation Long-Short Fund. For an Equity Long-Short Fund specifically, the minimum equity exposure needs to be 80%, while the maximum short exposure through unhedged derivative positions is capped at 25%. The Equity Ex-Top 100 strategy requires a minimum 65% exposure to stocks outside the top 100 by market capitalisation, giving fund managers room to hunt for opportunities beyond the usual large-cap names.

    2. Debt

    On the Debt side, SEBI has approved Debt Long-Short and Sectoral Long-Short strategies. 

    3. Hybrid

    Hybrid strategies include the Active Asset Allocator Long-Short Fund and the Hybrid Long-Short Fund, which can dynamically move across equity, debt, REITs, InvITs, and select commodity derivatives depending on market conditions.

    Note: Only one investment strategy is allowed to be launched under each category.

    What Is the Minimum Investment Amount for SIF? 

    SEBI has specified that the AMC must ensure aggregate investment by an investor, across all investment strategies offered under a single SIF, at the PAN level, is not less than ₹10 lakh. 

    A couple of nuances worth knowing: this ₹10 lakh threshold applies exclusively to SIF investments and does not include any money the investor has parked in regular mutual fund schemes of the same AMC. 

    There is also a practical rationale built in that if market fluctuations cause the investment value to dip below ₹10 lakh due to a passive breach, the investor is only permitted to redeem the entire remaining amount rather than continue investing partially.

    This threshold makes SIFs a suitable product for HNIs and more experienced investors who understand the higher risk that comes with these strategies.

    What Are the Investment Limits for SIF? 

    SEBI has also placed caps on how much exposure a debt-oriented or hybrid strategy can take toward a single issuer or sector, to keep concentration risk in check.

    An SIF strategy cannot invest more than 20% of its NAV in debt or money market securities issued by a single issuer rated AAA, 16% in AA-rated securities, and 12% in securities rated A or below. 

    These limits can be extended by up to an additional 5% of the NAV, but only with prior approval from the trustees of the mutual fund and the board of the AMC. 

    On top of issuer limits, an SIF strategy also cannot invest more than 25% of its NAV in debt and money market securities belonging to a particular sector.

    When it comes to derivatives, SEBI allows SIF strategies to take exposure of up to a maximum of 25% of net assets in permissible exchange-traded derivative instruments, specifically for purposes other than hedging and portfolio rebalancing, and overall gross market exposure cannot exceed 100% of the strategy’s net assets.

    Risk Management of SIF

    SEBI has introduced a standardised risk classification. SIFs follow a five-level risk-band system, which is reviewed on a monthly basis to keep the disclosed risk level current and accurate.

    • Type: SIF strategies can be open-ended, closed-ended, or interval-based depending on how the AMC structures them, and redemption frequency varies accordingly. 
    • Redemption: Regardless of structure, redemptions come with a maximum notice period of 15 days, and any closed-ended or interval strategy has to be listed on a stock exchange.
    • Scope: SEBI has also been particular about who can sell these products. Distributors who already sell mutual funds can distribute SIFs too, but only after clearing the NISM Series-XIII Common Derivatives Certification Examination, given the complexity of the underlying strategies. AMCs and AMFI are jointly responsible for ensuring their distribution network stays compliant.

    Taxation on SIF Investments

    Specialized Investment Funds in India are taxed in a “pass-through” way. That means the fund itself does not pay tax. Instead, the investor pay tax when they sell their units.

    How the tax works

    Taxation of SIF depends mainly on whether the SIF is equity-oriented or non-equity-oriented.

    1. Equity-oriented SIF

    At least 65% of the fund is in Indian equity/equity-related instruments. 

    • Short Term: It is taxed like an equity mutual fund: Held for 12 months or less. Profits are taxed at 20%. 
    • Long-term: Held for more than 12 months. Profits are taxed at 12.5%, but only on the amount above ₹1.25 lakh per financial year. 

    2. Non-equity-oriented SIF

    Less than 65% in equity (for example, mostly debt, or a lot of international exposure that doesn’t count as equity for tax). 

    It is taxed more like a debt fund. 

    • Short-term gains: Taxed at your income-tax slab rate (the same rate that applies to your salary/other income). 
    • Long-term gains: Usually, if you hold for more than 24 months, the gains are treated as long-term and taxed at 2.5% without indexation.

    Read Also: SEBI Rules for Authorised Person Registration

    Should I Invest in SIF?

    If you are an investor evaluating whether SIFs make sense for you, it helps to first get comfortable with how derivatives, long-short positions, and sector exposure work in a portfolio. 

    This product is built for investors who already understand market risk reasonably well and are comfortable with complex strategies. 

    As with any newer regulated product, it is worth waiting to see a few quarters of live performance data across different AMCs before making a call. 

    Mutual Funds vs. SIFs vs. PMS: At a Glance

    S. NoParameterMutual FundsSIF (Specialized Investment Fund)PMS (Portfolio Management Services)
    1RegulatorSEBISEBISEBI
    2Minimum InvestmentAs low as ₹100 (SIP) or ₹500-1000 lump sum₹10 lakh at PAN level across strategies₹50 lakh
    3Risk LevelLow to moderately high, depending on scheme typeModerately high to high, with a 5-level risk-band systemHigh, since strategies are concentrated and less diversified
    4Flexibility for Fund ManagerLimited. Must stick to SEBI scheme categorisation rulesMore flexible. Can take short positions, higher derivative exposureMost flexible. No standard categorisation, manager has wide discretion
    5Who Can Launch ItAny SEBI-registered AMCOnly AMCs meeting SEBI’s track record or CIO-experience eligibility criteriaSEBI-registered portfolio managers
    6LiquidityGenerally high, most schemes offer daily redemptionVaries by strategy. Daily, weekly, or interval-based, with up to 15-day notice periodDepends on the PMS provider, generally less liquid than MFs
    7Best Suited ForBeginners to experienced investors, all risk appetitesExperienced investors and HNIs comfortable with tactical, higher-risk strategiesHNIs seeking a fully personalised, concentrated portfolio

    Conclusion 

    SIFs are a new addition to India’s investment avenue, so it is natural to still have questions about how they work in practice. What SEBI has done is create a regulated middle path for investors who want more than a plain mutual fund. SEBI has made sure that only serious, well-informed investors enter this space with realistic expectations. 

    If you are considering an SIF, evaluate it first rather than going in just because it sounds like the next big thing in mutual funds.

    S.NO.Check Out These Interesting Posts You Might Enjoy!
    1Mutual Fund vs PMS: Which is Better?
    210+ Best Investment Plan for Monthly Income in India
    3Hybrid Mutual Funds – Definition, Types and Taxation
    4What is an Open-Ended Mutual Fund & How to Invest in it?
    5Mutual Fund vs ETF. Are They Same Or Different?

    Frequently Asked Questions (FAQs)

    1. Who is allowed to launch an SIF? 

      Only SEBI-registered mutual funds that qualify under one of two eligibility routes.

    2. What kind of strategies can SIFs offer? 

      They can offer equity, debt, or hybrid strategies, spread across seven approved subcategories.

    3. Are SIFs riskier than regular mutual funds? 

      Generally, yes, since they use more advanced techniques like short positions and higher derivative exposure.

    4. Can any mutual fund distributor sell SIFs? 

      No. Distributors need to clear the NISM Series-XIII Common Derivatives Certification Exam before they can sell SIF products.

    5. What happens if my investment value drops below ₹10 lakh?

      If it falls below the threshold due to market movement, you are only allowed to redeem the entire remaining amount rather than continue investing partially.

  • Open Free Demat Account

    Join Pocketful Now

    You have successfully subscribed to the newsletter

    There was an error while trying to send your request. Please try again.

    Pocketful blog will use the information you provide on this form to be in touch with you and to provide updates and marketing.