Category: Case Study

  • Popular Vehicle and Services IPO: Key Details, Financials, Strengths, and Weaknesses

    Popular Vehicle and Services IPO: Key Details, Financials, Strengths, and Weaknesses

    The IPO market is buzzing again because Popular Vehicle and Services is looking to raise capital and is a market leader in selling and distributing old and new vehicles through its strong dealership network.

    In today’s blog, we will uncover the details of the company’s financial statements, strengths, weaknesses, key performance indicators, and issue details.

    Popular Vehicle and Services Limited was established in 1983, and over time, it established itself as a prominent player in the market. The company sells and distributes new and old vehicles, servicing, and distribution of spare parts. They also provide driving classes for new learners and engage in third-party financing and insurance. The company was established as the first batch of dealers by Maruti Suzuki.

    Network

    The company has a vast network which includes 61 showrooms, 133 sales and booking outlets, 32 pre-owned vehicles showrooms, 139 authorized service centres, and 24 warehouses, which is spread around 14 districts in Kerala, 12 districts in Tamil Nadu, and 9 districts in Maharashtra.

    In FY 2023, the company serviced 7,91,360 vehicles, 5,212 luxury vehicles, 1,63,013 commercial vehicles, 1,918 electric two-wheelers, and 857 three-wheelers through their 139 authorized service centers.

    Promoters

    The company’s promoters are John K. Paul, Francis K. Paul and Naveen Philip; they together own 65.79% shares of the company.R

    Read Also: Pune E-Stock Broking Limited IPO: Key Details, Business Model, Financials, Strengths, and Weaknesses

    Details of the Issue

    To raise the 601.55 crores that Popular Vehicles and Services Ltd. is seeking, a combination of both offers for sale (roughly 351.55 crores) and a new issue (roughly 250 crores) is being implemented. The lot of the issue will be 50 shares, the lower price band is 280 INR and the upper price band is 295 INR per share. 

    Key Details

    Face Value of ShareINR 2 per share
    Price BandINR 280 to INR 295
    Market Lot50 Shares
    Total Fresh Issue Size250 Crores
    Total Offer for Sale351.55 Crores
    Employee DiscountINR 28 per share

    Timeline of IPO

    IPO Open Date12th March 2024
    IPO Close Date14th March 2024
    Finalization of Allotment15th March 2024
    Refund & Credit of shares into Demat account18th March 2024
    Listing Date on NSE & BSE19th March 2024

    Allotment Size

    ApplicantMarket LotShareAmount (INR)
    Retailer (Min)15014750
    Retailer (Max)13650191750
    Small High Net Worth Individual (Min)14700206500
    Small High Net Worth Individual (Max)673350988250
    Big High Net Worth Individual (Min)6834001003000

    Objective of the Issue

    The primary objective of the IPO is to repay a significant portion of the debt.

    Read Also: Mahindra & Mahindra Case Study: Products, Financials, KPIs, and SWOT Analysis

    Balance Sheet

    Particulars31st March 202331st March 202231st March 2021
    Total Non-Current Assets768.159656.185552.397
    Total Current Assets734.079605.561564.997
    Total Assets1503.7801263.2881118.936
    Equity343.044279.886246.002
    Total Non-Current Liabilities497.123461.160381.313
    Total Current Liabilities663.613522.242491.621
    (All the above-mentioned figures in INR Crores)

    Income Statement

    Particulars31st March 202331st March 202231st March 2021
    Revenue from Operations4875.0023465.8792893.525
    Total Income4892.6283484.1992919.252
    Total Expenses4807.7613435.6532872.000
    Profit before tax84.86748.54647.252
    Profit after tax64.07433.66932.455
    (All the above-mentioned figures in INR Crores)

    Cash Flow Statement

    Particulars31st March 202331st March 202231st March 2021
    Cash flow from operating activities108.8969.6995.174
    Cash flow from investing activities(79.620)(41.384)(6.650)
    Cash flow from financing activities(23.844)(65.253)(70.676)
    (All the above-mentioned figures in INR Crores)

    KPIs

    Particulars31st March 202331st March 202231st March 2021
    EBITDA Margin4.80%5.13%5.99%
    Return on Equity (ROE)18.68%12.03%13.19%
    Debt to Equity Ratio1.471.331.44
    Profit after Tax Margin1.31%0.97%1.11%
    Return on Capital Employed (ROCE)18.32%16.79%17.09%
    Net Debt/EBITDA2.031.971.68

    The EPS of the financial year ended 2022-23 comes at 10.22, based on which, the PE on the upper price band will come around 28.86x and on the lower price band will be around 27.39x.

    Strengths

    1.  The company has a very diversified product portfolio, such as the sale of new and old vehicles, driving school, insurance, etc.

    2.  The company has a very vast network in Southern India, and they are expanding it to other parts of the country.

    3.  Though the company’s Debt-to-equity ratio has increased from 1.33 in March 2022 to 1.47 in March 2023, it is still below the industry average.

    Weaknesses 

    1.  The company is majorly dependent on manufacturers such as Maruti Suzuki, Tata Motors, etc. Any policy changes could majorly impact their performance.

    2.  Most of the company’s revenue comes from a specific region. Any policy changes made in the region could adversely impact the business.

    3.  The company has inconsistent cash flow from operating activities. They reported cash flow figures as 95.174 crores for FY 2021 and 69.69 for FY 2022.

    4.  The company operates at 1.31% of profit after tax margin. Any changes in the pricing of raw materials could adversely affect its margins.

    Conclusion

    Popular Vehicles and services have a strong presence across the country, and their dealerships are considered among the most prominent in the industry. However, there are certain risks associated with investing in this company. Hence, it is suggested for an investor to go through all the risk factors before making any investment decision.

    S.NO.Check Out These Interesting Posts You Might Enjoy!
    1Hindustan Unilever Case Study
    2Case Study on Apple Marketing Strategy
    3Reliance Power Case Study
    4Burger King Case Study
    5D Mart Case Study

    Frequently Asked Questions (FAQs)

    1. What does the Popular vehicle and services company do?

      The company is engaged in selling and distribution of old and new vehicles. The company is also involved in spare parts distribution and vehicle repair in their authorized service center.

    2. The company is experiencing turbulent cash flows. Should we be worried about this?

      Whether or not this fact deters you from investing is a decision that should be taken after considering all the factors. 

    3. What is the listing date of the popular vehicle company IPO?

      On NSE and BSE, the company’s listing is on 19th March 2024.

    4. Is the popular vehicle and services company in profit?

      Yes, based on the data provided by the company in their red herring prospectus, the company is posting profit from the last 3 years.

    5. What is the minimum amount a retail investor requires to apply for a popular vehicle company IPO?

      The minimum investment amount required by a retail investor is 14750 INR.

  • RK Swamy IPO: Business Model, Key Details, Financials, KPIs, Strengths, and Weaknesses

    RK Swamy IPO: Business Model, Key Details, Financials, KPIs, Strengths, and Weaknesses

    This blog is for you if you’re someone who never lets an investment opportunity pass by and you’re willing to take a chance. We bring you another firm that plans to raise capital from the public straight from the booming initial public offering (IPO) market.

    Business Model

    R.K. Swamy established R.K. Swamy Advertising Associates, which later became RK Swamy Ltd. in 1973. The company’s initial focus was mostly on offering marketing and advertising services to customers in India. In just five years, it became a major force in the Indian advertising market. The company and BBDO created a collaboration later in 1985, and the two ultimately became RK Swamy BBDO. 

    The company’s clientele is dispersed throughout India. It has provided services to almost 4000 organizations, and in the fiscal year 2023, it served over 475 clients.

    The company employs 2391 people and operates 12 locations nationwide, with its head office in Chennai, Tamil Nadu.

    Major Clients

    The business’s clientele is diverse and dispersed around the country. Public and private sector businesses, NGOs, and international corporations are the organization’s clients. The company’s clientele work in various industries, such as banking and finance, insurance, automotive, fast-moving consumer products, etc.

    Some well-known customers are the State Bank of India, Lloyd, Nabard, Havells, LIC, Cera, Hawkins, Larsen & Turbo, Orient Cement, NTPC, SIDBI, and Shriram Transport Finance Company.

    RK Swamy Marketing company

    Promoter Holding

    Promoters Srinivasan K. Swamy (also known as Sundar Swamy) and Narasimhan Krishnaswamy (also known as Shekar Swamy) own approximately 83.03% of the company.

    Details of the Issue

    With a fresh issuance of 173 crores and an offer for sale of 250.56 crores, the business is seeking to raise 423.56 crores. With a market lot of 50 shares, the IPO’s lower price band is set at 270 INR per share, while the higher price band is set at 288 INR per share.

    The major details of the issue are as follows –

    Face Value of Share5 INR per share
    Price BandINR 270 – 288 per share
    Market Lot50 Shares
    Total Fresh Issue Size423.56 Crores
    Fresh Issue173 Crores
    Offer for sale250.56 Crores
    Employee DiscountINR 27 per share

    Timeline of the IPO

    IPO Open Date4th March 2024
    IPO Close Date6th March 2024
    Finalization of Allotment7th March 2024
    Initiation of Refund & Credit of shares into demat account11th March 2024
    Listing Date on NSE & BSE12th March 2024

    IPO Allotment Size

    ApplicantMarket LotShareAmount (INR)
    Retailer (Min)15014400
    Retailer (Max)13650187200
    Small High Net Worth Individual (Min)14700201600
    Small High Net Worth Individual (Max)693450993600
    Big High Net Worth Individual (Min)7035001008000

    Investor Allocation Quota

    The specifics of the issue’s classification into several categories are shown in the table below.

    Investors CategoryShare Allocation (%)Number of Shares Allocated
    Employees Reservation1.77%260417
    Qualified Institutional Buyers73.67%10834895
    High Net Worth Individual14.73%2166979
    Retail Investor9.82%1444653

    Objective of the Issue

    The money raised from the IPO will be used to open a studio for producing digital video material, as well as new customer service locations and a computer-aided telephone interviewing facility. A portion of the proceeds will go toward the company’s IT infrastructure expansion.

    Read Also: Pune E-Stock Broking Limited IPO: Key Details, Business Model, Financials, Strengths, and Weaknesses

    Financial Highlights

    Balance Sheet

    Particulars31st March 202331st March 202231st March 2021
    Non-Current Asset68.82654.77486.512
    Current Asset244.826351.440303.547
    Total Asset313.652406.441390.059
    Equity45.23116.3493.3
    Non-Current Liability22.44817.838122.830
    Current Liability245.973372.254263.929
    (All the above-mentioned figures in crores) 

    Income Statement

    Particulars31st March 202331st March 202231st March 2021
    Revenue from operations292.613234.413173.546
    Total Income299.913244.971183.220
    Total Expenses237.007200.549154.394
    Profit before tax42.58024.74.676
    Profit after tax31.25819.2553.077
    (All the above-mentioned figures in crores) 

    Cash Flow Statement

    Particulars31st March 202331st March 202231st March 2021
    Net Cash flow from operating activities29.16564.00949.945
    Cash flow from investing activities(13.829)(21.220)(21.571)
    Cash flow from financing activities(44.263)(33.487)(27.607)
    (All the above-mentioned figures in crores) 

    KPIs

    Particulars31st March 202331st March 202231st March 2021
    EBITDA Margin20.97%18.13%15.73%
    Return on Equity (ROE)101.52%159.99%6.25%
    Debt Equity Ratio0.763.0922.63
    Profit after Tax Margin10.42%7.86%1.68%
    Return on Capital Employed (ROCE)28.95%20.08%8.58%

    Strengths

    1.  The business has a solid five-decade track record and has made a name for itself in the industry.

    2.  They enjoy a well-known clientele with enduring relationships that bring them recurring business.

    3.  The business has shown consistent growth as revenue from operations has shown approx. 25% increase on a YoY basis.

    4.   Over time, the company’s debt-to-equity ratio has improved. For the financial year ended 2021, the debt-to-equity ratio was 22.63, while in 2023, it came down to 0.76.

    Strengths of RK Swamy

    Weaknesses

    1.  Over time, the company’s cash flow from operating activities has declined by around 50% on a YoY basis.

    3.  The major portion of this issue is offer for sale(OFS); only 173 crores out of 423.56 crores can be utilized towards expansion.

    4.  The industry is expanding quickly, bringing in new competitors who could pose a threat to the business.

    Read Also: Popular Vehicle and Services IPO: Key Details, Financials, Strengths, and Weaknesses

    Conclusion

    The advertising industry is expanding quickly. To start a business or maintain one that already exists, any organization must properly promote its goods and services. RK Swami is a firm that has been in this profession for the past 50 years and is well known in the marketplace. The organization manages the marketing and promotion for leading businesses in practically every industry.

    Though the company has shown major growth prospects, the business is not without risks. Therefore, consider your risk before making any investment decision.

    Frequently Asked Questions (FAQs)

    1. Are RK Swamy Limited employees eligible for a discount?

      Yes, employees of the company are eligible for an INR 27 per share discount on the IPO issue price.

    2. Has there been an improvement in RK Swamy Limited’s profit after-tax margins?

      Indeed, the company’s PAT margins have increased over the last three years. In 2021, the margin was 1.68%, and by the end of the fiscal year in 2023, the margin was 10.42%.

    3. Is RK Swamy a debt-free company?

      Although RK Swamy is not a debt-free company, the ratio has improved over time. As per the company’s red herring prospectus, as of the financial year that concluded in 2023, the debt-to-equity ratio stands at 0.76.

    4. How much must a retailer invest to participate in this IPO?

      A retailer investor must invest a minimum of 14400 INR.

    5. What is RK Swamy Limited’s primary business?

      RK Swamy Limited’s primary business is marketing, advertising, and promoting different companies’ goods and services.

  • JG Chemicals IPO: Overview, Key Details, Financials, KPIs, Strengths, and Weaknesses

    JG Chemicals IPO: Overview, Key Details, Financials, KPIs, Strengths, and Weaknesses

    In today’s blog, we will uncover the details of JG Chemicals, a specialty chemical company that is coming up with an IPO and is engaged in manufacturing zinc oxide.

    Let’s start with a deep analysis of the company’s finances, details of the issue, strengths, and weaknesses.

    JG Chemicals IPO Overview

    Established in 1975, the enterprise is involved in the production of zinc oxide through the utilization of French technology. The company’s founders have over 50 years of combined expertise. 

    In 1975, the business began operations in Kolkata with a small facility with a capacity of about 600 MTPA.

    The company’s clientele is dispersed across the globe; 200 of them are in India, while the remaining 50 are distributed across 10 nations. As of December 2023, the company’s total installed manufacturing capacity was 77040 MTPA. Its manufacturing facilities are located all throughout the nation, with the largest being at Naidupeta, Andhra Pradesh, and Jangalpur, Kolkata. The company employs 112 full-time employees and 47 contract workers.  

    Zinc Oxide

    Promoters

    Suresh Jhunjhunwala, Anirudh Jhunjhunwala, and Anuj Jhunjhunwala are the company’s promoters and own 100% of the company.  

    Details of the Issue

    To raise INR 251.19 crore, JG Chemical is planning an IPO, which combines an offer for sale and a fresh issue. Of the total, INR 165 crores will be a fresh issue and INR 86.19 crores will be an offer for sale. 67 shares make up the market lot for the IPO, with an upper and lower price range of INR 221 and INR 210, respectively. 

    The major details are as follows:

    Face Value of ShareINR 10 Rs
    Price BandINR 210 to INR 221 per share
    Market Lot67 Shares
    Total Fresh Issue Size165 Crores
    Total Offer for Sale86.19 Crores

    Timeline of IPO

    IPO Open Date5th March 2024
    IPO Close Date7th March 2024
    Finalization of Allotment11th March 2024
    Initiation of Refund & Credit of shares into demat account12th March 2024
    Listing Date on NSE & BSE13th March 2024

    IPO Allotment Size

    ApplicantMarket LotShareAmount (INR)
    Retailer (Min)16714,807
    Retailer (Max)138711,92,491
    Small High Net Worth Individual (Min)149382,07,298
    Small High Net Worth Individual (Max)674,4899,92,069
    Big High Net Worth Individual (Min)684,5561,00,68,876

    Objective of the Issue

    The company plans to use the issue proceeds to establish a research facility in Naidupeta, Andhra Pradesh, prepay a portion of its debt, and invest in its subsidiary companies through BDJ oxides. Additionally, a portion of the earnings will be used to finance their working capital. 

    Read Also: Pune E-Stock Broking Limited IPO: Key Details, Business Model, Financials, Strengths, and Weaknesses

    Financial Highlights

    Balance Sheet

    Particulars31st March 202331st March 202231st March 2021
    Non-Current Assets41.45540.42634.364
    Current Assets256.335223.715175.572
    Total Assets297.790264.141209.937
    Total Equity213.528156.638119.004
    Non-Current Liabilities7.5895.8335.976
    Current Liabilities76.673101.67084.956
    (All the above-mentioned figures are in INR Crores)

    Income Statement

    Particulars31st March 202331st March 202231st March 2021
    Revenue from Operations784.576612.830435.298
    Total Income794.188623.047440.405
    Total Expenses717.495565.601399.206
    Profit before tax76.69457.44641.199
    Profit after tax56.79343.12628.799
    (All the above-mentioned figures are in INR Crores)

    Cash Flow Statement

    Particulars31st March 202331st March 202231st March 2021
    Net Cash flow from operating activities31.1666.752(7.346)
    Cash flow from investing activities(4.897)(5.415)(5.60)
    Cash flow from financing activities(28.574)(0.190)16.955
    (All the above-mentioned figures are in INR Crores)

    KPIs

    Particulars31st March 202331st March 202231st March 2021
    EBITDA Margin10.85%10.83%11.17%
    Return on Equity (ROE)30.50%30.64%24.23%
    Debt Equity Ratio0.340.620.69
    Profit after Tax Margin7.24%7.04%6.62%
    Return on Capital Employed (ROCE)29.38%25.83%25.27%

    Based on the 17.32 EPS for the fiscal year that ended in 2023, the PE on the upper price band comes out to be 12.75x, while the PE on the lower price band comes out to be 12.12x.

    Strengths

    1. The company has a monopoly in this industry because it is the only one in India producing zinc oxide. 

    2. The industry is protected from competition by having an extremely high entry barrier.

    3. The company’s operating cash flow has expanded dramatically over the past year. In FY2022, OCF stood at 6.752 crores; by FY2023, it was 31.166 crores. 

    4. The company’s promoters have over 50 years of experience in this industry, and their expertise helps them achieve new heights.

    JG chemicals monopoly

    Weaknesses

    1. The company’s main product is zinc oxide. Therefore, any decline in demand could harm the company’s bottom line.

    2. Since their profit after-tax margin has been stable over the last three years, any increase in input costs could hurt their profit margins. 

    3. Given that the price of zinc oxide had a global correction in 2021, any additional price correction may affect their performance. 

    4. The company’s business operations depend on the performance of its subsidiary, BDJ Oxides Private Limited; any decrease in the subsidiary company’s performance would have a detrimental impact on its operations.

    Read Also: Gillette India Case Study: Business Model, SWOT Analysis, and Financial Overview

    Conclusion

    JG Chemical has a monopoly in the zinc oxide market, and the company’s main goals in raising money include paying off debt and investing in its subsidiary businesses. Nearly all of the world’s leading tire manufacturers are served by the company. The business’s performance is evident in its financial statements, where sales have grown by over 28% Y-o-Y, and profit has surged by 31% Y-o-Y. 

    However, before making any investment decisions, investors are advised to carefully review all of the risk considerations associated with this initial public offering (IPO) and to keep their risk tolerance in mind. 

    Frequently Asked Questions (FAQs)

    1. When will JG Chemical IPO list?

      The listing date of the JG chemical IPO is 13th March 2024.

    2. What is the cut-off price of the JG Chemical IPO?

      The upper price band of 221 INR will be the cutoff price of the IPO.

    3. What does JG Chemical do?

      JG Chemical manufactures zinc oxide. Their products are used in industrial applications such as rubber tires, ceramics, paints & coatings, etc.

    4. What is the market lot size of JG chemical IPO, and what will be the minimum amount required by an individual?

      The market lot of JG Chemical IPO is 67 shares, and the minimum investment amount required by a retail investor is 14,807 INR.

    5. What is the promoter holding before the issue of the IPO?

      The promoters hold a 100% stake in the company before the issue of the IPO.

  • Zomato Case Study: Business Model, SWOT Analysis, and Financials Explained

    Zomato Case Study: Business Model, SWOT Analysis, and Financials Explained

    Everyone knows India’s leading food delivery platform, Zomato. As a pioneering force in the food delivery and restaurant discovery industry, Zomato has revolutionized how people interact with dining options and culinary experiences. 

    This blog will explain Zomato’s business model, SWOT Analysis, financials, and more.

    About Zomato Company

    Zomato was founded as FoodieBay in 2008 by Deepinder Goyal and Pankaj Chaddah in Delhi. In 2016, the founders renamed FoodieBay Zomato to appeal to Indian audiences. The company stood out in the marketplace because it provided a comprehensive platform for customers to discover and engage with restaurants.  

    Zomato was created to solve a common problem – the lack of accessible and organized restaurant information. The company later expanded to food delivery services and has become the most popular food delivery platform in India. 

    Acquisitions of Zomato

    • In July 2014, Zomato acquired MenuMania, a New Zealand-based restaurant database.
    • In September 2014, the company acquired Gastronauci, a Poland-based restaurant search service.
    • In December 2014, it acquired an Italian restaurant search service named Ciband.
    • In 2016, Zomato acquired a Gurgaon-based technology startup, Sparse Labs, and renamed it Zomato Trace.
    • In 2018, this company acquired its rival, Uber Eats (Indian operations).
    • In 2022, Zomato acquired Blinkit (formerly Grofers).
    Blinkit

    Shareholders of Zomato

    Info Edge India owns the largest share in Zomato. This company is a media and internet firm and owns a 23.9% stake in the company. 

    Some of the major shareholders in Zomato include:

    Sequoia Capital India  17.8% 
    Alibaba Ant Financial10.8%
    Temasek Holdings7.6%
    Tiger Global Management6.1%
    Fidelity Management & Research5.3%

    Read Also: Zepto Case Study: Business Model, Financials, and SWOT Analysis

    Did you know?

    Deepinder Goyal, the co-founder and CEO of Zomato, owns a 4.3% stake in the company. 

    Business Model of Zomato

    Zomato provides a treasure trove of information, including restaurant names, addresses, contact details, and user-generated reviews and ratings. This helps the audience discover new and unique restaurants.

    Zomato utilises the power of the restaurant depository and delivers food orders from these restaurants. Since almost every major restaurant is listed on Zomato, the users’ ability to switch to different apps is drastically reduced. They deliver food quickly to the address of the customer and charge a small fee in exchange for this service.

    Segments

    Zomato is earning money from a total of 5 segments, they are:

    • Food Delivery
    • Hyperpure (B2B Supplies)
    • Quick Commerce (Blinkit)
    • Going-out (Events platform)
    • Others
    Zomato burger

    Read Also: Blinkit vs Zepto: Which is Better?

    Major Competitors of Zomato

    Swiggy

    Swiggy is a powerful rival of Zomato, forcing the company to innovate regularly due to the extremely low customer switching cost. As one of Zomato’s primary rivals, Swiggy has cemented its position in the Indian market, posing a strong threat to Zomato’s market share. 

    Uber Eats

    Uber Eats is a company that falls under Uber Technologies and serves 60 countries; it is one of the leading food delivery platforms in the world. Zomato has acquired Uber Eats’ India operations, but Uber Eats still stands as a formidable competitor to Zomato in foreign markets.

    DoorDash

    DoorDash mainly serves in the United States and Canada. The company has built a reputation for its extensive restaurant partnerships and robust delivery network. 

    EatClub

    EatClub operates in 5 metro cities and has eight brands, such as Box8 and Mojo Pizza. They come across as a very strong contender for Zomato. 

    Key Data of Zomato

    Here is some important market data of Zomato.

    Market Cap ₹ 1,41,117 Cr. 
    Current Price ₹ 160
    High / Low ₹ 176 / 49.0
    Stock P/E 122
    Book Value ₹ 25.2
    Dividend Yield 0.00 % 
    ROCE 0.29 % 
    ROE 0.20 % 
    Face Value ₹ 1.00
    (As on 7th March)

    Read Also: Bajaj Finance Case Study: Business Model, Financials, Competitors, and KPIs

    Financial Highlights

    Income Statement

    Particulars FY20FY21FY22FY23
    Revenue from Operations2,604.741,993.804,192.407,079.40
    Total Expenses4,941.602,468.906,062.608,332.80
    EBITDA-2,336.87-475.10-1,870.20-1,253.40
    EBIT-2,421.10-612.8-2,020.50-1,690.30
    Profit before Tax -2,385.60-815.10-1,220.50-1,014.60
    Consolidated Profit -2,367.16-812.8-1,208.70-971.3
    (In INR Crores)

    Cash Flow

    ParticularsFY20FY21FY22FY23
    Cash From Operating Activities -2,143.63-1,017.90-693.00-844.00
    Cash Flow from Investing Activities 1,735.22-5,243.70-7,937.80457.30
    Cash from Financing Activities 358.916,401.908,749.80-127.40
    Net Cash Inflow / Outflow -49.50140.30119.00-514.10
    (In INR Crores)

    Profitability Ratios

    ParticularsFY20FY21FY22FY23
    ROCE (%)-142.88-18.27-9.82-5.37
    ROE (%)-200.51-21.84-10.79-5.79
    Net Profit Margin (%)-85.97-38.40-25.97-12.44
    ROA (%)-76.76-14.07-9.39-4.99
    EBIT Margin (%)-92.95-30.74-48.19-23.88

    Shareholding Pattern

    Shareholder TypeDec-23Sep-23Jun-23Mar-23Dec-22
    DIIs15.4713.049.938.037.43
    FIIs54.8854.7254.4354.6156.74
    Others29.6532.2435.6437.3635.83
    DII And FII MOVEMENT

    SWOT Analysis of Zomato

    SWOT Analysis of Zomato

    Strengths

    1. Globally available: Zomato expanded its services to various countries and made a global footprint, encouraging international reach and providing access to diverse markets. 
    2. Leading food delivering services: Zomato has become a leader in the food delivery industry. Its food ordering and delivery services cover more than 1,000 cities and have 14.7 million monthly average transacting customers.

    Weaknesses

    1. High Competition – Zomato operates in a highly competitive market, with various food delivery giants like Swiggy, Uber Eats, and EatClub competing for the same customer base.
    2. Operational challenges – The company faces several operational challenges as a food delivery company, such as delivery delays, food quality issues, and logistical problems. These issues can result in negative customer feedback and reduced customer loyalty, ultimately hurting the company’s profitability.

    Opportunities

    1. Expansion through sustainable practices: The company is capitalizing on the growing demand for sustainable practices by expanding its eco-friendly initiatives.
    2. Revenue streams: The company diversifies revenue streams and enhances user engagement. Zomato must expand faster than others to stay ahead of the curve.
    3. New Users: Nowadays, smartphones and internet users have increased tremendously. This will help Zomato gain new users and audiences. 

    Threats

    1. Fragile Business model: Economic factors can affect consumer dining and food delivery spending, potentially impacting revenue.
    2. Loss turning segments: The company loses a significant chunk of money in the Quick Commerce segment and thus has to return lower profits at a consolidated level. 

    Read Also: Blinkit Case Study: Business Model, Financials, and SWOT Analysis

    Conclusion

    Zomato is building brand recognition, global reach, and user-generated content to contribute to its success in the food delivery industry. Zomato faces lots of challenges, constantly innovating and improving its services to stay ahead of the competition. They must maintain their position and take more initiatives to grow and expand their business. 

    S.NO.Check Out These Interesting Posts You Might Enjoy!
    1Polycab Case Study: Business Model, Financials, Competitors, and Growth Outlook
    2CAMS Case Study: Business Model, KPIs, and SWOT Analysis
    3Hindustan Unilever Case Study: Business Model, Financials, and SWOT Analysis
    4Infosys Case Study: Business Model and SWOT Analysis
    5Eicher Motors Case Study: Business Model & SWOT Analysis
    6Kalyan Jewellers Case Study: Business Model, Marketing Strategy & SWOT

    Frequently Asked Questions (FAQs)

    1. Who is the CEO of Zomato?

      Deepinder Goyal heads the company as the CEO.

    2. Is Zomato profitable?

      Zomato turned profitable for the first time in the quarter ending June 23. The company produced a profit of INR 2 Crores.

    3. What is the former name of Zomato?

      Zomato was founded as FoodieBay in 2008 by Deepinder Goyal and Pankaj Chaddah.

    4. How many segments does Zomato report?

      Zomato has 5 segments, namely – Food Delivery, Hyperpure, Quick Commerce, Going-out, and Others.

    5. Is Zomato used outside India?

      The company is operational in Indonesia, Sri Lanka, and UAE.

  • Gopal Snacks IPO: Segments, Financials, Key Details, Strengths, and Weaknesses

    Gopal Snacks IPO: Segments, Financials, Key Details, Strengths, and Weaknesses

    Craving a crispy treat that speaks to your Indian taste buds? This Gujarat-based company has been a leader in the snacking game for over a decade. From the ever-popular ‘gathiya’, a fried gram flour snack, to a diverse range of delicious offerings, the company caters to every craving.

    So, settle in and grab your favourite snack while we dive deep into the company’s financials, strengths, key risks, and upcoming IPO details.

    Gopal Snacks IPO Overview

    Gopal Snacks is an Indian fast-moving consumer goods (FMCG) company based in Rajkot, Gujarat. The company sells and manufactures a variety of snacks and other products. They are the fourth largest brand in the organised sector of ethnic savouries in India in terms of market share and the largest manufacturer of ‘gathiya’ and snack pellets in terms of volume. They sell their products in 10 states and 2 Union Territories of India.

    The company was established in 1999 by Bipin Hadvani as a partnership firm with Gopal Gruh Udhyog and was converted into a corporate entity in 2009.

    The company’s manufacturing plants are located in Rajkot, Nagpur, and Modasa, Gujarat. The installed manufacturing capacity of the plants cumulatively (as of September 30, 2023) is 4,04,729 tons per annum, whereas the primary facility holds a manufacturing capacity of 3,03,669 tons (for finished products).

    Gopal Snacks IPO Segments

    Gopal Snacks manufactures ‘ready-to-eat’ packaged snacks, which include:

    1. Ethnic snacks – Over 65% of Gopal’s revenue in FY 2023 came from their namkeen segment and ethnic namkeen achieved a sales volume of approximately 27,630 tons.

    2. Western Snacks – wafers, nachos, extruder snacks, and snack pellets constitute the western snacks category. This category offers flexibility to meet a variety of tastes. Since the product is semi-finished and unexpanded, it allows for customisation during the final preparation stage. By adding different spices and ingredients, manufacturers can create products that cater to the specific demand of the end users.

    3. Other products – The category includes gram flour or besan, papad, powdered spices, noodles, washing bars, and packaged sweets such as soan papdi, rusk, and chikki.

    The company has also introduced its product line offering premium wafers under the brand name ‘Cristos Gopal’ and extruder snacks under ‘Cornigo’.

    Additionally, Gopal Snacks holds 276 Stock Holding Units (SKU) in its portfolio and is the first company to launch gram flour in INR 10 SKU.

    The varieties offered in the Gathiya segment by Gopal Snacks create a strong competitive advantage over other established players in the segment. Gopal’s Gathiya offerings include Vanela Gathiya, Fulvadi Gathiya, Tikha Gathiya, Papdi Gathiya, Tikha Papdi Gathiya, Bhavnagari Gathiya, Champakali Gathiya, and Nylon Gathiya.

    Gopal Snacks IPO Presence

    In addition to Gujarat, the company holds a strong presence in the states of Maharashtra, Uttar Pradesh, Madhya Pradesh, and Rajasthan with a distribution network of 617 distributors.

    The company is strategically increasing its pan-India presence, by focusing on states of Northern India like Uttar Pradesh, Rajasthan, Haryana, and Delhi and Southern India states like Karnataka and Telangana. Gopal Snacks Owner also plans on selling their products to countries like Australia, Kuwait, Saudi Arabia, UAE, and the USA through both direct exports and merchant exporters.

    To sum it up, the company’s product portfolio includes 84 products which include 8 types of gathiya, 31 types of namkeen, 12 types of snack pellets, 8 flavours of Wafers, 4 types of Papad, 6 types of spices, 5 types of extruded snacks, and 9 other products.

    Presence in India

    Did You Know?

    Gopal Snacks reigns supreme as India’s Gathiya king, holding a whopping 31% market share in FY 2023.

    Read Also: Pune E-Stock Broking Limited IPO: Key Details, Business Model, Financials, Strengths, and Weaknesses

    Key IPO Details

    IPO DateMarch 6, 2024 to March 11, 2024
    Price BandINR 381 to INR 401 per share
    Lot size37 Shares
    Total Issue Size16,209,476 shares
    IPO TypeMain-board IPO 
    Issue TypeBook Built Issue IPO
    Listing DateThursday, March 14, 2024
    Initiation of RefundsWednesday, March 13, 2024
    Employee DiscountRs 38 per share

    Objectives of the Issue

    The company will not receive any proceeds from the Offer (the “Offer Proceeds”), and the Selling Shareholders will receive all the Offer Proceeds in proportion to the Offered Shares sold by the respective Selling Shareholders.

    The company’s promoters are Bipinbhai Vithalbhai Hadvani, Dakshaben Bipinbhai Hadvani and Gopal Agriproducts, and the pre-issue promoter shareholding stands at 93.50%.

    Financial Statements Analysis

    Key Metrics

    Key MetricsFY 2023FY 2022FY 2021
    Total Assets461.28399.72341.89
    Total Liabilities170.40222.06206.15
    Total Income1,398.531,356.471,129.84
    Total Expenses1,246.691,302.411,103.34
    Profit After Tax112.3641.5321.12
    EBITDA196.2294.7960.35
    *(the figures mentioned above are in INR Crore)
    Key metrics of Gopal Snacks

    Key Margins and Ratios Analysis

    Key RatiosFY 2023FY 2022FY 2021
    Gross Margin28.38%20.61%18.13%
    EBITDA Margin14.07%7.01%5.35%
    PAT Margin8.06%3.07%1.87%
    ROE38.63%23.38%15.56%
    ROCE43.08%18.69%13.48%
    Debt-to-Equity ratio0.370.921.02
    Net Fixed Asset Turnover Ratio6.276.867.14

    Cash Flow Statements

    Cash FlowsFY 2023FY 2022FY 2023
    Cash flow from/ (used in) operating activities121.5258.5922.43
    Cash flow from/(used) investing activities(25.12)(74.03)(75.67)
    Cash flow from/(used in) financing activities(68.83)11.7557.50
    *(the figures mentioned above are in INR Crore)
    CFS Of Gopal Snacks

    Gopal Snacks IPO Strengths

    1. Gopal Snacks is a national leader in ethnic savouries, ranking India’s fourth-largest brand and offering quality and affordable products. Also, the company has a strong brand image, which allows it to stand out in a competitive market.
    2. The company boasts a diverse product portfolio, perfectly positioned to capitalize on the booming Indian snack market.
    3. The company owns six manufacturing facilities, comprising three primary and three ancillary manufacturing facilities. These manufacturing facilities are focused on processing, manufacturing, and packaging the products.
    4. Gopal Snacks’ comprehensive distribution network ensures their products are conveniently located near you, making it easy for customers to satisfy their snack cravings.
    5. The company is guided by a team of experienced promoters and managers bringing knowledge and expertise.

    Gopal Snacks IPO Weaknesses

    1. The Indian FMCG market, especially the snack segment, is highly competitive. Gopal Snacks faces tough competition from established players and new entrants, both domestic and international.
    2. The company’s dependence on raw materials and packaging can be risky. Any shortages, disruptions, or price swings could affect the profits and cash flows.
    3. An inefficient management of the distribution network could severely impact the business.
    4. Food safety is paramount. Any contamination issues or product recalls could damage the brand image and lead to a decline in sales.
    5. The food industry is subject to several regulations. Changes in regulations or difficulty complying with existing regulations could pose challenges for Gopal Snacks.

    Read Also: Bikaji Foods Case Study – Product Portfolio, Financial Statements, & Swot Analysis

    Conclusion

    On a parting note, Gopal Snacks Limited is a rising company. With solid market positioning, experienced leadership and a diversified product portfolio, the company holds a strong foundation for future growth. The IPO could be a springboard for further expansion and innovation. However, it is crucial to know the risks involved before making any investment decisions.

    S.NO.Check Out These Interesting Posts You Might Enjoy!
    1HDFC Bank Case Study: Business Model, Financial Highlights, and SWOT Analysis
    2Vedanta Case Study: Business Model, Financial Statement, SWOT Analysis
    3Nestle India Case Study: Business Model, Financial Statement, SWOT Analysis
    4BPCL Case Study: Business Model, Product Portfolio and SWOT Analysis
    5Apollo Hospitals Case Study : Business Model, Financial Statements, And SWOT Analysis

    Frequently Asked Questions (FAQs)

    1. What are Gopal Snacks famous for?

      The company is known for their wide range of delicious snacks, specifically gathiya and ethnic namkeens.

    2. How has Gopal Snacks adapted to changing consumer trends?

      The company has consistently evolved its offerings, incorporated healthier ingredients, and stayed updated on changing consumer needs for a wholesome snacking experience.

    3. Who are Gopal Snacks’ competitors?

      The company faces tough competition from Bikaji, Haldiram’s, Britannia, etc.

    4. How can I benefit from Gopal Snacks IPO?

      Investors can join the growing snack industry and reap the rewards as Gopal Snacks expands its market presence.

    5. Beyond ‘gathiya’, what else does the company offer?

      Gopal Snacks offers a diverse range of ethnic namkeens, from spicy to mild.

  • Pune E-Stock Broking Limited IPO: Key Details, Business Model, Financials, Strengths, and Weaknesses

    Pune E-Stock Broking Limited IPO: Key Details, Business Model, Financials, Strengths, and Weaknesses

    Are you considering venturing into the world of a stock that manages your portfolio but unsure where to begin? Look no further than PESB.

    Today’s blog will uncover the critical IPO details, strengths and risks, and PESB’s financial statements.

    Overview of Pune E-Stock Broking Limited IPO

    Pune E-Stock Broking Limited (PESB) is a corporate broking house founded in 2007 and is headquartered in Pune, Maharashtra. The company offers several investment services, like broking, mutual funds, currency trading, depository services, and IPOs. The company was registered with SEBI as a stock broker in 2008 and expanded its business into the commodity segment by becoming a member of MCX in 2019.

    With a network of over 150 authorised persons and a trading client base exceeding 50,000, PESB’s influence expanded in the post-Covid era.

    PESB’s success is attributed to the leadership of its founding team, which includes Mr Vrajesh Krishnakumar Shah, Mr Devendra Ramchandra Ghodnadikar, Mr Sandip Sunderlal Shah, and Mr Paresh Sunderlal Shah.

    Business Model of Pune E-Stock Broking Limited IPO

    PESB offers the following services to its clients:

    1. Client Broking

    Clients can access real-time quotes, execute trades through the mobile app and website and stay informed with the latest market news and updates while enjoying customer service.

    1. Depository Participant

    PESB offers a seamless trading experience by integrating demat services through CDSL, where they are a registered depository participant. This allows clients to hold and manage their investments conveniently in one place. The company has over 23,155 active clients with depository services.

    1. Mutual Funds

    The company makes mutual fund investing convenient and comprehensive by offering a wide range of equity, debt, and hybrid funds from multiple AMCs. This variety helps investors create a diversified portfolio that aligns with their financial goals. Customers also receive regular portfolio updates and follow-ups.

    1. Corporate Deposits

    PESB offers corporate deposits as an alternative investment option to traditional bank fixed deposits. With fixed interest rates often exceeding those of traditional options, these deposits cater to individuals of diverse risk appetites while aligning with the practice of secure fixed-income investing.

    1. Currency Trading

    Customers can trade currency flexibly through multiple channels, and forex derivatives services offered by the company fulfil the various investment goals through hedging, speculation, and portfolio diversification.

    PESB’s user-friendly Trading App further showcases its dedication to technological innovation. With the app’s help, clients can manage their investments, stay updated on market trends, and execute trades on the go.

    PESB Business Model

    Key IPO Details

    IPO DateMarch 7, 2024 to March 12, 2024
    Price BandINR 78 to INR 83 per share
    Lot Size (Retail/HNI)1600 Shares/3200 Shares
    Total Issue Size4,606,400 shares
    IPO TypeBSE SME IPO
    Basis of AllotmentMarch 13, 2024
    Initiation of RefundsMarch 14, 2024
    Listing DateMarch 15, 2024
    Issue TypeBook-Built Issue
    Issue Size38 Crores
    • Objectives of the issue are to meet the working capital requirements for general corporate expenses and public issue expenses.
    • Pre-Issue Shareholding of Promoters is 72.75%, and promoters collectively hold 80,34,858 equity shares of the company.

    Read Also: Rashi Peripherals Limited: IPO Analysis

    Financial Statements Analysis

    Key Metrics 

    Key MetricsFY 2023FY 2022FY 2021
    Total Income4103.104665.703474.64
    Total Expenses2884.373404.642603.12
    Profit After Tax964.521012.03650.48
    Long-term Borrowings77616401015
    Net Worth7654.666754.555806.65
    (Figures mentioned in the table are in Lakhs)
    Key metrics of PESB

    Cash Flow Statement

    Cash FlowFY 2023FY 2022FY 2021
    Net cash flow from operations-358.672168.62-594.74
    Net cash flow from investing activities-1163.603631.28-2921.99
    Net cash flow from financing activities-690.091035.23408.01
    (Figures mentioned in the table are in Lakhs)
    CFS of PESB

    Strengths

    1. The company is led by a team of experienced professionals with deep knowledge of the core aspects of the business and holds long-term relations with customers.
    2. PESB simplifies investing by offering a wide range of brokerage services under one roof and caters to diverse investor needs with equity and currency derivatives trading. The recent addition of Mutual Fund and Margin Trading Facility (MTF) in business operations is an icing on the cake.
    3. The electronic brokerage platform enables the company to prioritize real-time risk management through its system that closely monitors the exposure by taking into consideration factors like client margins, exchange margins, and credit lines.

    Read Also: KP Green Engineering: IPO, Business Model, And SWOT Analysis

    Weaknesses

    1. The company’s restated summary information for FY 2023 shows negative cash and cash equivalents, and the company may likely experience similar negative cash flows in the future.
    2. The company has previously faced regulatory actions from stock exchanges and SEBI. The possibility of similar future actions cannot be entirely ruled out, which could impact the company’s financial health, operations, and profitability.
    3. The company’s directors, promoters, subsidiaries and group companies are involved in several legal proceedings at different stages. While the outcome of these proceedings is uncertain, any adverse judgements could affect the business operations.
    4. PESB operations rely heavily on IT and are exposed to cyber security risks and any kind of failure or security breach could adversely affect the business.

    Conclusion

    PESB empowers you to navigate the financial landscape with confidence and offers a comprehensive suite of investment products and services, all designed to fulfil the unique financial goals and risk tolerance of the customers. However, it is necessary to conduct your research before making any investment decisions.

    S.NO.Check Out These Interesting Posts You Might Enjoy!
    1Gopal Snacks IPO: Segments, Financials, Key Details, Strengths, and Weaknesses
    2JG Chemicals IPO: Overview, Key Details, Financials, KPIs, Strengths, and Weaknesses
    3RK Swamy IPO: Business Model, Key Details, Financials, KPIs, Strengths, and Weaknesses
    4Krystal Integrated Services: IPO, Business Model and SWOT Analysis
    5Popular Vehicle and Services IPO: Key Details, Financials, Strengths, and Weaknesses

    Frequently Asked Questions (FAQs)

    1. When was the company founded?

      PESB was founded in 2007.

    2. What is the price band of the PESB IPO?

      The price band of the IPO is INR 78 to INR 83 per share.

    3. When will the PESB IPO open?

      The PESB IPO will open on March 7, 2024.

    4. What does the company do?

      PESB is a stockbroking firm that offers equity, mutual fund, currency, commodities, and depository services.

    5. Where can I find more information about the PESB IPO?

      You can read the IPO prospectus on the website of BSE SME and other IPO managing brokerage firms.

  • Tata Motors Case Study: Business Model, Financials, and SWOT Analysis

    Tata Motors Case Study: Business Model, Financials, and SWOT Analysis

    From the streets of Mumbai to the prestigious avenues of London, the growls of Tata Motors engines echo across the globe. This Indian automotive giant has come a long way, evolving from a locomotive manufacturer to a diverse automobile powerhouse.

    In today’s blog, we will delve into the world of this fascinating company from exploring its rich history to ambitious plans. 

    All About Tata Motors

    Tata Motors is India’s 3rd largest automobile company and is a leading global manufacturer of cars, utility vehicles, buses, trucks, and defence vehicles. Tata Motors was incorporated in the year 1945 and was a part of the Tata Group which was founded by Jamshedji Tata in the year 1868.

    Some of the world’s most iconic brands, including Jaguar Land Rover in the UK and Tata Daewoo in South Korea are a part of the automotive operations of the group.

    Tata Motors is committed to developing innovative and sustainable vehicles for the future of mobility. The company operates on a philosophy of ‘giving back to society’.

    Additionally, in a major push for clean transportation, Tata Motors signed a deal to supply 3,500 EVs to BluSmart Mobility, India’s first electric and shared smart mobility company, expanding Delhi NCR electric fleet and offering customers more environment-friendly travel options. 

    Tata Tiago EV

    History of Tata Motors

    The Tata Motors history dates back to 1945. Tata Motors was founded as Tata Engineering and Locomotive Company (TELCO), which initially focused on locomotives.

    The company entered the commercial world market in the year 1954 through a joint venture with Daimler-Benz, establishing India’s first heavy vehicle manufacturing facility. Gradually it expanded the commercial vehicle portfolio with trucks and buses, becoming a dominant player in the market.

    2008 marked a turning point with the acquisition of Jaguar and Land Rover from Ford, propelling Tata Motors onto a global stage.

    Did You Know?

    In the year 1991, India’s first sports utility vehicle (SUV), Tata Sierra, was designed and manufactured by Tata Motors.

    Highlights (FY 2022-23)

    • Presence in more than 150 countries.
    • ₹ 29,398 crores was spent on research and development.
    • 25 manufacturing facilities, 9 R&D centres and 3 Design labs.
    • 91,811 collective workforces.

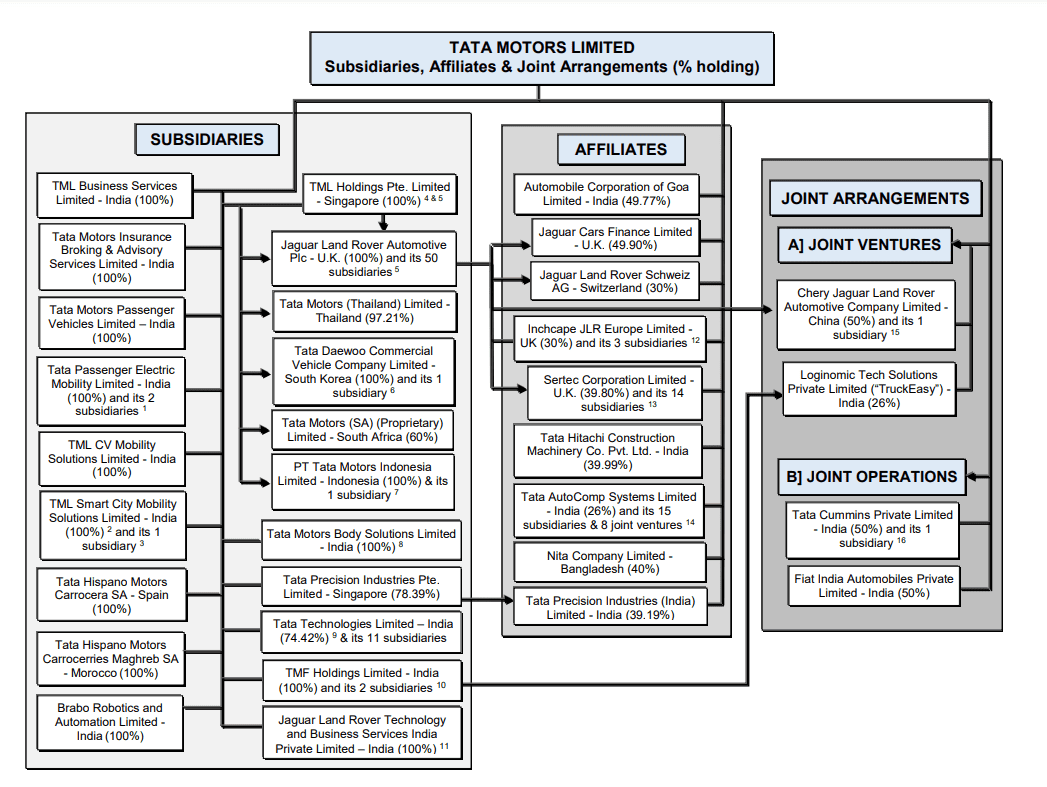
    Subsidiaries of Tata Motors

    Some of the subsidiaries of Tata Motors is mentioned below:

    • Tata Motors Passenger Vehicles Limited: TMPV is a wholly-owned subsidiary of Tata Motors and leads the passenger vehicle business in India. The company offers a diverse range of sedans, SUVs, and electric vehicles.
    • Tata Passenger Electric Mobility Limited (TPEM): TPEM was established in FY 2021-22 to carry out the Passenger Electric Mobility Business with a funding of INR 7500 crore from TPG Rise. The company aims to channel future investments into electric vehicles.
    • Jaguar Land Rover (JLR): JLR, a well-known British manufacturer of luxury cars, was acquired by Tata Motors in 2008. The company exemplifies quality and sustainability.
    • Tata Motors Finance Limited (TMFL): TMFL and Tata Motors Finance Solutions Limited (TMFSL) are TMF Holdings Limited (TMFHL)’s Non-Banking Financial Companies (NBFCs) subsidiaries. TMFHL is a Core Investment Company (CIC) and Tata Motors’ completely owned subsidiary. TMFL provides vehicle financing solutions to Tata Motors customers in India.
    Subsidiaries of Tata Motors

    Business Model of Tata Motors

    he Tata Motors business model integrates manufacturing, R&D, global sales, financial services, and innovation to position itself as the most aspirational brand in India’s automotive industry.

    Tata Motors holds 10 manufacturing facilities, and 3 R&D/engineering and design centres. Furthermore, there are 12 worldwide manufacturing and engineering facilities for JLR.

    The company aims to become the most aspirational brand in the Indian Automotive Industry.

    Full range of activities that TML provides includes manufacturing operations, logistics, financial services, global sales network, customer service network, mobility service, innovation and technology, design and engineering, and strategic sourcing.

    Business Model of Tata Motors

    Product Portfolio of Tata Motors

    The existing Commercial Vehicle Range of the company is as follows

    MHCV, Buses and Vans, ILCV, SCV and PICKUP.

    Last but not least the showstopper in the CV range is the ACE EV which features TML’s EVOGEN powertrain.

    The existing Passenger Vehicle Range includes products like Tiago, Tigor, Altroz, Punch, Nexon, Harrier, and Safari.

    Existing Electric Vehicle Range includes Tiago EV, Tigor EV, XPRES-T EV, Nexon EV, and NEXON EV MAX.

    Also, the company boasts that the EV contribution is likely to increase to 25% in 5 years and reach 50% by 2030.

    Apart from the portfolio mentioned above, TML offers a luxury range as well which includes Jaguar and Land Rover, the two distinct British brands with a rich heritage design.

    Did you Know?

    Tata Motors’ first indigenously developed passenger car, Tata Indica was presented in 1998 at the Geneva Motor Show.

    Market details of Tata Motors

    Current Market Price ₹ 716
    Market Capitalization (in ₹ crores)2,63,536
    Book Value₹ 275
    52-Week High/Low₹ 1,179 / 606
    Face Value₹ 2
    Return on Equity49.4 %
    Stock P/E8.33
    (As of 24 March 2025)

    Financial Statement Analysis

    Income Statement 

    Key MetricsFY 2024FY 2023FY 2022
    Total Income4,43,8773,50,6002,81,507
    Total expenses4,06,6363,37,7172,79,198
    EBIT37,24113,2832,308
    Net Profit 31,1062,353-11,234
    (As of 24 March 2025)

    (Above mentioned figures are in ₹ crores unless stated otherwise)

    Balance Sheet 

    Key MetricsFY 2024FY 2023FY 2022
    Current Assets1,68,3921,51,5281,46,978
    Non-Current Assets2,02,2721,84,5531,83,642
    Current Liabilities 1,73,6171,55,0271,50,683
    Non-Current Liabilities1,01,4051,25,9551,31,105
    Total Shareholder Funds87,46447,81944,555
    (As of 24 March 2025)

    (Above mentioned figures are in ₹ crores unless stated otherwise)

    Cash Flow Statement 

    Key MetricsFY 2024FY 2023FY 2022
    Cash Flow from Operating Activities67,91535,38814,282
    Cash Flow from Investing Activities-22,828-16,804-4,775
    Cash Flow from Financing Activities-37,005-26,242-3,380
    (As of 24 March 2025)

    (Above mentioned figures are in ₹ crores unless stated otherwise)

    Peer Comparison

    CompanyCurrent Market Price (in ₹)Market Capitalization (in ₹ crores)P/EROCE (%)
    Tata Motors7162,63,5368.3320.1
    Ashok Leyland21262,21022.315
    Olectra Greentec1,26410,37478.814.8
    Force Motors8,84511,6552323.8
    SML ISUZU1,7502,53220.923.6
    (As of 24 March 2025)

    Read Also: Tata Power Vs Adani Power: Comparison Of Two Energy Giants

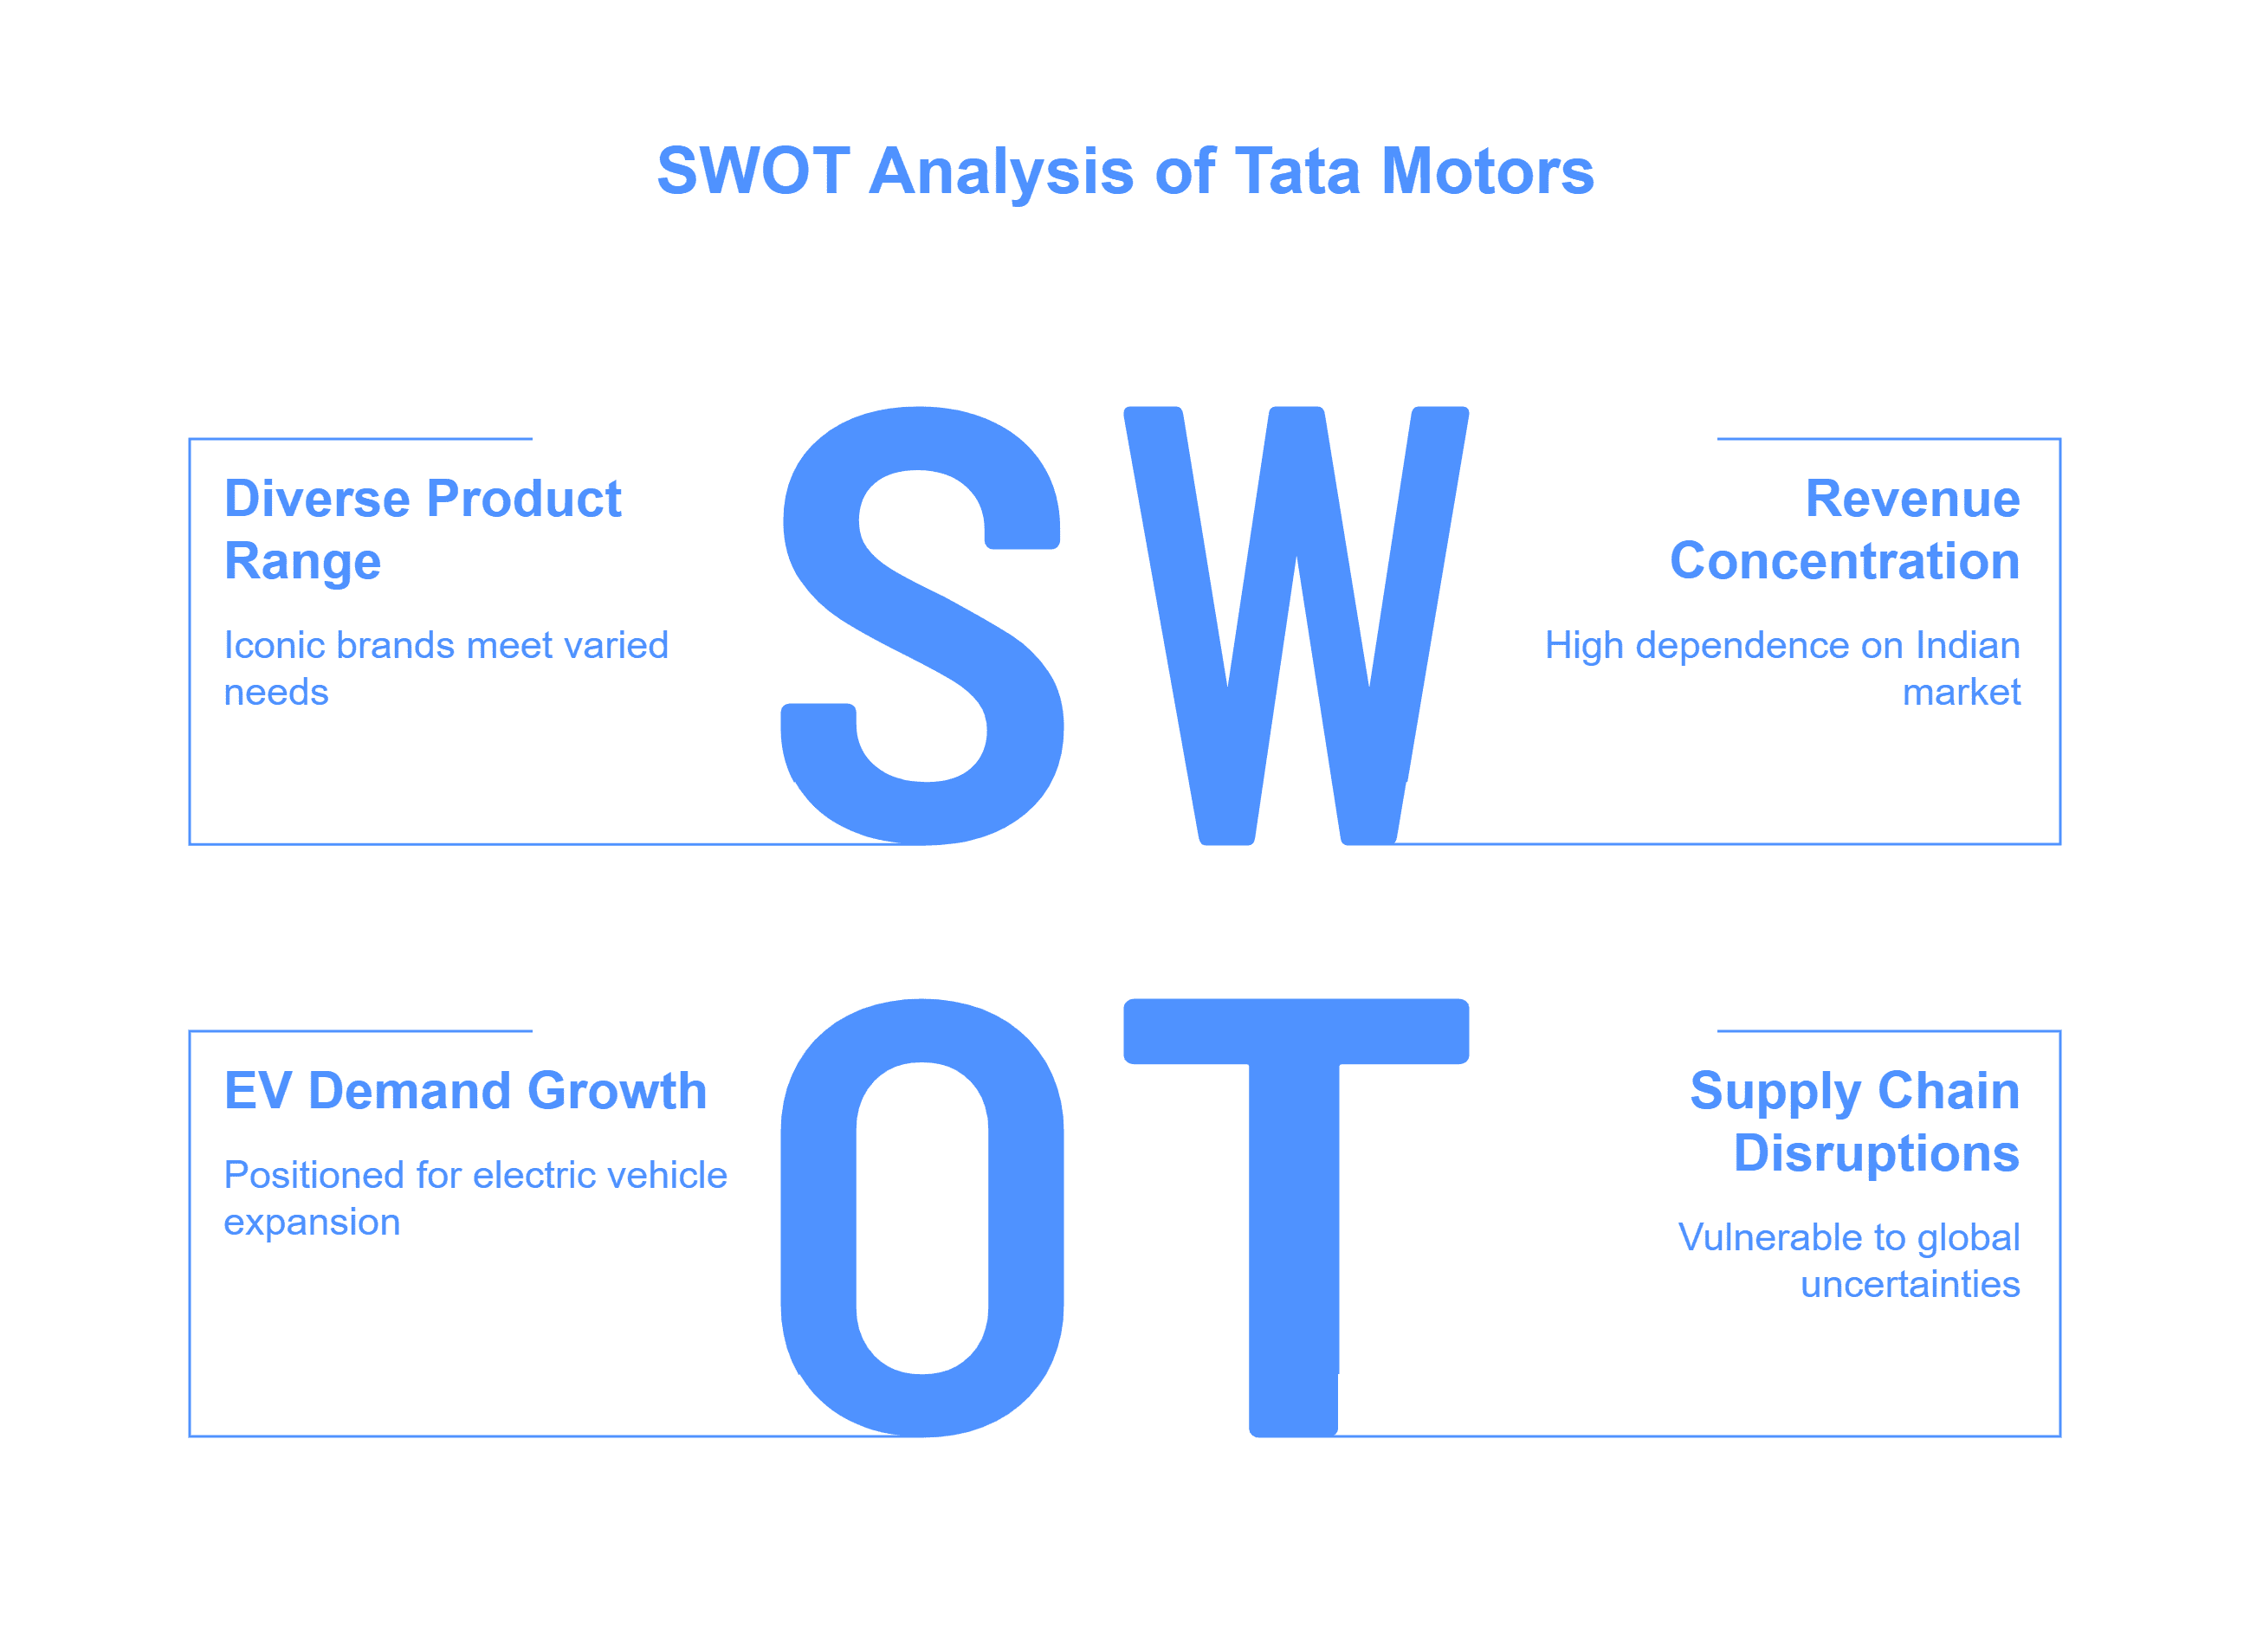
    SWOT Analysis of Tata Motors

    Strengths

    1. The company offers a diverse range of product portfolios including iconic brands like JLR which cater to the needs of a wide range of customers.
    2. Consistent investments in strategic partnerships and collaborations to infuse new technologies help the company expand its business operations.
    3. The company considers the quality and safety of the customers as key parameters while manufacturing products.
    4. Tata Motors invests heavily in research and development and tries to curate future-ready vehicles with features like electric mobility and connectivity.
    5. They actively promote sustainable practices through electric vehicles and emission reduction initiatives aligning with environmental concerns.

    Weaknesses

    1. A significant portion of its revenue comes from India, which exposes the company to economic fluctuations and regulatory changes in the country.
    2. Despite the pervasiveness of JLR, their presence in major global markets like China and North America remains limited.
    3. Dependence on imported materials exposes the company to price fluctuations, impacting the profit margins.
    4. The EV industry is dynamic as it changes quickly, failure to keep up with market trends may affect margins. 

    Opportunities

    1. Tata Motors is well-positioned to capitalise on the rising demand for electric vehicles with their existing offerings and future developments.
    2. Consistent investments in research and development can lead to breakthroughs in areas like autonomous driving and connected cars, offering a competitive advantage.
    3. Government initiatives promoting EVs can create favourable market conditions for Tata Motors.
    4. They can leverage JLR to further expand their reach in international markets.

    Threats

    1. Any kind of disruption in the supply chain can affect business operations.
    2. The company is exposed to several global economic and geopolitical situations such as wars, natural disasters, and pandemics.
    3. Sudden shifts in policy and environmental regulations can disrupt operations.
    4. Rapid advancements in technology can make existing products obsolete if they are not constantly updated.
    5. Brand positioning is a challenge in a dynamic automotive market with more intense competition from existing OEMs and new entrants in the market.

    Growth of Tata Motors

    Tata Motors has indeed seen incredible growth in the Indian domestic market, especially in the commercial vehicle segment. Rising GDP and infrastructure spending can further boost the demand for commercial vehicles. New models such as Tiago, Nexon, and Harrier have been well-received by customers. Additionally, the company has captured the growing market segments with the latest designed EVs.

    Conclusion

    Tata Motors stands as a prominent player in the Indian automotive landscape, with a diversified product portfolio, strong brand recognition and a commitment to innovation and sustainability. Their business model positions them well for future growth. However, navigating and addressing key challenges will be critical for the company.

    S.NO.Check Out These Interesting Posts You Might Enjoy!
    1Tata Steel Case Study: Business Model, Financial Statements, SWOT Analysis
    2Titan Case Study: Business Model, Financials, and SWOT Analysis
    3Zaggle Case Study: Business Model, Financials, and SWOT Analysis
    4Hyundai Motor India Case Study: Business Model, Financial Statements, And SWOT Analysis
    5Case Study on Trent Limited: Financials, Business Model, Marketing Strategies, and SWOT Analysis
    6Kalyan Jewellers Case Study: Business Model, Marketing Strategy & SWOT

    Frequently Asked Questions (FAQs)

    1. Why is electric mobility a big focus for TML?

      With India’s growing environmental concerns and rising fuel costs, electric vehicles represent a good solution.

    2. Can Tata Motors become a global leader in the automotive industry?

      The question cannot be answered yet but capitalising on opportunities will be important for them to compete on a global scale.

    3. What are the latest innovations of the company?

      TML is investing in connected car technology, autonomous driving, and many other revolutionary innovations.

    4. Which company made the world’s cheapest car?

      The iconic Tata Nano was the cheapest car ever sold and was produced with the objective of providing affordable mobility to people.

    5. Does the company focus majorly on budget cars?

      Tata Motors fulfil the diverse needs of customers by offering premium vehicles like Land Rover Discovery and budget friendly cars like Tata Punch. 

  • Scope of AI in Investing: Usage, Benefits, and Challenges

    Scope of AI in Investing: Usage, Benefits, and Challenges

    Artificial intelligence (AI) scope has emerged as a game-changer in the ever-evolving land of finance, revolutionizing how investments are approached and managed. With its ability to quickly analyze vast datasets, detect patterns, and forecast market trends, AI has the potential to reshape the world of investment management. 

    In this blog, we will evaluate the AI scope in finance, exploring its benefits, challenges, and much more

    Usage of AI

    AI can be used in finance to help with data analytics, performance measurement, predictions, forecasting, real-time calculations, customer servicing, intelligent data retrieval, and much more. AI enables the organization to set the working environment and better understand the market and customers. It can also analyze and learn the digital journeys in a way that mimics human intelligence and interactions at scale.

    The entire Artificial Intelligence industry is modernizing. Technology is becoming a new face in this era. As an outcome, finance and investing have made ground-breaking advances in cutting-edge technologies. There are several areas where Artificial intelligence is used in investing. Some of these cases are:

    Algorithmic Trading

    Traders use algorithmic trading to analyze large datasets and trade at high speeds, making trades based on market trends and patterns. It often focuses on taking advantage of minor price discrepancies but in huge volumes.

    Portfolio Optimization 

    With the help of AI, you can succeed in profile optimization. Computer algorithms work to determine the market data, determine risks, and find asset classes that potentially give the highest returns. It also helps in forecasting the future price of the holdings of the individual.

    Improving Security

    Businesses can improve the security and trustworthiness of their payment transactions by deploying AI-powered tools to protect their financial transactions. Financial institutions like infrastructure, banks, investment firms, and insurance companies use AI to detect anomalous spending behaviour and prevent fraud.

    Increasing Speed

    The consumer experience is being transformed by AI, with quicker, contract-free interactions that include real-time credit approvals and improved fraud protection and cybersecurity. These automations help dramatically increase the speed of fulfilling transactions, creating new accounts, etc. 

    Streamlining Back-office Operations

    AI is revolutionizing back-office operations by automating many repetitive tasks that became a hurdle for traders. Some of these tasks are regulatory compliance and know-your-customer (KYC) guidelines. 

    Artificial Intelligence

    Read Also: Best Artificial Intelligence (AI) Smallcap Stocks

    Benefits of AI

    Artificial Intelligence (AI) integration has emerged as a game-changer, offering many benefits while posing specific challenges. Here are some of the benefits of using AI in finance:

    Enhanced Decision Making

    AI algorithms possess the prowess to analyze vast datasets at lightning speed, enabling financial institutions to make informed decisions promptly. These systems can detect patterns, trends, and anomalies that might elude human analysts, leading to more accurate predictions and risk assessments.

    Cost Reduction

    Automation of routine tasks through AI streamlines operations, significantly reducing overhead costs for financial organizations. AI-driven systems can efficiently handle data entry, fraud detection, and customer service, allowing human resources to focus on more complex and strategic endeavours.

    Improved Customer Experience

    AI-powered chatbots and virtual assistants provide round-the-clock customer support, catering to queries and resolving issues promptly. 

    Risk Management

    AI algorithms excel in identifying potential risks and mitigating them proactively. By continuously monitoring market trends, credit risks, and compliance regulations, AI-driven systems help prevent fraudulent activities and ensure regulatory compliance, safeguarding the interests of both financial institutions and investors.

    Market Analysis and Prediction

    AI algorithms analyze market sentiments, economic indicators, and historical data to generate accurate forecasts and insights. This empowers investors and traders with valuable information for making informed investment decisions, optimizing portfolio performance, and maximizing returns.

    Artificial Intelligence

    Read Also: What is AI Washing? Definition, Tips, Evolutions & Impact

    Challenges of AI

    AI helps the industry flourish, but it does not come without flaws. Some of the challenges of using AI in finance are:

    Data Privacy

    The extensive use of AI in finance involves handling sensitive financial data, raising concerns regarding privacy and security. Ensuring robust cybersecurity measures and regulatory compliance is paramount to safeguarding customer information and preventing data breaches.

    Algorithm Bias

    AI algorithms are susceptible to biases inherent in the data they are trained on, potentially leading to discriminatory outcomes. Additionally, the complexity of AI models often makes it challenging to interpret their decisions, raising questions about transparency and accountability in financial decision-making processes.

    Regulatory Compliance

    The rapid advancement of AI technology outpaces regulatory frameworks, posing challenges in ensuring compliance with evolving regulations. Moreover, ethical considerations surrounding AI usage, such as algorithmic fairness and accountability necessitate careful scrutiny and regulatory oversight to mitigate risks.

    Dependency on Technology

    Over reliance on AI-driven systems without human oversight can pose risks in volatile market conditions or unforeseen scenarios. Human judgment and intervention remain crucial for validating AI-generated insights and decisions, mitigating the potential impact of technological failures or algorithmic errors.

    Skills Gap

    The integration of AI in finance necessitates a workforce equipped with advanced technological skills to harness its full potential. However, this transformation may lead to job displacement for individuals whose roles become redundant due to automation, highlighting the importance of reskilling and upskilling initiatives to adapt to the evolving demands of the industry.

    Artificial Intelligence

    Conclusion

    The scope of AI in investing is vast, with applications such as algorithm trading, portfolio optimization, and cybersecurity. AI is revolutionizing the finance industry by providing deeper insights, improving customer experiences, and aiding in risk management. 

    However, challenges such as regulatory compliance, algorithm bias, limited knowledge, and data scarcity need to be addressed for the full potential of AI to be realized.

    Frequently Asked Questions (FAQs)

    1. What are the benefits of AI in investment?

      AI helps investors analyze data faster, find patterns, and make better decisions. It reduces human error, lowers costs, and improves results by predicting market trends and managing risks.

    2. What is the scope of AI in finance?

      AI is widely used in finance, including trading, risk management, fraud detection, and customer support. It helps financial services become more efficient, accessible, and secure.

    3. How can AI be used in investing?

      AI can provide personalized investment advice through robo-advisors, analyze public sentiment, and predict stock prices to help investors make profitable trades.

    4. What is the scope of artificial intelligence?

      The scope of AI spans industries like healthcare, finance, and transportation, automating tasks and improving decision-making. It powers applications such as diagnostics, fraud detection, and autonomous vehicles. Emerging fields like generative AI and cybersecurity further expand its potential.

    5. What is the role of AI in the investment sector?

      AI enhances trading strategies, analyzes market trends, and manages risks, allowing financial professionals to focus on important decisions while AI handles repetitive tasks.

  • Electoral Bonds Explained: What Are They and Why Did Supreme Court Ban It?

    Electoral Bonds Explained: What Are They and Why Did Supreme Court Ban It?

    Can anonymity buy democracy? Let us unpack the complexities of Electoral bonds, a financial instrument masked in secrecy that raises questions about transparency, accountability and the foundation of democratic trust.

    Let us explore the heated debate through today’s blog.

    Electoral Bonds Overview

    Electoral Bonds were a mode of funding for political parties in India. Introduced in the Union Budget of the year 2017-18, these bonds functioned like promissory notes. They were purchased by Indian citizens or entities registered in India from designated branches of the State Bank of India. These bonds could then be donated to any registered political party, encashing them through their electoral accounts.

    The Electoral Bond Scheme was introduced to bring transparency and anonymity to political funding. However, it faced lashes from various quarters stating that the electoral bonds question the integrity of the electoral process.

    Before we dive deeper into the story, let us have a quick read on the features of the bond.

    Electoral Bonds Features

    1. These bonds are bearer instruments like promissory notes, meaning whoever possessed the bond could redeem it, making it difficult to track the donor.
    2. The bonds were available in denominations of INR 1000, INR 10,000, INR 1,00,000, INR 10,00,000 and INR 1,00,00,000 and can be purchased by a person who is a citizen of India. The buyer does not receive any interest on these bonds.
    3. Individuals or companies could buy them from specified branches of the State Bank of India.
    4. To purchase these bonds, a buyer was required to apply to the authorised bank, and the authorised bank could ask for additional KYC documents.
    5. The payments for the issuance of Bonds were made in Indian rupees through demand draft, cheque, ECS or direct debit to the account of the buyer.
    6. Political parties (parties that were registered under Section 29A of the Representation of the People Act, 1951) and received at least 1% of the votes polled in the last general election were eligible to receive the bond.
    7. Electoral bonds were valid for 15 days from the date of issue and are not tradeable on the stock exchange.
    8. The bonds were issued to the buyer on a non-refundable basis 
    9. One of the most controversial features of the bond was that the donors were not required to disclose their identity to the political party or the public.

    Did you Know?

    To pave the way for the Electoral Bonds Scheme, the government introduced amendments to four acts, namely the Representation of the People Act, 1951; the Companies Act, 2013; the Income Tax Act, 1961; and the Foreign Contributions Regulation Act, 2010 (FCRA), through the Finance Acts of 2016 and 2017.

    Why were Electoral bonds banned?

    On February 15, 2024, the Supreme Court banned the Electoral Bond.

    Here are the major reasons behind the ban

    1. The court ruled that the anonymity provided by these bonds violated the Right to Information Act, highlighted in the Indian Constitution. Voters have a right to know the source of the funds political parties receive to make informed voting decisions. This feature hindered transparency and scrutiny.
    2. Allowing multiple entities to issue bearer instruments, like electoral bonds will challenge the RBI’s authority and risks undermining the public confidence in the official currency. The misuse of the bonds in large quantities could further harm trust in the Indian financial system.
    3. Existing payment methods like cheques, drafts and digital transfers already facilitate transparent contributions to political parties. Offering electoral bonds, which may raise opacity concerns is unnecessary.

    Data Analysis

    Before the issuance of the electoral bonds scheme in FY 2016-17, political parties received 81% of the contributions through voluntary contributions. However, after the introduction of the EBS, 47% of the contributions were received through electoral bonds.

    According to the annual report submitted by the Electoral Trust, for the financial year 2021-22, the Trust received contributions of a total of Rupees 4,64,83,00,116 from seventy contributors including individuals and companies. The contributions were unequally distributed to the Aam Aadmi Party, All India Congress Committee, Bhartiya Janata Party, Goa Congress Committee, Goa Forward Party, Indian National Congress, Punjab Lok Congress, Samajwadi Party, Shiromani Akali Dal, Telangana Rashtra Samiti.

    Party-wise donations received through the Bonds from 2017- 18 to 2022-23

    Party2017-182018-192019-202020-212021-222022-23
    BJP2101,450.892,555.0022.3851,033.701294.1499
    INC5383.26317.86110.075236.0995171.02
    AITC097.28100.464642528.143325.1
    NCP029.2520.5014
    TRS0141.589.1530153
    TDP027.581.603.534
    YSR-C099.8474.3596.256052
    BJD0213.550.567291152
    DMK0045.580306185
    SHS060.440.980
    AAP*017.7655.9525.1245.45
    JDU00131.410
    SP0010.8403.210
    JDS6.0335.257.500
    SAD006.7600.50
    AIADMK006.05000
    RJD002.500
    JMM00100
    SDF00.50000
    MGP00000.55

    We can say that the majority of contributions through Bonds have gone to political parties which are ruling parties in the Centre and the States.

    Graphical Representation of the above table is as follows.

    Party-wise donation by corporate houses to national parties

    Party2016-172017-182018-192019-202020-212021-22
    BJP515.5400.2698.14720.407416.794548.808
    INC36.0619.298127.602133.0435.8954.567
    NCP6.11.63711.34557.08618.1515.28
    CPI(M)3.560.8721.1876.9179.8156.811
    AITC2.03042.9864.500.25
    CPI0.0030.0030000
    BSP000000

    The data shows that the party-wise donation by the corporate houses has been more or less stagnant from the years 2016-17 to 2021-22

    Read Also: Explainer on Green Bonds: History, Process, Pros, Cons, and Future Outlook

    Graphical Representation of the above table is as follows.

    Data of denomination/sale of Bonds during the 27 phases from March 2018 to July 2023

    DenominationNo. of Electoral Bonds SoldAmount(In Rupees)
    1 Crore12,999(54.13%)12,999 Crore(94.25%)
    10 Lakhs7,618(31.72%)761.80 Crore(5.52%)
    1 Lakh3,088(12.86%)30.88 Crore(0.22%)
    10 Thousand208(0.86%)20.80 Lakh(0.001%)
    1 Thousand99(0.41%)99,000
    Total24,01213791.8979 Cr.

    Interesting inferences that can be drawn from the table above are

    • Anonymous donations to political parties skyrocketed, reaching 72% during the years 2018-19 to 2021-22 as compared to 66% during the years 2014-15 to 2016-17.
    • National parties saw a massive increase in unknown income, from INR 2550 crore in 2014-15 to a whopping INR 8489 crore in 2021-22.
    • Between the years 2019-20 to 2021- 22, the Bond income has been 81% of the total unknown income of national parties.

    Read Also: What is Debt Mutual Funds: Invest in the Best Debt Funds in India

    Conclusion

    The ban on electoral bonds has left several key effects. The government has yet to propose an alternative scheme. The ban reignited the debates about transparency in political funding with limitations on donor privacy. How the ban will affect funding patterns across different political parties is quite uncertain. The consequences of electoral bonds and their ban will likely continue to unfold in the months and years to come.

    Frequently Asked Questions (FAQs)

    1. What are electoral bonds?

      These bonds are bearer instruments used to donate to the registered political parties in India.

    2. How do Electoral Bonds work?

      Individuals or companies bought bonds from the specified branches of SBI. Donors remained anonymous to parties. However, KYC norms applied. Parties could redeem bonds in their bank accounts.

    3. Why were these bonds controversial?

      The anonymity sparked concerns about hidden influences and misuse. It was argued that the bond violated transparency.

    4. What is the impact of the ban?

      The future of political funding in India is uncertain after the ban on electoral bonds.

    5. Will electoral bonds ever come back?

      It is difficult to say if the bonds will return in the future. The government may propose alternatives.

  • Case Study on Westlife: The Rise of McDonalds in India

    Case Study on Westlife: The Rise of McDonalds in India

    Do you know about Westlife Foodworld Limited? This company set foot in the Quick Service Restaurant industry in 1996 when it acquired the master franchise rights for McDonald’s in India. In this blog, we will explore the success story of Westlife in the Indian market.  

    About Westlife

    The QSR (Quick Service Restaurants) industry has been experiencing unprecedented growth fueled by consumer demand. This massive growth happened recently and is expected to continue because of changing consumer preferences. 

    Westlife Foodworld Limited is responsible for establishing and operating the McDonald’s franchise in parts of West and South India. After remarkable success, the company became a beacon of inspiration and interest for investors and entrepreneurs.  

    The company established a strong presence in the nation’s West and South regions and saw a surge in revenue by 45% y-o-y to reach Rs 2,260 crore in FY23. The company provides excellent experiences to their customers, such as high-quality food, comfortable seating arrangements, consistent taste, etc. This is possible due to their robust supply chain and customer-centric policies. 

    The company has reported an EBITDA margin of 17.3 per cent  – up 300 basis points bps y-o-y), PAT (profit after tax) increased to Rs 112 crore, and the Cash PAT margin improved by 11.2 per cent. 

    Let’s have a look at the key metrics of the company:

    Market Cap ₹ 12,756 Cr. 
    Stock P/E144
    Current Price ₹ 818
    High / Low₹ 1,025 / 639
    Book Value₹ 36.1
    Dividend Yield 0.42 %
    ROCE 14.8 % 
    ROE21.7 %
    Face Value ₹ 2.00
    (As on 17 February 2024)

    Read Also: McDonald’s Marketing Strategy – Case Study

    Overview of McDonald’s

    It was established in 1940 in California by Richard and Maurice McDonald as a restaurant. This company serves delicious snacks like burgers and french fries, including chicken, fish, salads, and many more. The journey of “I’M Lovin’ it!” started around 25 years ago and later acquired the palette of the Indian market and enjoyed massive growth. Let’s dive into the company profile:

    Company typePublic
    IndustryFast food restaurants
    Founded atMay 15, 1940
    Founded by Richard McDonald, Maurice McDonald, Ray Kroc
    Area servedWorldwide
    ProductsBurgers, chicken, french fries, soft drinks, soft serves, shakes, salads, desserts, hotcakes, coffee, breakfast, wraps

    Q3 impacted by the subdued business environment

    • The SSSG (Same Store Sales Growth) in Q3FY24 stood at -9% Y-o-Y due to eating-out trends and other external challenges.
    • Off-premises business boosted 3% Y-o-Y, majorly led by delivery & Drive-throughs as they contributed 42% of the total sales. 
    • Digital sales rose by 15%, contributing to 67% of the business. 
    Westlife (Mcdonald's) in India

    How did McDonald’s conquer India?

    As we know, McDonald’s has different types of customers nationwide. Indian families always prefer to go out with family members on the weekdays and weekends. Countries like India give McDonalds more exposure to spread the market.  McDonald’s has a unique eating menu in India because of cultural diversification. Here we get a different menu including aloo tikki and french fries, not just traditional coke and burger.  

    Other than that, McDonald’s also focuses on college students and working professionals. But the question “How did McDonald’s grow rapidly in India?” remains unanswered. So, here are a few reasons why it happened. 

    • A Happy Meal includes different age groups, from children to adults, which means each age group will be happy with the order while being budget-friendly. By doing this, McDonald’s could retain all age groups as repeat customers. This feature gained immense popularity.  
    • McDonald’s is renowned for being consistent with their services to their customers. 
    • The company modified its menu regularly to cater to the market’s needs, such as incorporating burgers without onion and garlic during Navratri and creating makhani burgers to cater to people who like spicy food.
    • McDonald’s rapidly expanded throughout the country, thus making it the go-to destination for families. 

    Read Also: Polycab Case Study: Business Model, Financials, Competitors, and Growth Outlook

    Business Model and Growth Strategy 

    This industry is projected to grow remarkably in the upcoming years. The changing lifestyle, urban population, quick and convenient food options, and increasing income standards are the main reasons for the QSR industry’s massive growth potential. McDonald’s cracked the functionality framework and the customer acquisition. They carefully customized their menus per the state’s food preference, and they adapted to cultural norms by including vegetarian options in their food menus. 

    Business Model 

    McDonald’s mainly focuses on the franchise business model to generate a significant income, which is far more stable and predictable. They can leverage its market position to negotiate deals because it has control over the land and long-term leases. This is akin to a subscription, where the subscriber (the franchisee) pays a fixed monthly amount.  The Franchise business gives a lot of revenue to the company and has a positive impact.

    Growth Strategy 

    In 2017, the company introduced the Velocity Growth Plan, citing the center of the plan as a customer centric strategy, primarily focusing on the business, food, value, and customer experience. Here are the main factors considered in the plan:

    • Retaining: The plan mainly focuses on the areas where customers have a strong foothold.
    • Regain: It mainly focuses on the areas of the customer where the company lost a significant share of customers because of factors like food taste, competition, pricing, etc. 
    • Convert: It also focuses on gaining new customers by offering additional items on the menu, like coffee and snacks.
    Growth strategy of Mcdonald's

    Read Also: Nestle India Case Study: Business Model, Financial Statement, SWOT Analysis

    Conclusion

    In this blog, we concluded how McDonald’s conquered the Indian market, growth strategies, marketing strategies, reports related to FY23, and many more. In conclusion, the rise of McDonald’s in India through Westlife Foodworld Limited showcases a successful business model focusing on customer needs, quality food, and strategic growth strategies. McDonald’s ability to adapt to local preferences and offer a diverse menu has immensely contributed to its rapid expansion and sustained success in the Indian market.

    Frequently Asked Questions (FAQs)

    1. Why did McDonald’s succeed in India?

      The success mantra implemented was adapting Indian Food tastes and preferences in their food menus.

    2. Who was McDonald’s target customer in India?

      Children, families, working employees, and adults were all the targeted customers of McDonald’s.

    3. Who is McDonald’s main competitor?

      Burger King, KFC, Burger Singh, etc. are the main competitors of McDonalds.

    4. When did McDonald’s come to India?

      Westlife started operations for McDonald’s in the year of 1996 in India. 

    5. Who heads Westlife Foodworld?

      Amit Jatia heads Westlife as the Chief Executive Officer (CEO).

  • Open Free Demat Account

    Join Pocketful Now

    You have successfully subscribed to the newsletter

    There was an error while trying to send your request. Please try again.

    Pocketful blog will use the information you provide on this form to be in touch with you and to provide updates and marketing.