Investing in gold has moved beyond buying jewellery or coins. Today, digital gold options are offering better choices to investors. Options like Gold BeES and Gold ETFs offer a smart, secure, and cost-effective way to invest in gold through the stock market.
So, if you are an investor looking to invest in gold, then you have just landed at the right place. This financial guide will share everything about Gold BeES vs Gold ETF in detail here.
Gold ETFs and Gold BeES: A Quick Comparison
Now that you have explored all the basic details linked to both the investment options, let us now explore a brief comparison of Gold BeES vs Gold ETFs here:
| Aspect | Gold BeES | Gold ETFs |
|---|---|---|
| Category | Gold BeES is a specific gold exchange-traded fund offered by Nippon India Mutual Fund. | Gold ETFs refer to the broader category of gold-based exchange-traded funds offered by multiple fund houses. |
| Fund House | Managed only by Nippon India Mutual Fund. | Offered by various AMCs like HDFC, ICICI, Axis, Kotak, and more. |
| Unit Size | Each unit represents approximately 0.01 gram of gold with 99.5% purity. | Varies as it depends on the price of the ETF. |
| Liquidity | Highly liquid with a large daily traded volume. | Liquidity depends on the specific fund and its trading activity. |
| Expense Ratio | Fixed at 0.80%. | Varies between 0.32% to 0.78% depending on the AMC. |
| Tracking Error | Tracks domestic gold prices closely with low tracking error. | May show higher tracking error in some funds due to operational inefficiencies. |
| Taxation | Short-term gains (held for 12 months or less) are taxed as per income tax slab. Long-term gains (held for more than 12 months) are taxed at 12.5% without indexation. | The same tax rules apply – STCG as per income slab, LTCG at 12.5% without indexation. |
Understanding Gold BeES
Gold BeES is an Exchange-Traded fund (ETF) that tracks the domestic price of gold by investing primarily in physical gold of 99.5% purity. They offer investors a way to gain exposure to gold price movements in a digital and secure format.
This means you can invest in gold without the need to buy or store physical gold. Gold BeES is an open-ended scheme, which does not have a maturity or lock-in period. It is listed and traded on stock exchanges like any other share.
So when you buy Gold BeES, you are investing in approximately 0.01 grams of gold, as it trades around ₹80 and the price of 10 gm of actual gold is around ₹90,000. This allows investors to start investing in gold with a small initial capital.
In India, Gold BeES is managed and offered by Nippon India Mutual Fund. It is the country’s first and most traded Gold ETF. The fund has been managed by Vikram Dhawan since 2022. The fund aims to provide returns that closely correspond to the domestic price of gold, before expenses. It is benchmarked against the domestic price of gold.
The further details of the Gold BeES that you should be aware of are as follows:
| Date of Listing | 8-Mar-2007 |
| AUM (₹ Cr.) | 20,783.15 |
| Price | ₹79.51 |
| Expense Ratio | 0.80% |
Now that you know what Gold BeES means, let’s quickly understand its working here.
How Gold BeES Works?
When you invest in any asset, the first thing that you must understand properly is how it works and generates returns. By knowing this, you can ensure that your investment is not just done in the right direction, but also that you gain from your investments. So, here is the working of the Gold BeES:
- Every unit of Gold BeES is approximately equal to 0.01 grams of physical gold with a 99.5% purity. The fund manager invests in physical gold and other exchange traded gold derivatives, tracking price movements and ensuring good returns.
- ETFs offer their units to investors, which are then traded on the NSE or BSE to ensure transparency. You need a demat and a trading account for this.
- The BeES tracks the price of gold quite closely and ensures alignment with price movements consistently, resulting in low tracking error.
- Since there is no physical gold involved, the investor is freed from the worry of storing it.
- With a price of around ₹80, Gold BeEs allows new investors to invest in gold without much capital.
Here is a quick table comparing the returns of the Gold BeES to those of physical gold to better check its performance.
| 1 Year Return (%) | 3 Years Return (%) | 5 Years Return (%) | Since Inception Return (%) | |
|---|---|---|---|---|
| Nippon India ETF Gold BeES | 29.73 | 20.37 | 13.82 | 12.37 |
| Price of Gold | 31.31 | 21.65 | 14.95 | 13.47 |
So, the Gold BeES matches or tracks the movement of gold prices with returns equivalent to what the physical gold investment might offer you. This makes the scheme perfect for investors seeking to diversify their portfolio with gold.
Risks Associated with Gold BeES
Gold BeES faces the risk of gold price volatility. This means its value can fluctuate sharply based on various factors, including:
- Global gold prices
- Currency movements
- Economic or political events.
Though this is a liquid asset, there might be chances that the liquidity will be negatively impacted during extreme market conditions. This will make it harder to buy or sell at your desired price. Tracking error can increase during volatile market conditions, causing the fund’s returns to deviate from actual gold returns due to fund expenses and operational inefficiencies.
There’s also fund manager risk, as the ETF’s performance depends on the AMC’s efficiency. Changes in tax laws or regulations could impact returns in the future.
Understanding Gold ETFs
To understand Gold ETFs vs. Gold BeES, you must first know what each stands for. So, now that you know the meaning of Gold BeES, let us explore the Gold ETFs here.
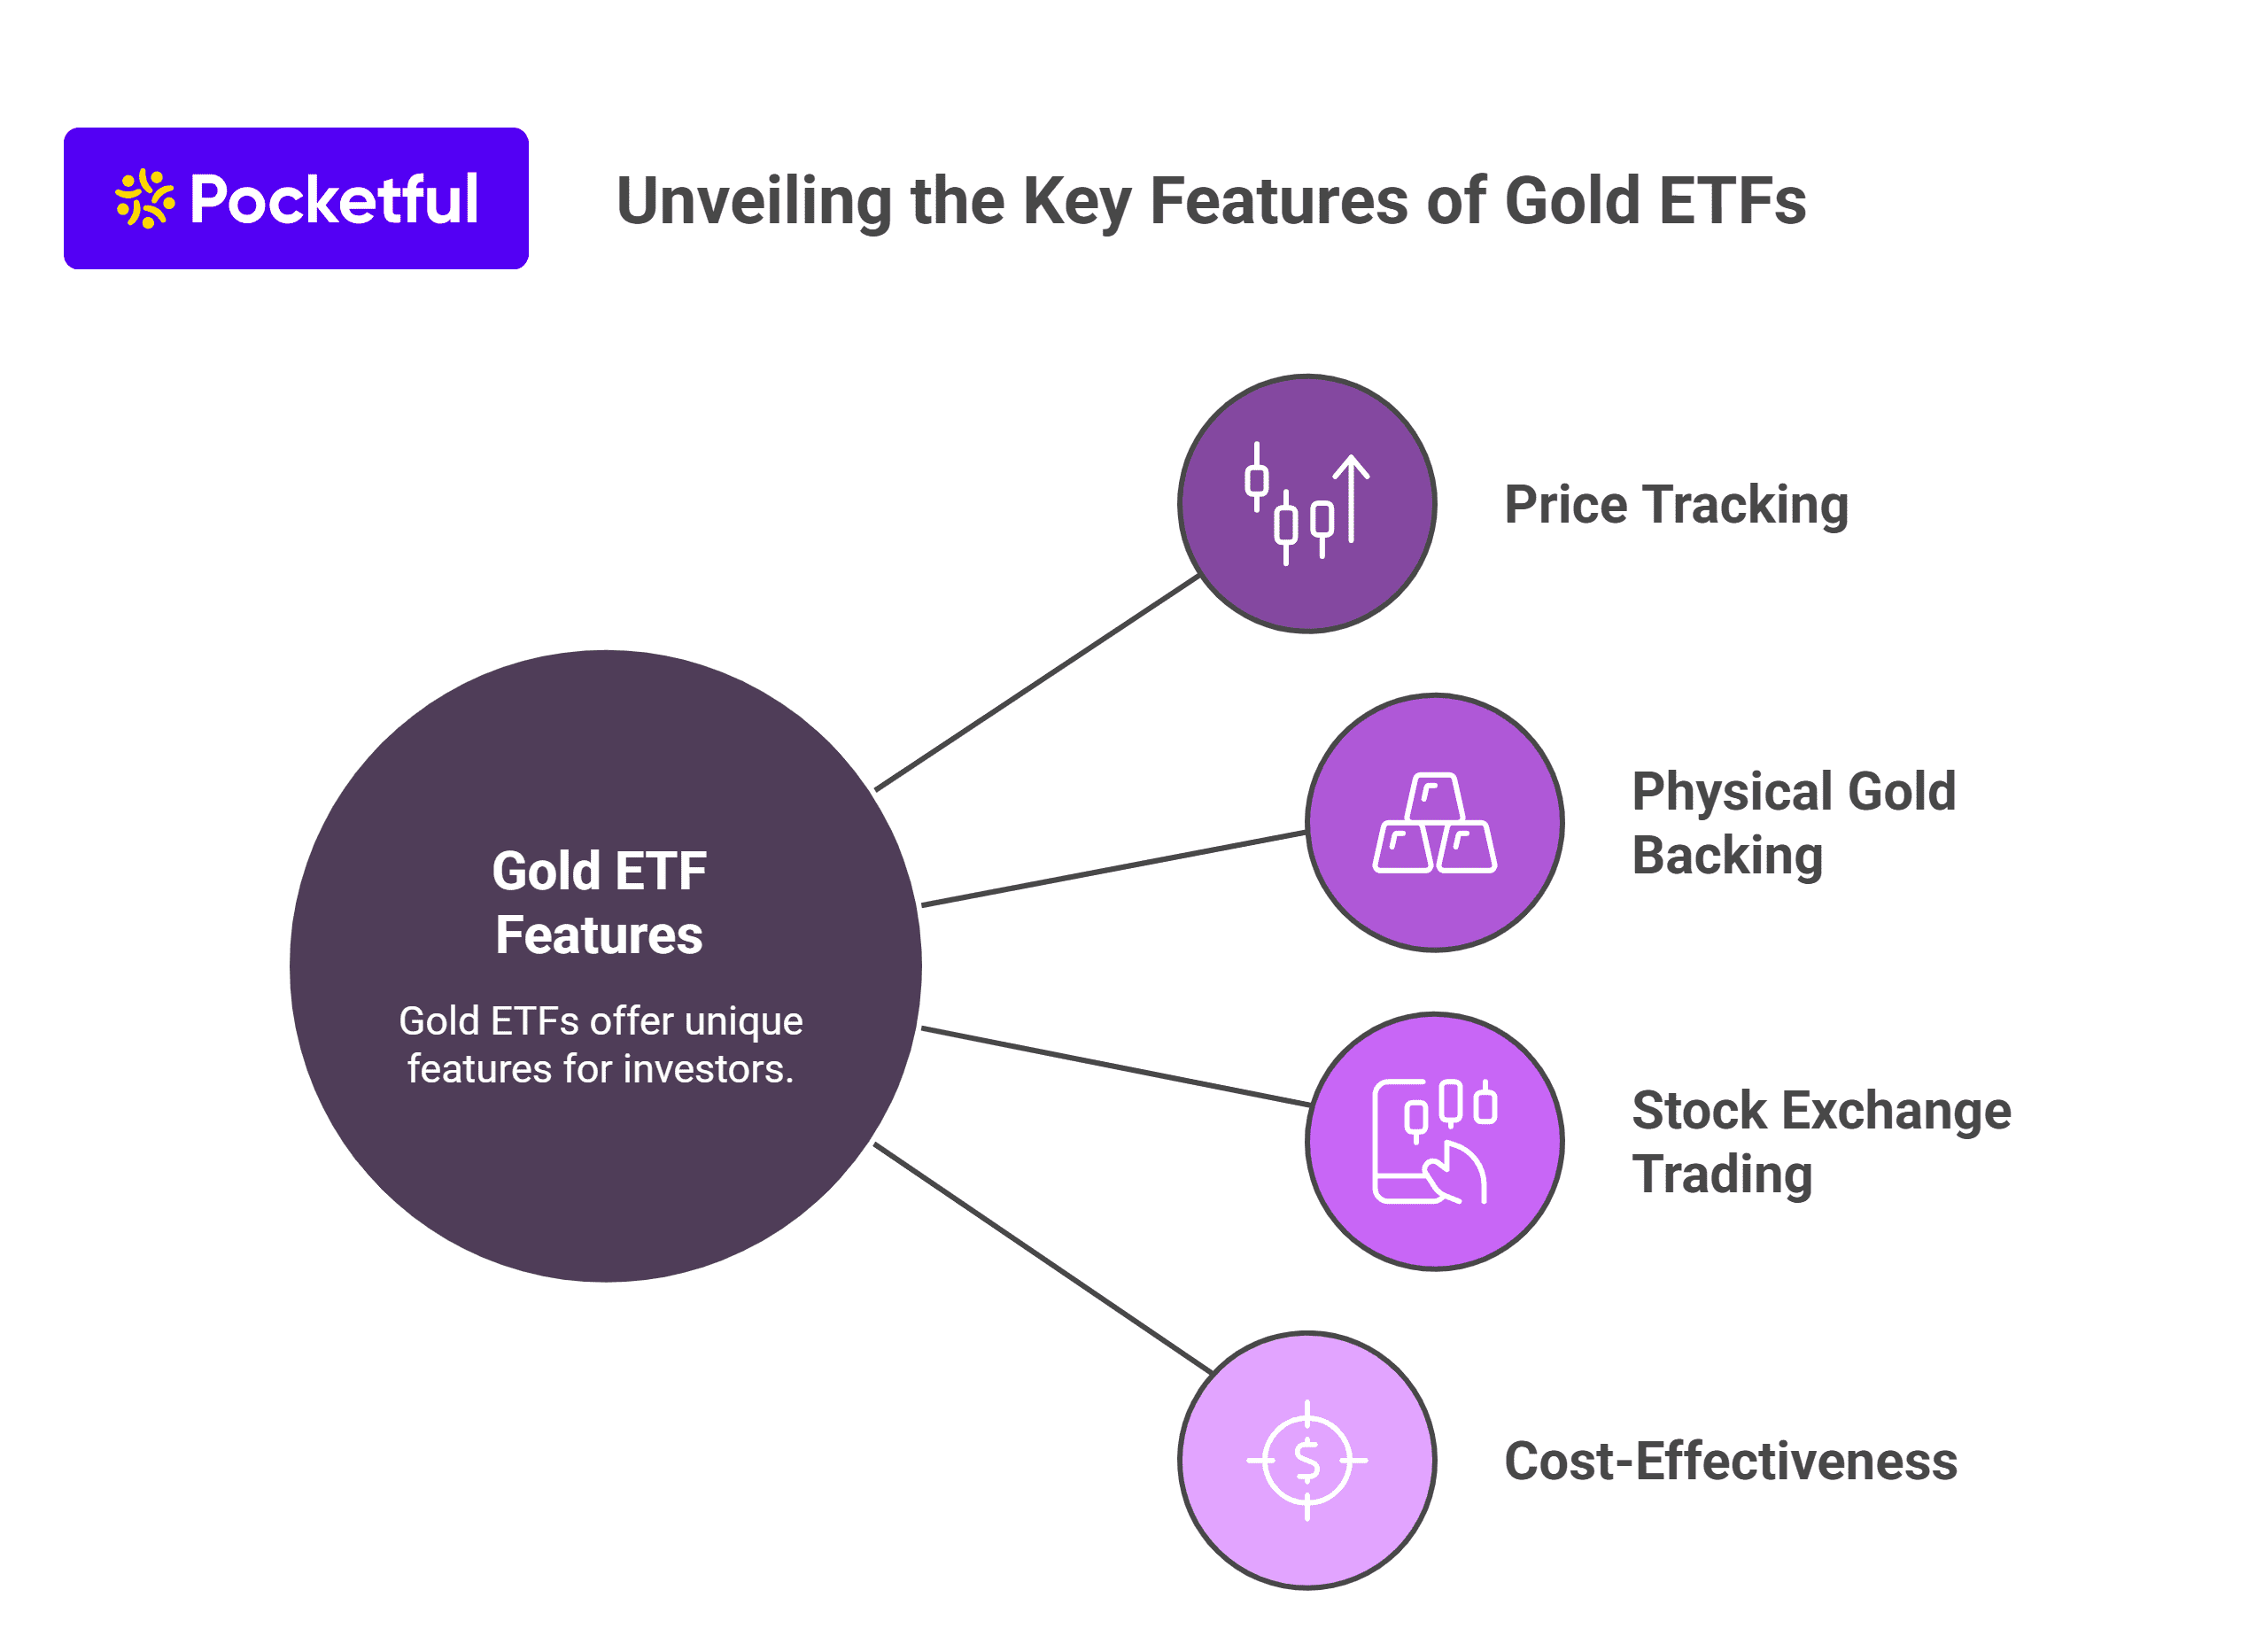
Gold ETFs are the exchange traded funds for the purpose of investment in gold. These are traded on stock exchanges and aim to track the price of physical gold. The primary features of these funds are as follows:
- These are listed on stock exchanges like the NSE and the BSE for trading.
- These are held electronically, so there is no hassle of storage.
- The funds track the price of physical gold.
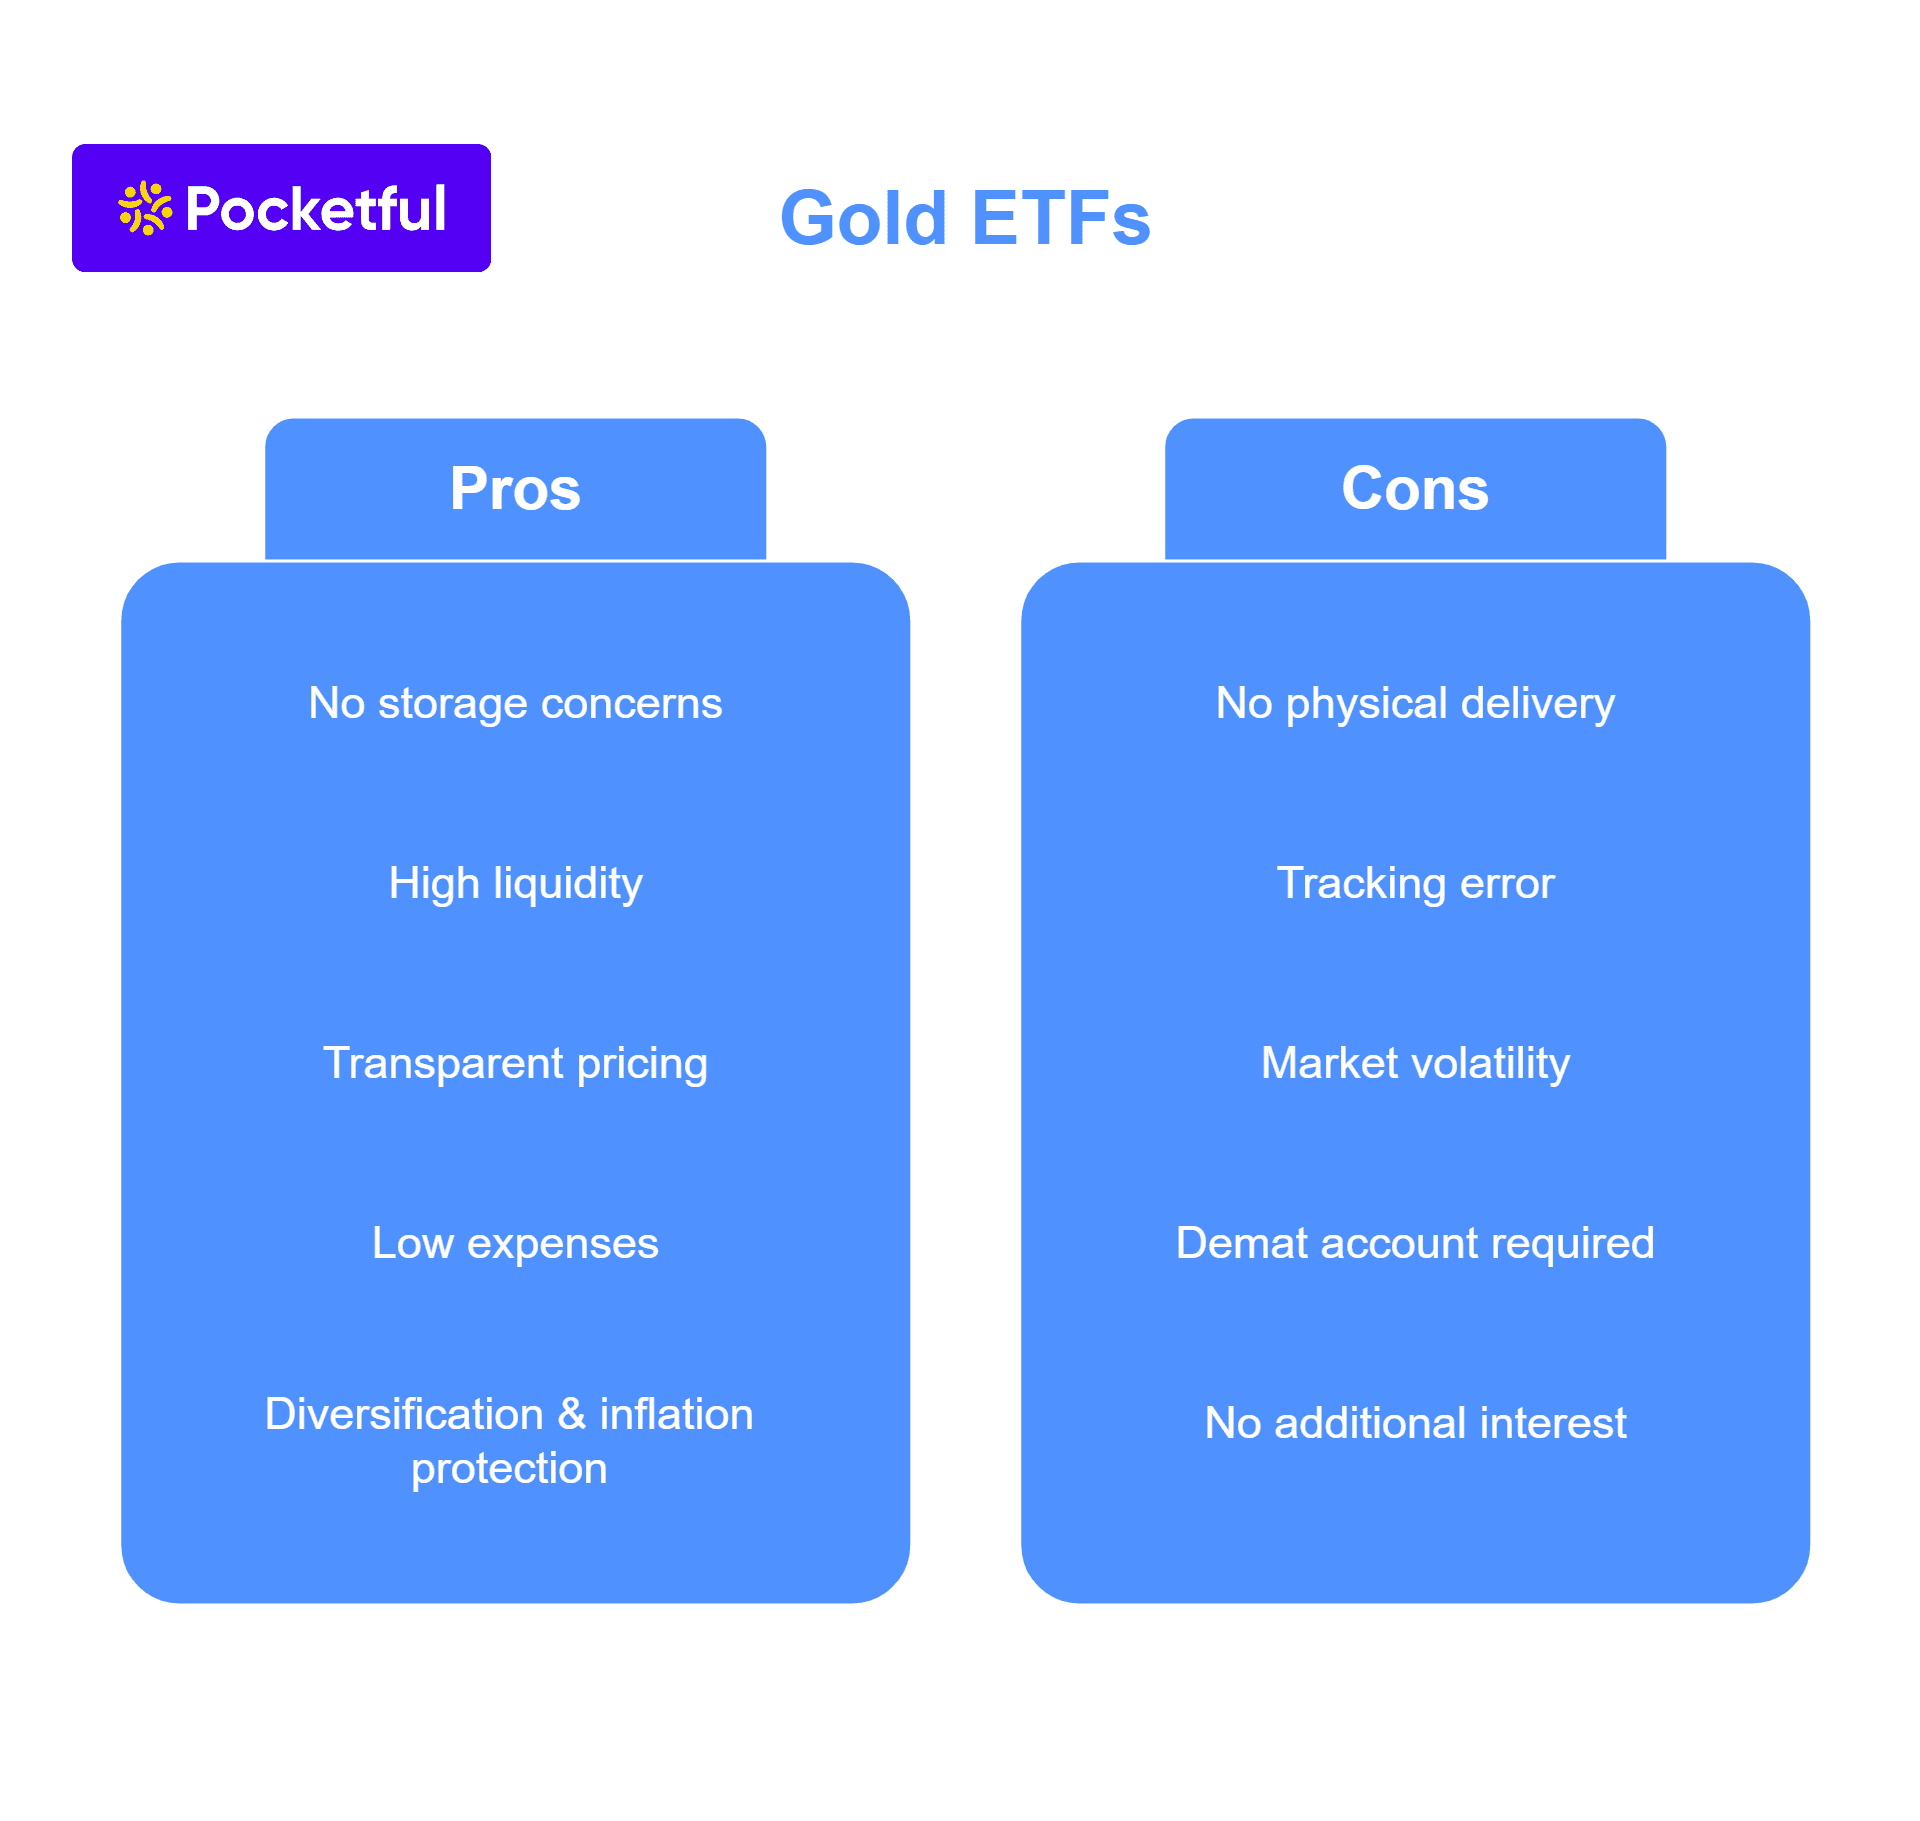
- Gold ETFs are liquid in nature. This means you can easily buy or sell them on stock exchanges without any hassle.
- The Gold EFTs involve no additional charges like making charges or storage costs, which makes them cost-efficient.
- These are good from the taxation point of view when held for a long duration.
- Investors can start with a small investment amount compared to investing in physical gold.
- Many financial institutions accept Gold ETFs as collateral for loans.
- There are no entry or exit load charges, making transactions cost-effective.
- Statutory auditors regularly audit the holdings and purity of gold held by Gold ETFs to ensure transparency and trust.
How Gold ETFs Work?
Before you invest in Gold ETFs, you must understand how they work as well. So, the fund works in a very simple manner with the aim of offering returns to the investors. Here are the details of working:
- These are traded on the stock exchanges during the trading hours. You can either buy or sell Gold ETF units based on your financial goals.
- Each unit represents a specific quantity of physical gold that the ETF holds either physically or through exchange traded derivatives.
- When you sell a unit, you get the cash amount equal to the physical gold value of that unit credited to your account.
- You would need to pay taxes on the amount that you earn based on certain conditions.
Though there are various Gold ETFs available in India, it is important to know the top ones. So, here are the top-performing funds that you can invest in:
| Fund Name | Inception Year | AUM (₹ Cr.) | Price (₹) | 1 Year Return (%) | 3 Year Return (%) | 5 Year Return (%) | Expense Ratio (%) |
|---|---|---|---|---|---|---|---|
| Axis Gold ETF | 2010 | 1,660.77 | 80.27 | 28.20 | 22.16 | 14.1 | 0.56 |
| Birla Sun Life Gold ETF | 2011 | 1184.63 | 84.57 | 27.85 | 22.06 | 13.92 | 0.47 |
| HDFC Gold ETF | 2010 | 9562.90 | 82.15 | 27.97 | 22.04 | 13.96 | 0.59 |
| ICICI Prudential Gold Exchange Traded Fund | 2010 | 7294.75 | 82.06 | 27.91 | 22.14 | 14.02 | 0.50 |
| Invesco India Gold Exchange Traded Fund Ltd. | 2010 | 277.77 | 8380.95 | 28.27 | 22.31 | 14.17 | 0.55 |
| Kotak Gold Exchange Traded Fund | 2007 | 7416.14 | 80.25 | 27.82 | 22.07 | 14.00 | 0.55 |
| Quantum Gold Fund | 2008 | 312.56 | 79.37 | 27.95 | 22.07 | 13.89 | 0.78 |
| UTI Gold Exchange Traded Fund Ltd. | 2007 | 1983.11 | 80.90 | 28.89 | 22.55 | 14.03 | 0.46 |
To further understand GoldBeES vs Gold ETF properly, let us now consider the taxation part.
Taxation of Gold ETFs and Gold BeES in India (2025)
When you invest in any asset, you must know the taxation part as well. This will ensure that you are managing your fund in the best manner and gaining the optimum outcome as well. So, when it comes to Gold BeES vs Gold ETF, the following will give you an idea of how the taxation works:
| Type | Short-Term Capital Gains (≤12 months) | Long-Term Capital Gains (>12 months) | Indexation | Other Taxes |
|---|---|---|---|---|
| Gold BeES | As per the income tax slab | 12.5% flat | No | No wealth tax, STT, VAT, or sales tax |
| Gold ETFs (all AMCs) | As per the income tax slab | 12.5% flat | No | No wealth tax, STT, VAT, or sales tax |
Risks Associated with Gold ETFs
Gold ETFs in India share similar risks to those of Gold BeES. They are highly sensitive to gold price volatility and macroeconomic factors. Liquidity risk can be higher in ETFs with lower trading volumes, making it difficult to exit at favorable prices.
Tracking error may be more pronounced in ETFs with higher expense ratios or less efficient fund management. The reputation and operational strength of the AMC matter; less established fund houses may carry higher risk. Like Gold BeES, all gold ETFs are subject to regulatory and taxation changes, which could affect their attractiveness or returns over time.
Who Should Invest in Gold BeES or Gold ETFs?
If you are looking to diversify your portfolio and want exposure to gold without dealing with physical storage or making charges, these options are ideal. Gold BeES and Gold ETFs are best suited for:
- Long-term investors looking for a safe hedge against inflation or currency fluctuations.
- Beginners who want to start small as Gold ETFs have low market prices, which allows even small investors to invest in gold.
- People who want the flexibility to buy or sell gold easily and quickly through their trading account.
How to Invest in Gold BeES or Gold ETF Using Pocketful?
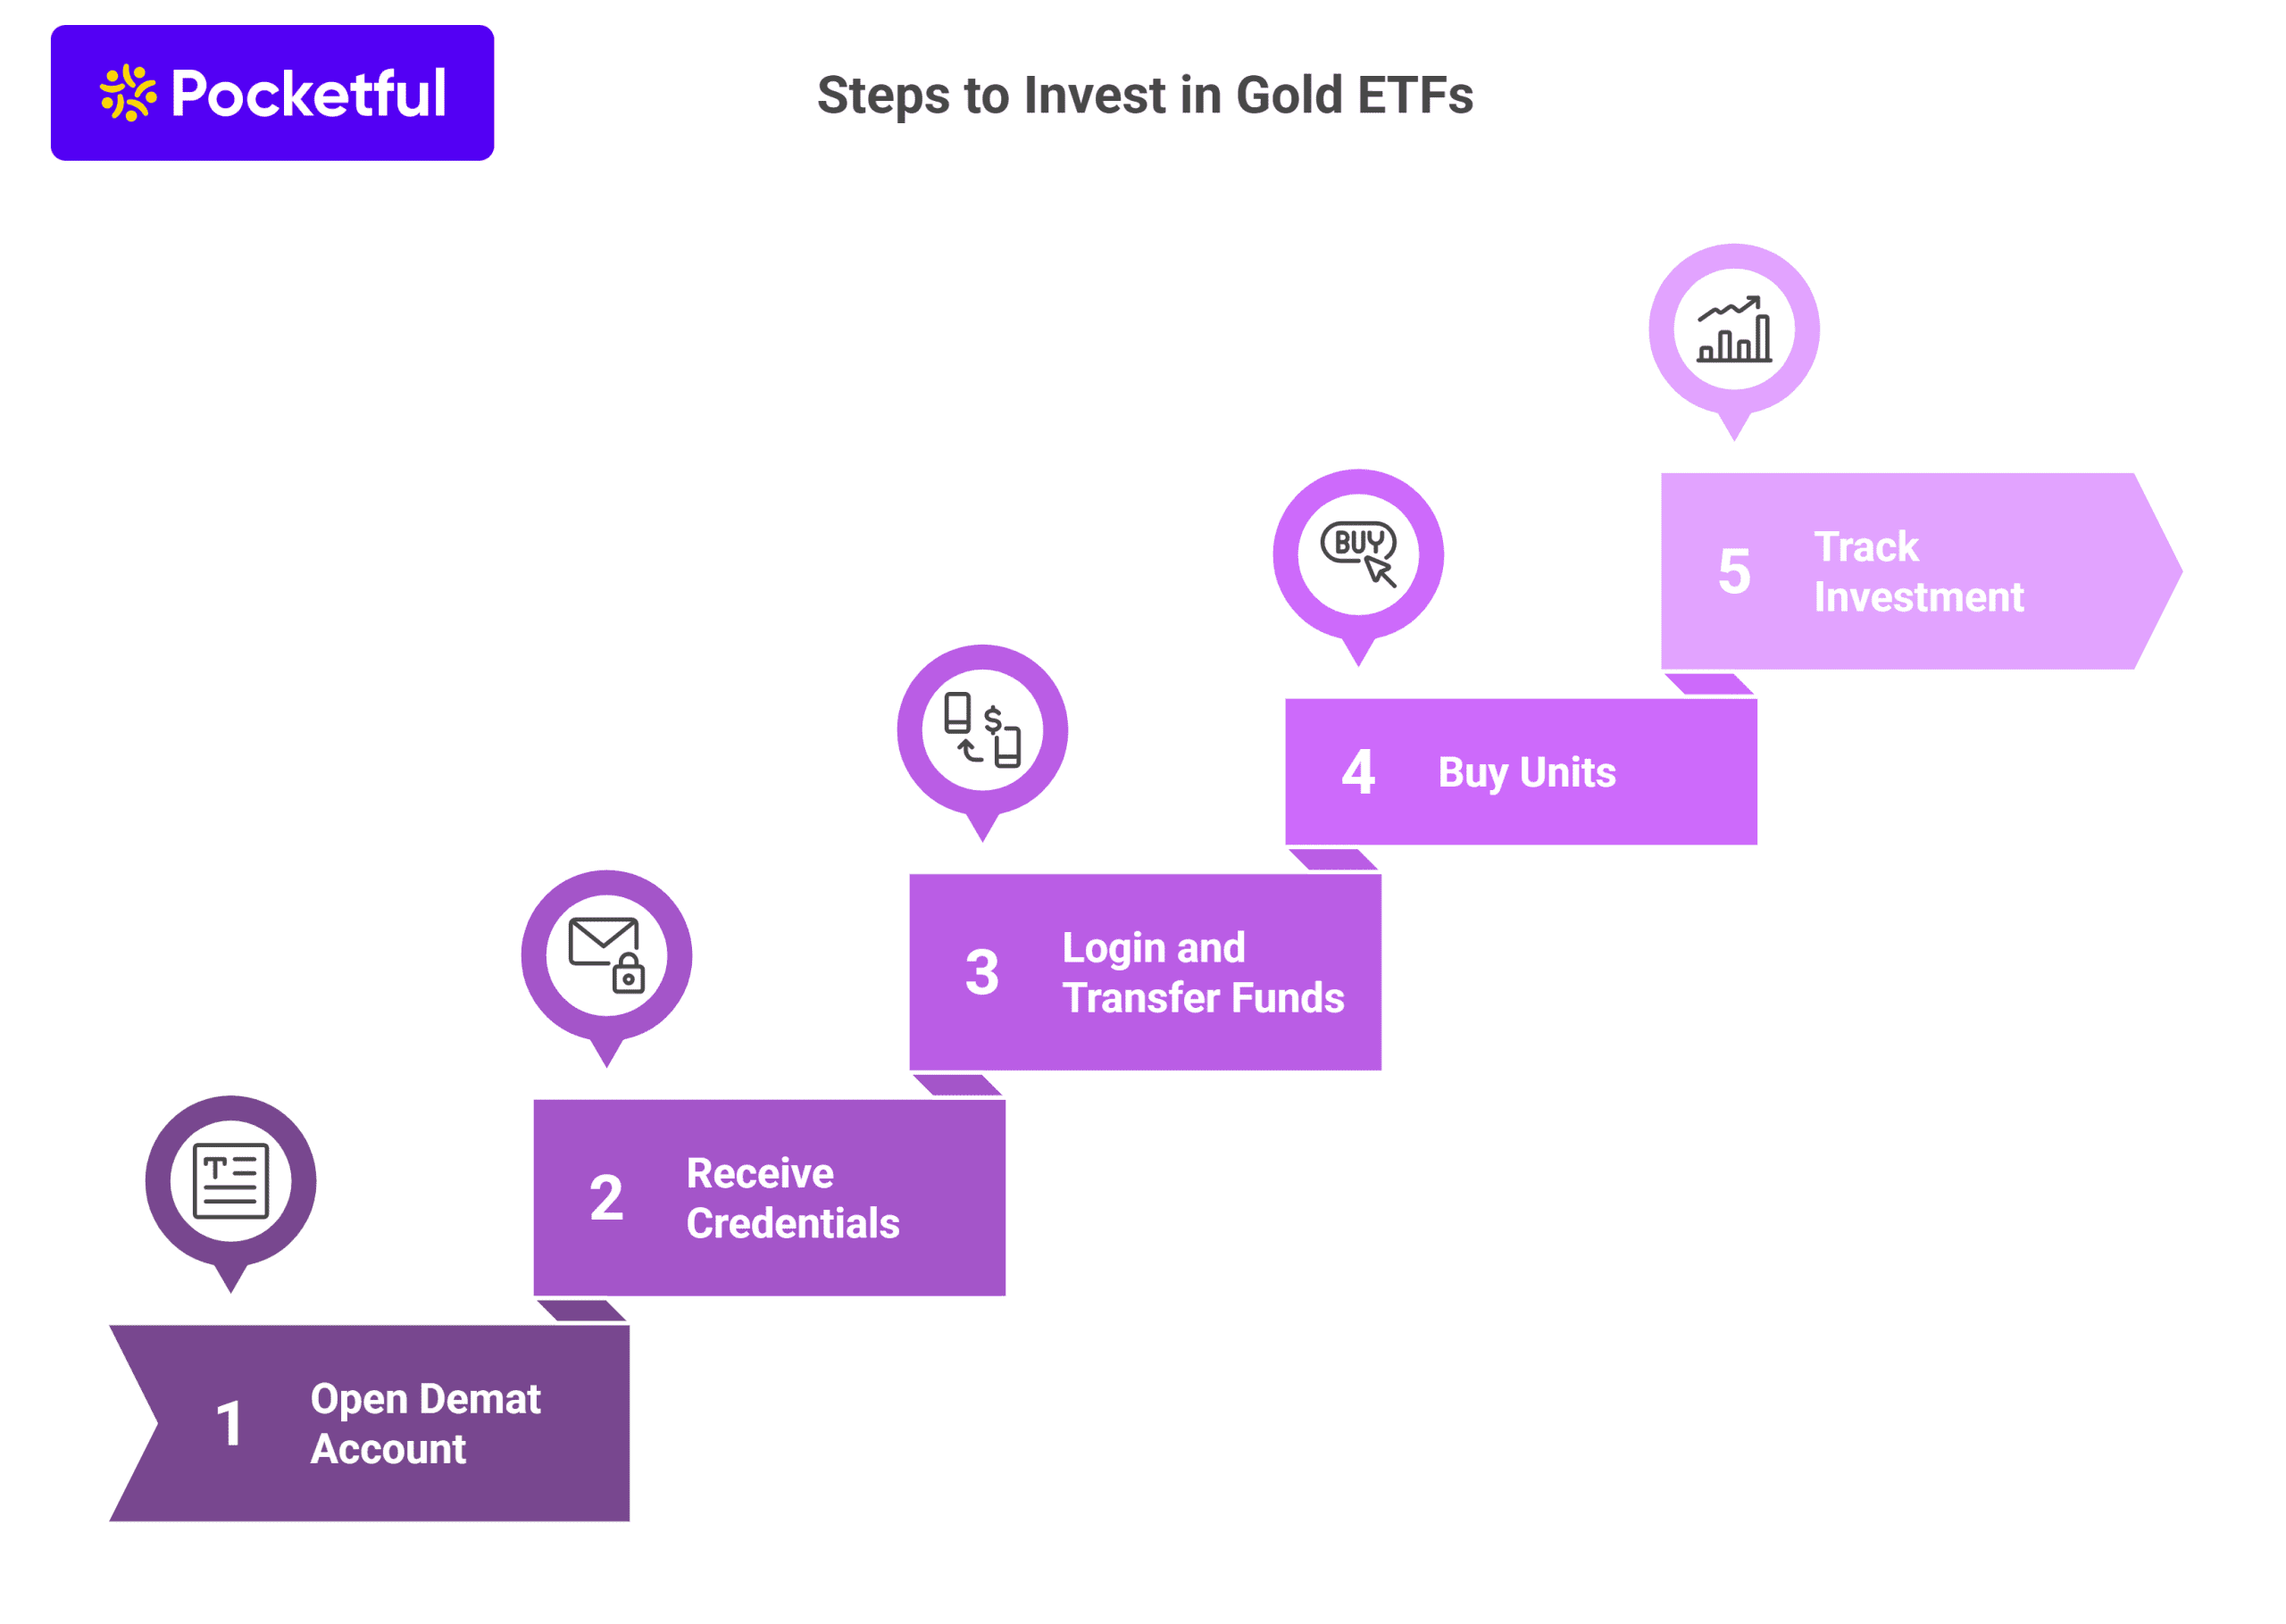
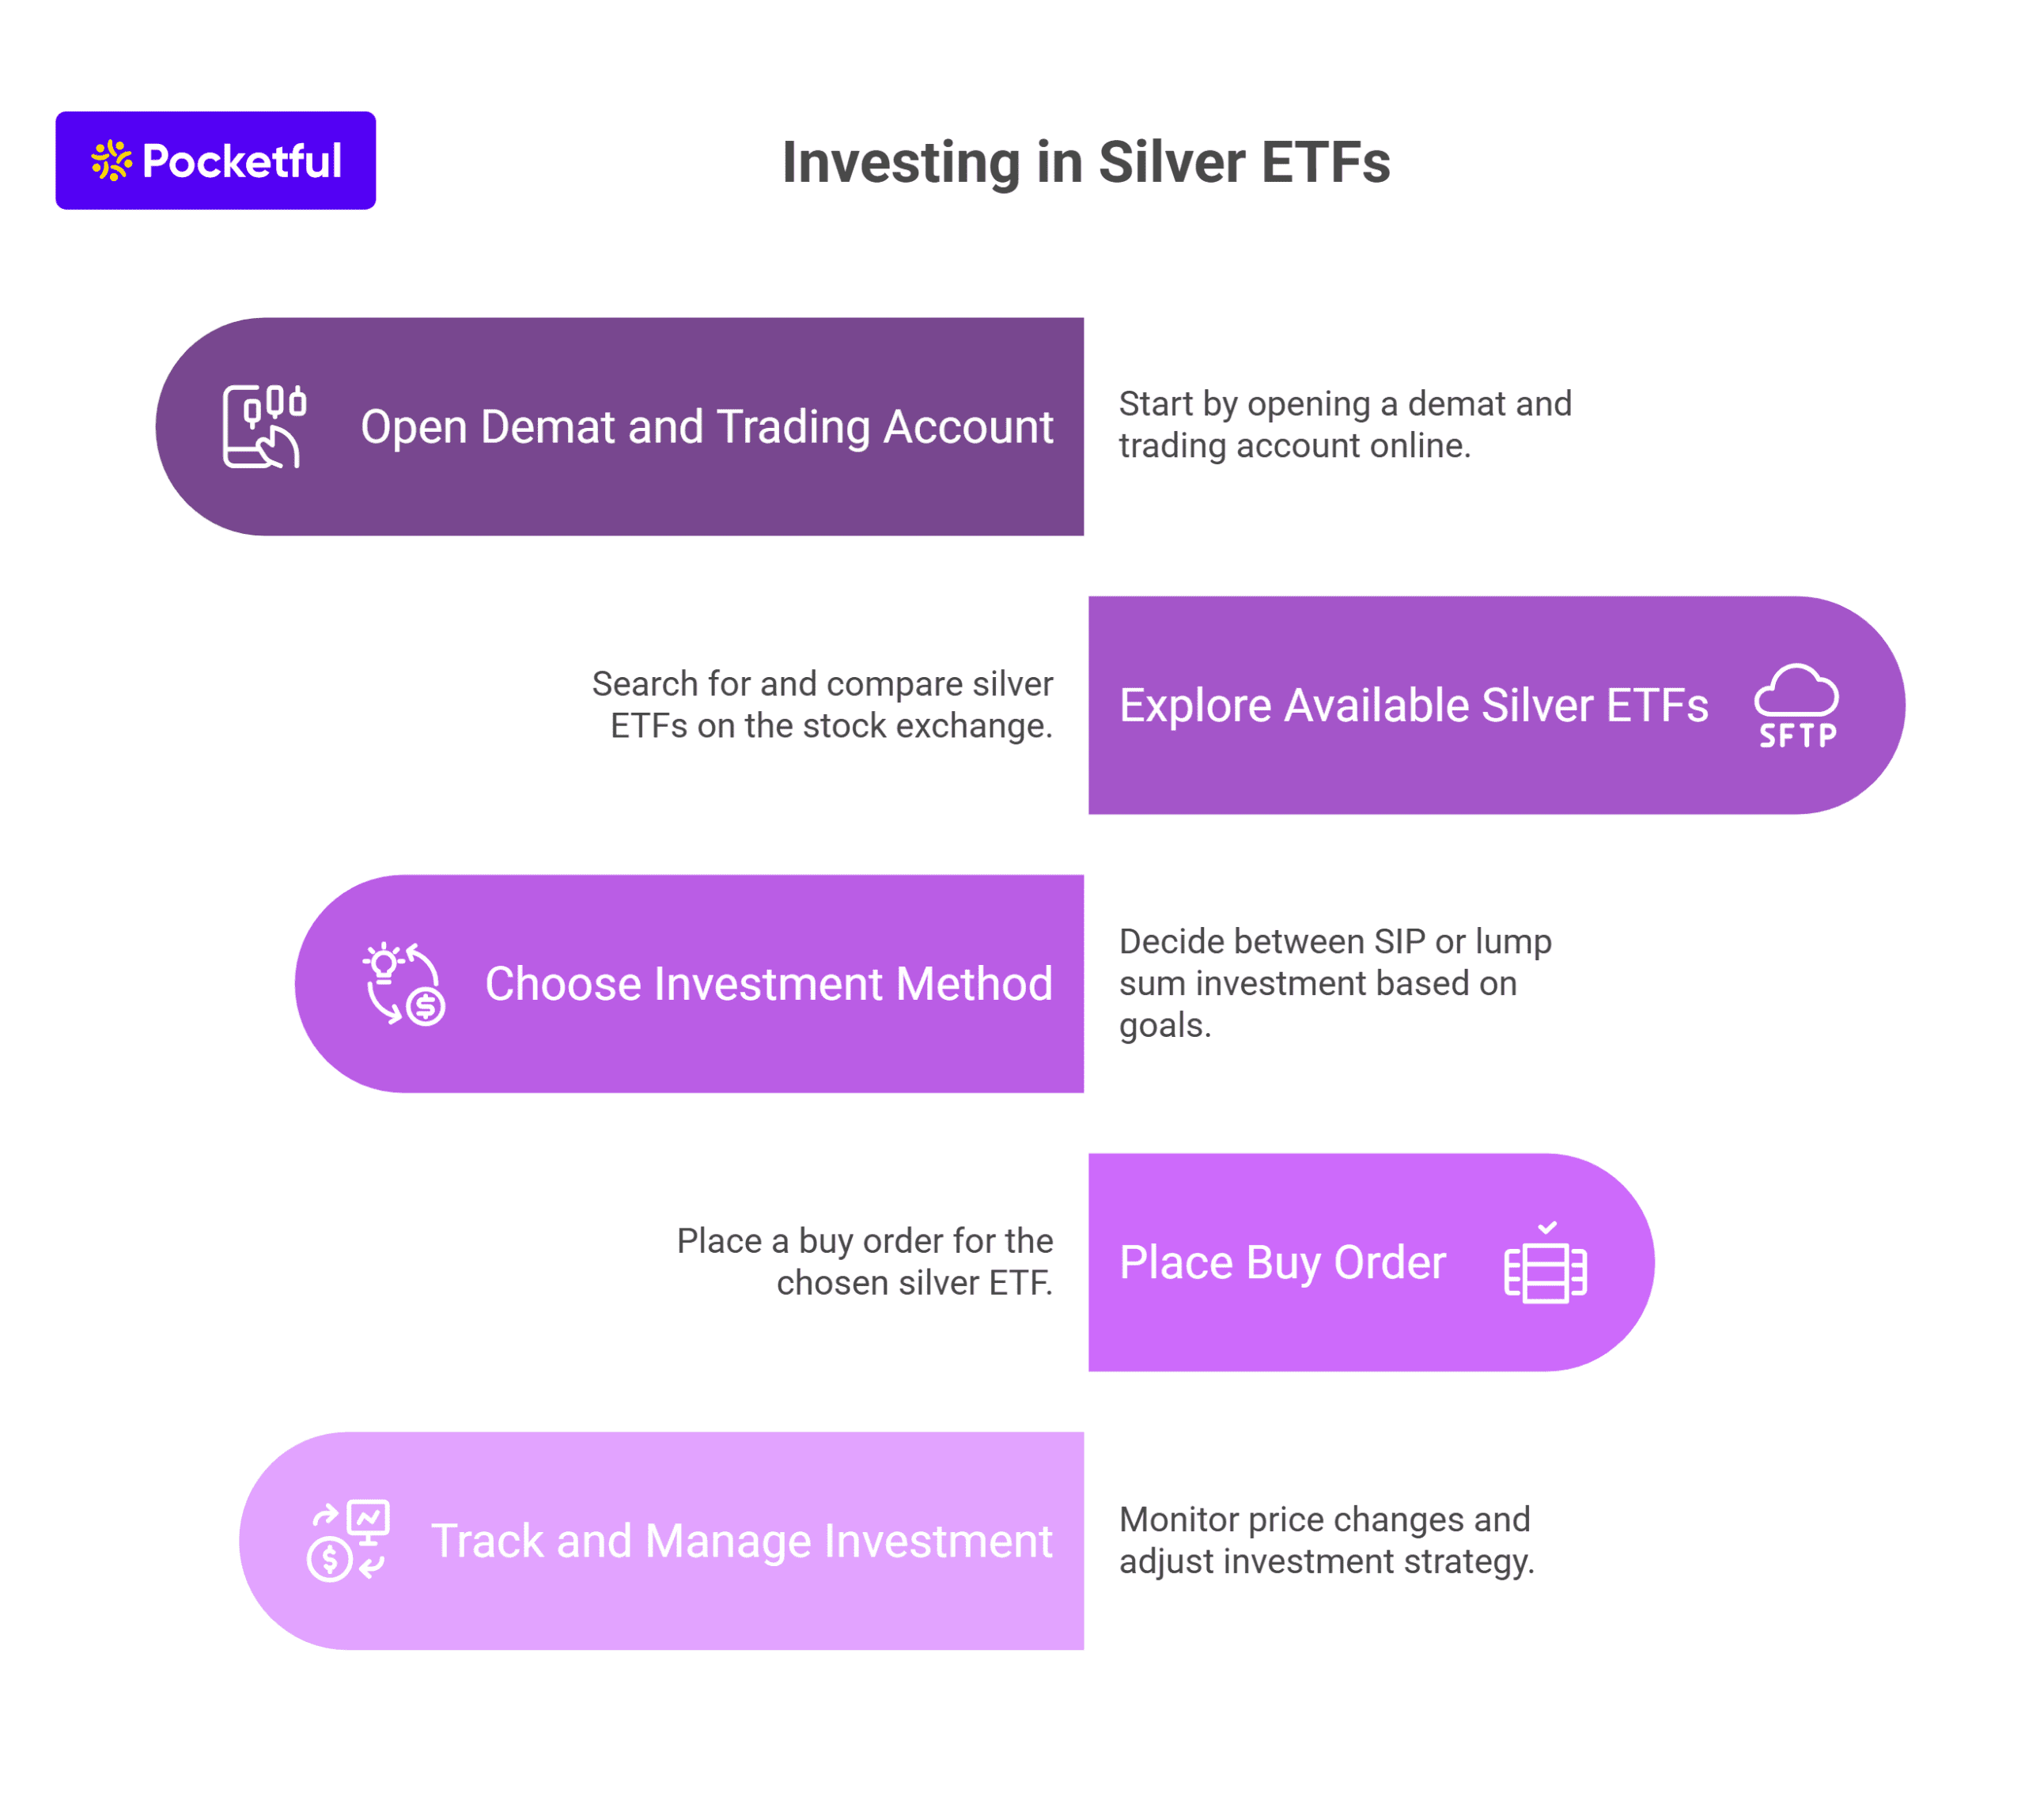
You can invest in Gold BeEs or Gold ETF using Pocketful by following the steps mentioned below:
- Visit the Pocketful website, click on ‘Open Demat Account’ and complete your KYC with PAN, Aadhaar, and bank details.
- After successful verification, your account will be opened and you will get login credentials on email.
- Login into Pocketful’s mobile application, transfer funds and search for the Gold ETFs or Gold BeES that you wish to invest in.
- Enter the number of units you want to buy click on buy.
- Track your investment regularly on the Pocketful’s user-friendly mobile application under your portfolio section.
Conclusion
Gold BeES vs Gold ETFs offers you a comparison between two investment tools for anyone looking to invest in gold digitally. While Gold BeES is a specific ETF offered by Nippon India, Gold ETFs represent a broader range of ETFs offered by multiple AMCs.
Your choice among the two depends on your investment size, fund preference, and low tracking error. ETF platforms like Pocketful, investing in gold has never been easier or more accessible. Take your first step toward building a balanced portfolio by adding digital gold the smart way. However, it is advised to consult a financial advisor before investing.
Frequently Asked Questions (FAQs)
Is Gold BeES the same as Gold ETF?
Gold BeES is similar to other Gold ETFs with one major difference that Gold BeEs is only offered by Nippon India Mutual Fund, whereas Gold ETFs are a broader category and are offered by various AMCs with different expense ratios.
Can I invest in Gold BeES without a demat account?
No. You need both a demat and a trading account to invest in Gold BeES or any Gold ETF, as these are traded on stock exchanges.
Which is better for beginners – Gold BeES or Gold ETFs?
Gold BeES is better for beginners due to its low price and low tracking error.
Are Gold ETFs and Gold BeES backed by physical gold?
Both invest in 99.5% pure physical gold and track domestic gold prices. Their value moves closely with the market price of gold.
How is tax calculated on Gold BeES and Gold ETFs?
If held for 12 months or less, gains are taxed as per your income tax slab. If held for more than 12 months, a flat 12.5% long-term capital gains tax applies.