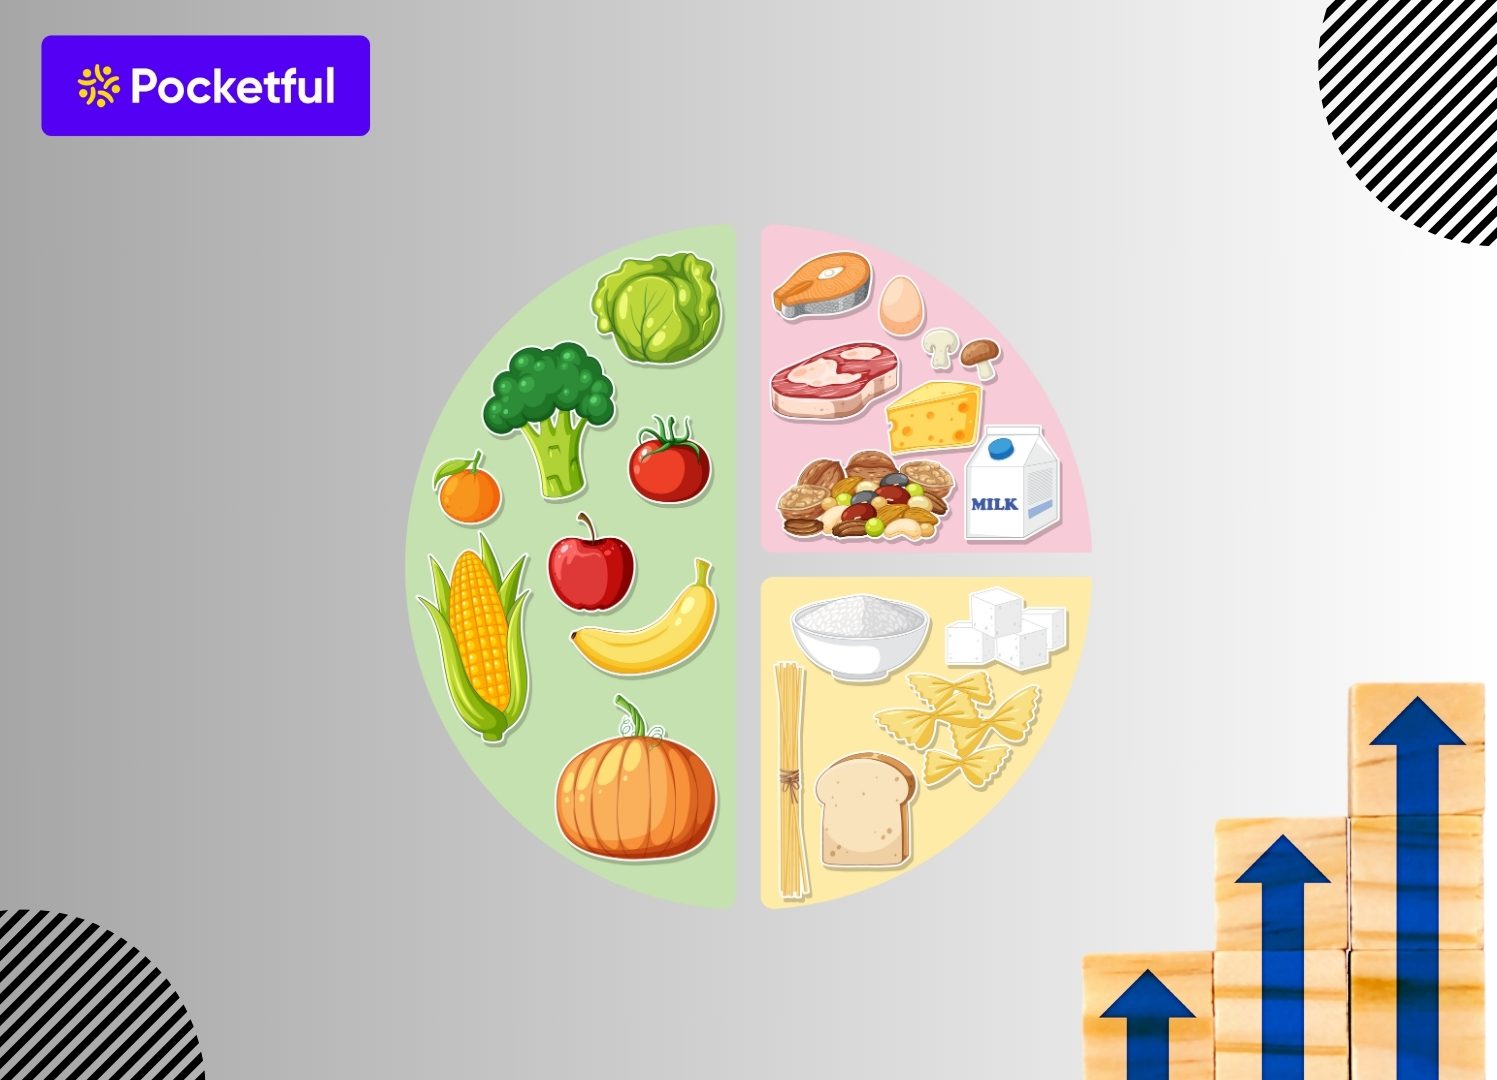
The food industry is the backbone of the Indian economy as it is responsible for bringing food to our table from the farmfields. With the increasing population of the country and the changing consumption habits of the people, the industry provides a lucrative investment opportunity. The food stocks are also considered a defensive investment opportunity, as they do not belong to the cyclical industry.
In this blog, we will give you an overview of the food industry, the benefits and factors that can directly impact its performance, and the top stocks related to this sector.
What are Food Stocks?
Food stocks are publicly traded companies that are primarily engaged in the production, processing, distribution, marketing, and selling of food and beverage items. Investing in such companies provides you with an opportunity to be a part of the growing food industry. These companies specialize in beverages, packaged foods, restaurant chains, processing, etc.
7 Best Food Stocks in India Based on Market Capitalisation
Here’s a curated list of the top 10 Food stocks in India for 2026 based on market capitalization:
| SO.N. | Company | Current Market Price (INR) | Market Capitalisation (in INR crore) | 52-Week High | 52-Week Low |
|---|---|---|---|---|---|
| 1 | Nestle India Limited | 1,312 | 2,53,014 | 1,340 | 1,055 |
| 2 | Britannia Industries Limited | 5,902 | 1,42,153 | 6,337 | 4,506 |
| 3 | Hatsun Agro Product Limited | 899 | 20,030 | 1,179 | 817 |
| 4 | Bikaji Foods International Limited | 658 | 16,489 | 821 | 520 |
| 5 | Godrej Agrovet Limited | 555 | 10,674 | 876 | 506 |
| 6 | Bombay Burmah Trading Limited | 1,746 | 12,181 | 2,174 | 1,521 |
| 7 | Avanti Feeds Limited | 1,078 | 14,688 | 1,130 | 582 |
A brief overview of the best food stocks in India is given below:
1. Nestle India Limited
Nestle is the world’s largest food and beverage company. Its success is driven by a diverse portfolio including dairy products, health and nutrition products, sweets, and processed foods, catering to both urban and rural consumers. Nestle India operates 9 factories across states like Punjab, Haryana, Himachal Pradesh, Goa, Karnataka, and Gujarat. Its headquarters are situated in Gurugram.
Know the Returns:
| 1Y Return (%) | 3Y Return (%) | 5Y Return (%) |
|---|---|---|
| 13.08% | 38.32% | 52.66% |
2. Britannia Industries Limited
Britannia Industries is one of the oldest bakery product companies, founded in 1892. It is part of the Wadia Group. The company’s products include biscuits, dairy products, cakes, breads, croissants, etc. The company has more than 15 plants across India, and exports to more than 80 countries in Asia, Africa, and the Middle East. The company’s headquarters are situated in Kolkata.
Know the Returns:
| 1Y Return (%) | 3Y Return (%) | 5Y Return (%) |
|---|---|---|
| 15.34% | 28.18% | 67.59% |
3. Hatsun Agro Products Limited
Hatsun Agro Products Limited was founded in 1970, and soon it became one of India’s largest private dairy companies. The company primarily operates in the southern region of India. The products of the company include milk, curd, ice cream, dairy products, beverages, etc. The company operates 20+ plants across the country, and has more than 10,000 outlets across the nation. The headquarters of the company are situated in Chennai, Tamil Nadu.
Know the Returns:
| 1Y Return (%) | 3Y Return (%) | 5Y Return (%) |
|---|---|---|
| -12.45% | 3.47% | 28.36% |
4. Bikaji Foods International Limited
Bikaji Foods International Ltd was founded in the year 1987 by Shiv Ratan Agarwal, who was a member of the Agarwal family behind the Haldiram’s. The company is known for Indian snacks and sweets. The company was established in Bikaner, which is the birthplace of bhujia. The products of the company include namkeen, bhujia, sweets, papad, frozen foods, etc. It has more than 6 lakh retail outlets across the country and operates in the USA, UK, and other countries.
Know the Returns:
| 1Y Return (%) | 3Y Return (%) | 5Y Return (%) |
|---|---|---|
| -10.37% | 74.89% | 103.66 |
5. Godrej Agrovet Limited
Godrej Agrovet Limited was incorporated in 1991 and is a part of Godrej Group’s venture into agribusiness. The company entered the food processing industry in 2000 and started an oil palm plantation in 2010. To expand their business, the company launched its IPO in 2017 and became a publicly listed company. It is one of the largest oil palm producers in India. The headquarters of the company are situated in Mumbai.
Know the Returns:
| 1Y Return (%) | 3Y Return (%) | 5Y Return (%) |
|---|---|---|
| 27.06% | 24.22% | 4.25% |
6. Bombay Burmah Trading Company Limited
Bombay Burmah Trading Corporation Ltd was founded in 1863 and is one of India’s oldest publicly traded companies. The group operates in various sectors, including plantation, dental products, healthcare, etc. It also made several significant investments in Wadia Group companies such as Britannia, as it holds around 51% stakes in Britannia Industries, which is a major contributor of revenue. The company’s headquarters is situated in Mumbai.
Know the Returns:
| 1Y Return (%) | 3Y Return (%) | 5Y Return (%) |
|---|---|---|
| -17.42% | 89.97% | 38.89% |
7. Avanti Feeds Limited
Avanti Feeds Ltd was incorporated in 1993 by the Alluri family as a shrimp feed manufacturing company. Later in 2011, it entered into shrimp processing and exported it to various other countries through Avanti Frozen Foods. The company launched its IPO in 2015 and became a publicly listed company. The company faced financial difficulty during the COVID-19 outbreak. It is the largest shrimp feed producer in India. The company’s headquarters is situated in Hyderabad.
Know the Returns:
| 1Y Return (%) | 3Y Return (%) | 5Y Return (%) |
|---|---|---|
| 49.89% | 175.86% | 104.93% |
Read Also: Best Battery Stocks in India
Key Performance Indicators (KPIs)
The key performance metrics of food companies are mentioned below:
| Company | Operating Margin (%) | Net Profit Margin (%) | ROE (%) | ROCE (%) | Debt to Equity |
|---|---|---|---|---|---|
| Nestle India Limited | 21.24 | 15.99 | 79.98 | 57.17 | 0.19 |
| Britannia Industries Limited | 17.28 | 12.19 | 50.01 | 59.40 | 0.28 |
| Hatsun Agro Product Limited | 6.42 | 3.20 | 16.23 | 18.25 | 1.22 |
| Bikaji Foods International Limited | 16.83 | 11.41 | 21.81 | 27.37 | 0.10 |
| Godrej Agrovet Limited | 6.75 | 3.72 | 18.04 | 19.12 | 0.54 |
| Bombay Burmah Trading Limited | 18.61 | 11.24 | 14.63 | 41.37 | 0.46 |
| Avanti Feeds Limited | 8.55 | 6.65 | 15.10 | 19.63 | 0.01 |
Benefits of Investing in Food Stocks
The significant benefits of investing in food stocks are as follows:
- Growing Demand: With the rise in urbanisation and changing consumption patterns of people, the demand for packaged foods and beverages is increasing very rapidly. This will directly benefit the food-related companies.
- Dividends: There are various food companies which regularly pay dividends to their investors. Hence, investors who are looking to invest in companies which declare dividends and wish to have a passive source of income can invest in food companies.
- Export-Oriented Business: The food companies are also engaged in export activities. Hence, they are not only dependent on the domestic market for revenue.
- Defensive Sector: The food industry is not cyclical in nature, like any other industry such as IT, Metal, etc. Therefore, having food stocks in your portfolio reduces the overall risk.
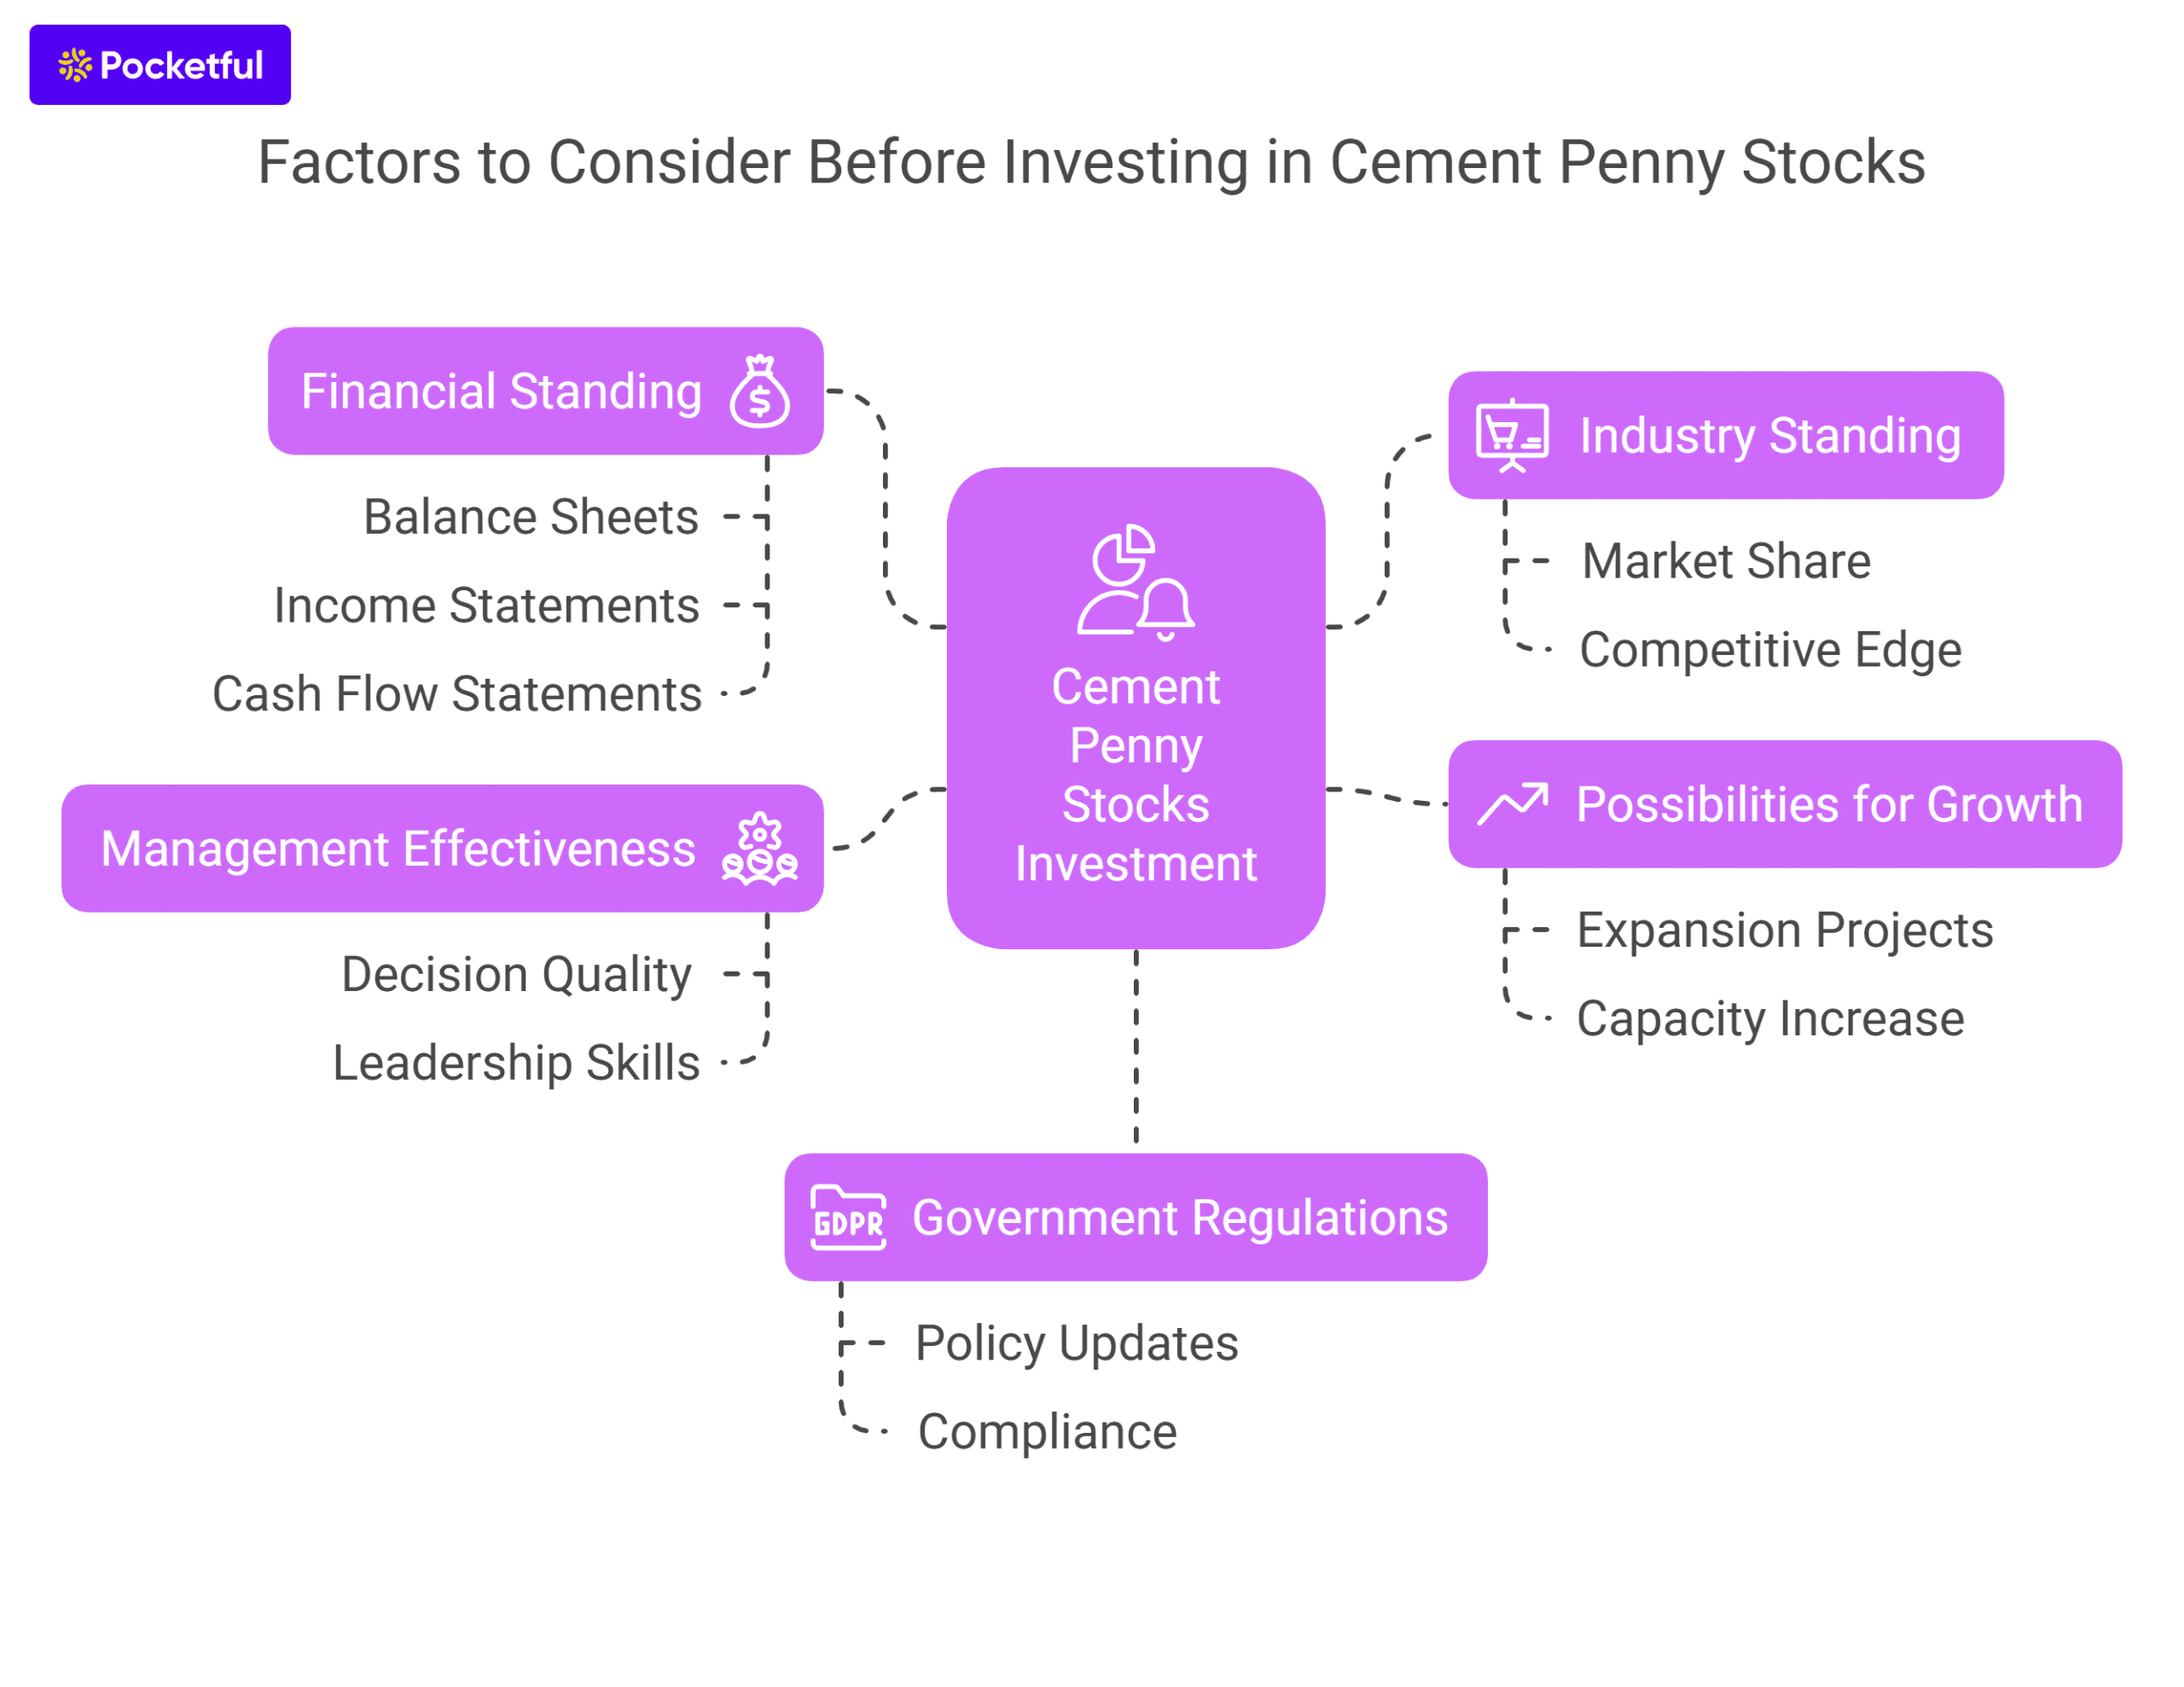
Factors to be Considered Before Investing in Food Stocks
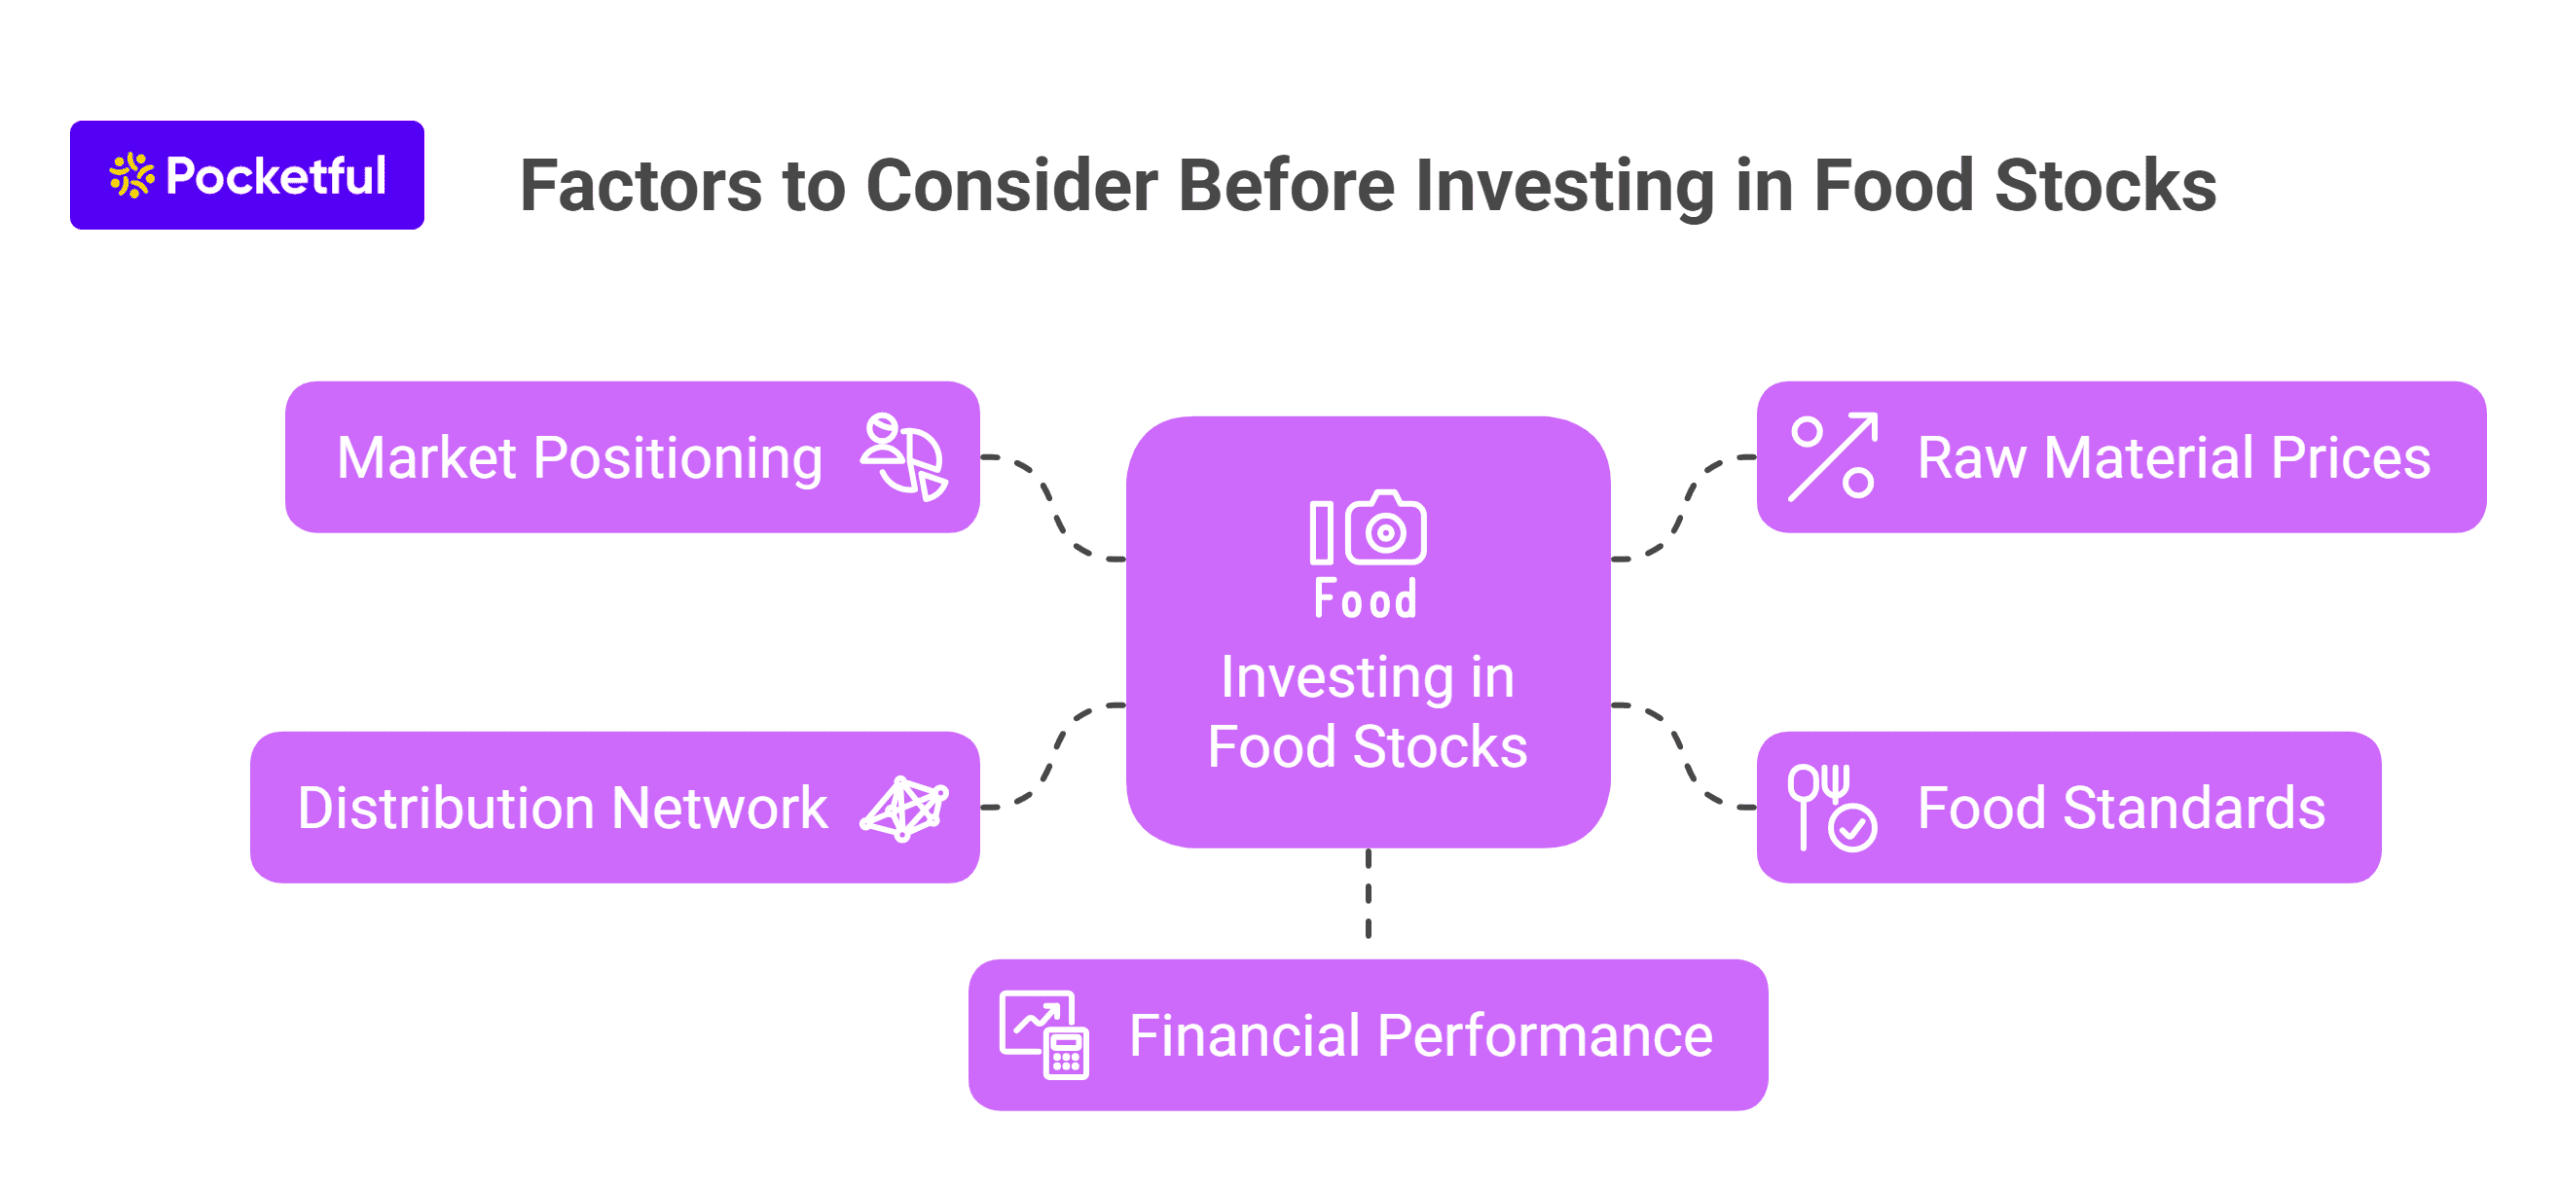
The key factors which one should consider before investing in food stocks are as follows:
- Market Positioning: The market share of the company plays an important role while choosing a food stock for investing. The company with a higher market share and serving the mass market will be beneficial for investment.
- Prices of Raw Materials: The change in prices of raw materials used by the food companies such as wheat, sugar, etc. will impact their profit margins.
- Food Standards: The food companies are required to maintain strict quality standards, which are issued by FSSAI or Food Safety and Standard Authority of India. If any company fails to maintain such standards, penalties will be levied on them.
- Distribution Network: The companies which have a strong distribution network or retail outlets will be suitable for investment. Hence, before investing in food stocks, one should consider this as a key factor for the same.
- Financial Performance: Checking the financial health is an important parameter that one should take into account. Companies with higher profit margins and revenue can be considered for investment.
Read Also: Best Construction Stocks in India
Future of Food Stocks
The growth of the Indian Food Industry is very promising because of increasing per capita income and disposable income in both rural and urban areas. The demand for packaged and processed food items has increased significantly in recent years. The food processing industry in India is expected to reach $535 billion by the end of the current financial year and $1,100 billion by FY35. Hence, investing in food stocks provides a good growth opportunity.
Conclusion
On a concluding note, the dynamics of the Indian food industry are changing very rapidly. With the rise of per capita income and urbanisation, this sector has shown exponential growth in recent years. Due to this, various national and international companies are entering into this sector. From packaged food to beverages, this sector has immense growth potential. However, the food industry is highly competitive. Therefore, one is required to conduct due diligence about the company’s financial, brand value, market share, and management before investing in it, and also consult their investment advisor regarding the same.
One can invest in food sector stocks very easily by opening a free demat account with Pocketful. It allows you to invest without paying any brokerage on equity delivery, and its advanced trading platform is equipped with various technical tools.
Frequently Asked Questions (FAQS)
How can I invest in food stocks?
You can easily invest in food stocks by opening a demat account with Pocketful as it offers you an opportunity to invest without paying any brokerage on equity delivery.
Which companies are the top food stocks in India?
The top food stocks based on the market capitalisation are Nestle India Limited, Britannia Industries Limited, Hatsun Agro Products Limited, Bikaji Foods Limited, Godrej Agrovet Limited, Bombay Burmah Trading Company Limited and Avanti Feeds Limited.
What are the major factors which can affect the performance of food stocks?
The major factors which can affect the performance of food stocks are the prices of raw materials, the financial performance of the company, product quality, the distribution network of the company, etc.
Are food stocks a defensive investment?
Yes, investment in food stocks is a defensive investment as the demand for food products is not directly influenced by changes in economic activities, and the demand remains stable even during economic downturns.
Do food stocks pay dividends?
Yes, various food companies, such as Nestle India and Britannia Industries Limited, regularly pay dividends to their investors.


![Top 10 Cement Penny Stocks in India Below ₹50 [2026 List]](https://cms-resources.pocketful.in/blog/wp-content/uploads/2025/04/cement-penny-stocks-in-india.jpg)