Category: Investing

  • Takeover vs Buyback: Key Differences

    Takeover vs Buyback: Key Differences

    Investors often hear both words in the share market and get confused. Both are associated with the purchase of the shares, but the end impact is different. The takeover impacts the company, while the buyback impacts the shareholders mainly.

    Understanding the difference between takeover and buyback is important. This will help you understand how your ownership will be impacted. It will guide you on how you should reach in both situations.

    This guide explains what is takeover, what is buyback, how each process actually works in the Indian market, and how to read the two events when they show up in your holdings.

    What Is Takeover

    A takeover happens when one company, or an individual acquirer, gains control of another company. This is usually done by buying a controlling stake in its shares. Most of the time, when 25% or more voting rights are taken over as per the SEBI’s regulations, we call it a takeover.

    Control can be acquired through various ways, such as:

    • Open market purchases
    • Negotiated deal with existing promoters
    • Mandatory open offer to public shareholders

    In India, takeovers are governed by the SEBI (Substantial Acquisition of Shares and Takeovers) Regulations, 2011. It is commonly called the Takeover Code. Once an acquirer crosses the 25% threshold or seeks to gain control regardless of shareholding, the code requires a public announcement.

    Also, an open offer to buy at least 26% of the target company’s shares from public shareholders at a regulator-defined price needs to be made. This protects minority shareholders by giving them a chance to exit at a fair price rather than being left holding shares under a new, unknown management.

    Types of Takeover

    • Friendly takeovers is the one where the target company’s management and board support the acquisition. They all negotiate terms jointly, making the process simpler and quicker.
    • Hostile takeovers are situations where the acquirer bypasses the target’s management. They directly make an appeal to the shareholders. This is often through an open offer at a premium to the market price.
    • Reverse takeovers are situations where a smaller company acquires a larger one. It is often used to gain a stock exchange listing. This is done without going through a traditional IPO.

    For shareholders, a takeover usually means one of two things: 

    • An open offer that lets you sell your shares at a set price.
    • A change in company ownership and strategy.

    What Is Buyback

    A buyback is formally a share repurchase. It is when a company buys back its own shares from existing shareholders. The company does this to reduce the outstanding shares. It helps in the valuation as well. 

    The company uses its own cash reserves to do this. All the shares bought back are typically extinguished, permanently reducing the total share count. This is beneficial for those who have shares in the market already, as they get more control.

    Buybacks in India are governed by the SEBI (Buy-Back of Securities) Regulations, 2018. 

    The companies can execute them through two routes:

    1. Tender Offer Route

    Here, the company announces a fixed price. It is usually at a premium to the market price. The shareholders can tender their shares proportionately based on their holdings

    2. Open Market Route

    The company buys back shares gradually through the stock exchange over a specified period. This is without a fixed price announced in advance.

    Companies typically announce a buyback in the following situations:

    • When management believes the stock is undervalued.
    • If there is surplus cash sitting idle with no better investment opportunity.
    • When the company wants to return value to shareholders in a more tax-efficient way.

    A buyback also improves key ratios like earnings per share, since the same profit gets divided among fewer outstanding shares.

    In buyback, there is no change in the company. Promoters and public shareholders continue to hold the company in roughly the same relative proportion, minus whichever shareholders chose to sell into the buyback.

    Difference Between Takeover and Buyback: Side by Side

    FactorTakeoverBuyback
    Who initiates itAn external acquirer or another companyThe company buying back its own shares
    Effect on controlOwnership and control change handsControl generally stays with existing promoters
    Effect on share countUsually unchangedReduces total outstanding shares
    Governing regulationSEBI Takeover Code, 2011SEBI Buy-Back Regulations, 2018
    Shareholder actionMay need to respond to an open offerCan choose to tender shares or stay invested
    Typical market reactionPrice often jumps toward the open offer pricePrice often rises on reduced supply and signal of confidence
    Company’s cash positionUnaffected directly, since acquirer paysCompany cash reserves reduce
    FrequencyRare, event-driven, tied to a specific acquirer’s interestMore common, can recur across multiple years

    The difference between takeover and buyback comes down to one question: where is the money actually coming from or going to? A takeover is about a change of hands. A buyback is about a change of scale.

    Why the Distinction Matters for Investors

    Confusing the two events leads to two common mistakes.

    The first mistake is assuming every corporate action that lifts the share price is the same kind of opportunity. A takeover open offer is usually a one-time exit price set by regulation, and once it closes, the stock’s future depends entirely on the acquirer’s plans, which may or may not benefit remaining shareholders. A buyback, by contrast, is management signaling confidence in the existing business using its own operating cash, and the company continues to run under the same leadership and strategy afterward.

    The second mistake is misreading intent. A hostile takeover attempt can sometimes trigger a company to announce a defensive buyback, buying back shares specifically to reduce the number of shares available for the acquirer to purchase and to make the takeover more expensive. In this case, the two events appear together, but they are still fundamentally different tools serving different purposes, one changing control and the other defending it.

    Reading quarterly filings, exchange announcements, and open offer documents carefully, rather than reacting to headlines alone, is the only reliable way to tell which of the two events you are actually looking at.

    How to Track These Corporate Actions as a Trader

    Both takeovers and buybacks move stock prices quickly once announced, so timing and information quality matter.

    • Exchange filings on NSE and BSE websites carry the original public announcement for both events, well ahead of most news coverage.
    • SEBI’s SAST disclosures list every substantial acquisition and takeover trigger as it crosses the regulatory threshold.
    • Record dates and tender periods for buybacks are published in advance, giving existing shareholders a clear window to decide whether to tender shares.
    • Open offer price versus market price is the number to track during a takeover, since the market price often converges toward the open offer price as the deadline approaches.

    A trading platform with reliable corporate action alerts and a fast order execution system matters here, since the price gap between an announcement and the market’s full reaction can close within minutes of trading resuming. Traders using Pocketful can track these announcements alongside live price action and place orders through Scalper Mode when a corporate action creates a fast-moving opportunity, rather than relying on delayed news feeds.

    Conclusion

    The difference between takeover and buyback is really a difference in direction. In a takeover, an outsider is buying control, and shares typically stay in issue while ownership changes hands. In a buyback, the company itself is buying back its own shares, keeping control exactly where it was. Either way, both options have a direct impact on the company and the shareholders.

    For traders, it is important to understand how these work. This will help them to know what impact it will have on their portfolio. This is where platforms like Pocketful can help. They can guide you through the process and share the insights as needed.

    Frequently Asked Questions (FAQs)

    1. What is a takeover in simple terms? 

      A takeover is when one company or investor gains control of another company. This is mainly by buying enough shares, usually 25% or more. This influences or directs its management and decisions, often triggering a mandatory open offer to public shareholders under SEBI’s Takeover Code.

    2. What is a buyback in simple terms? 

      A buyback is a simple process of purchasing shares back. The company repurchases its own shares from existing shareholders. It does this by using its own cash. This reduces the total number of shares outstanding. It is done when company feels that shares are undervalued.

    3. Does a buyback change who controls a company? 

      No, a buyback does not usually change control. Promoters and remaining shareholders continue to hold the company in roughly the same manner. Here, the company is simply reducing its own share count. There is no transfer of ownership to the new company. The company usually clears all the shares that they buy, making them null.

    4. Is a takeover always good news for shareholders? 

      Not always. A takeover can bring a premium open offer price in the short term, but the stock’s longer-term outlook depends entirely on the new acquirer’s strategy, which may or may not align with what benefited shareholders under the previous management.

    5. Can a company use a buyback to prevent a hostile takeover?

      Yes, a company can announce a defensive buyback to reduce the number of shares available in the market. This can make it more expensive and difficult for a hostile acquirer to gain a controlling stake. But it is important to understand that both are different situations.
  • What is the Nifty IT Index?

    What is the Nifty IT Index?

    If you’ve been tracking Infosys or TCS results every quarter and wondering how the broader tech sector is doing, the Nifty IT Index is the number you should be watching. Ten companies. One index. It tells you whether Indian IT is having a good run or a rough patch, without you having to check 10 different stock prices. This article breaks down what the index is, what’s inside it right now, and what actually makes it move.

    The Basics First

    The Nifty IT Index is a sectoral index of the National Stock Exchange (NSE) that tracks the performance of leading information technology companies listed on the exchange.

    It includes some of India’s largest IT and technology service companies that derive a significant portion of their revenues from software services, consulting, business process management, cloud solutions, and digital technologies. The index currently consists of 10 major companies from the Indian IT sector and is maintained by NSE Indices.

    Simply put, if India’s IT sector performs well, the Nifty IT Index generally moves higher. If the sector faces challenges such as lower global demand or slower technology spending, the index may come under pressure.

    What’s Inside the Nifty IT Index

    Ten stocks make up the entire index. All of them are software, IT services, or IT-enabled businesses listed on the NSE. Here’s the official composition as per NSE Indexogram data dated June 30, 2026:

    Infosys leads the index at 30.41%, followed by TCS at 20.48%. Together they account for over 50% of the index weight. HCL Technologies and Tech Mahindra follow at 11.16% and 10.84% respectively both significantly higher than what many investors expect.

    CompanyWeightage (%)
    Infosys Ltd.30.41
    Tata Consultancy Services Ltd.20.48
    HCL Technologies Ltd.11.16
    Tech Mahindra Ltd.10.84
    Wipro Ltd.5.94
    Persistent Systems Ltd.5.71
    Coforge Ltd.4.88
    LTIMindtree Ltd.3.99
    MphasiS Ltd.3.48
    Oracle Financial Services Software Ltd.3.12

    This concentration matters in practice. On a day when Infosys drops 4% after a weak quarterly result, the nifty IT index falls roughly 1.2% from that one stock alone, even if everything else holds flat. Understanding this helps you make sense of sharp intraday index moves without panicking.

    NSE applies weightage caps at every rebalancing; no single stock can exceed 33%, and the top three stocks combined cannot cross 62% of the total index weight. These limits prevent one company from dominating so heavily that the index stops being a sector tracker and becomes a single-stock proxy.

    Index Returns as of June 30, 2026

    This part is worth sitting with for a moment. The official NSE return data from the Indexogram report paints a clear picture of where the index stands:

    PeriodPrice Return (%)
    QTD (Quarter to Date)-9.51
    YTD (Year to Date)-30.58
    1 Year-32.48
    5 Years (CAGR)-2.05
    Since Inception (CAGR)20.03

    The 1-year return of -32.48% and YTD of -30.58% reflect the significant pressure on Indian IT stocks through 2025-26. US tech spending cuts, a stronger rupee eating into dollar-denominated revenues, and repeated earnings downgrades from majors like TCS and Infosys drove the index down sharply from its highs.

    The 5-year CAGR of -2.05% tells you the index has essentially gone nowhere on a 5-year basis. But the since-inception CAGR of 20.03% puts that in context this index has compounded at 20% annually since 1996, making it one of the strongest long-run performers among NSE’s sector indices. Short cycles of underperformance are part of that story.

    The nifty IT index also has a standard deviation of 23.57% over 1 year, which signals meaningful volatility. It has a Beta of 0.76 against Nifty 50 over 1 year and 0.95 over 5 years  meaning it moves slightly less than the broader market in short windows but tracks it closely over longer periods.

    How the Index Value Is Calculated

    The nifty information technology index uses the periodic capped free-float methodology. Here’s what that actually means.

    Free-float means only publicly tradeable shares are counted. Promoter holdings, government-locked shares, and strategic cross-holdings are excluded. So the index measures what the open market is actually pricing not the full issued share capital.

    Periodic capping means the weightage caps described earlier are applied at each rebalancing point, not continuously. Between rebalancing dates, weightages drift with price changes. At the next review, they get reset.

    The formula:

    Index Value = (Current total free-float market cap of all 10 stocks ÷ Base market capitalisation) × Base Value

    As the 10 stocks trade throughout the day, their combined free-float market cap changes every second. The index divides that by the fixed base market cap and multiplies by the base value to give you the live index level.

    Corporate actions, bonus issues, stock splits, rights offerings are adjusted for so they don’t create artificial jumps or drops in the index level on the day they happen.

    Who Gets Into the Nifty IT Index

    Not every IT company listed on the NSE qualifies. The selection criteria from NSE’s official methodology:

    • The company must be part of the Nifty 500 at the time of review. If eligible IT stocks within Nifty 500 fall below 10, NSE can pull from the top 800 universe ranked by average daily turnover and market capitalisation over the previous 6 months.
    • The company must be classified under the IT sector as per NSE’s industry classification.
    • Trading frequency must be at least 90% in the last six months — meaning the stock should have traded on at least 9 out of 10 trading days.
    • Minimum listing history of 1 month as on the cutoff date.
    • Final selection of 10 companies is based on free-float market capitalisation. Preference is given to companies already available in NSE’s Futures & Options segment.

    The rebalancing cut-off dates are January 31 and July 31 each year. NSE uses average data from the six months ending on those dates. Four weeks’ prior notice is given to the market before any constituent change takes effect so there’s no surprise on the change date.

    A three-tier governance structure manages the index, the Board of Directors of NSE Indices Limited, the Index Advisory Committee (Equity), and the Index Maintenance Sub-Committee. Changes don’t happen arbitrarily; they go through this framework.

    Index Fundamentals (June 30, 2026)

    MetricValue
    P/E Ratio17.26
    P/B Ratio4.72
    Dividend Yield3.48%

    A P/E of 17.26 is notably lower than where Indian IT stocks were trading in 2021–22 when many names were at 30–40x earnings. The correction has brought valuations back to more reasonable territory. A dividend yield of 3.48% is relatively high for an equity index, reflecting that the sharp price fall has pushed yields up. These numbers matter when deciding whether the current level represents fair value or whether there’s more downside risk.

    What Actually Moves This Index

    1. The Dollar-Rupee Exchange Rate

    India’s big IT firms, Infosys, TCS, HCL, and Wipro, earn the bulk of their revenue in US dollars from North American and European clients. Every dollar they earn gets converted to rupees when reported in Indian accounts. A weaker rupee means more rupees per dollar, so earnings look better even if business volume hasn’t changed. When the rupee strengthens, the same dollar revenue shrinks in rupee terms. Currency movement is a variable that directly feeds into margins, and the Nifty Technology Index reflects it.

    2. US and European Tech Spending

    This is the primary driver. Indian IT is a service export industry. When US companies tighten budgets, IT is among the first spending categories cut or deferred. The 2022–23 slowdown showed this clearly: rising US inflation pushed the Fed to hike aggressively, enterprises pulled back on outsourcing and digital transformation spend, and Indian IT companies reported slower deal wins for six consecutive quarters. The it index followed all the way down.

    3. RBI and Fed Rate Cycles

    Rate decisions on both sides affect the index. RBI rate cuts lower borrowing costs domestically and encourage technology investment. US Fed rate hikes tighten corporate budgets and reduce the appetite for outsourcing new projects. The Fed’s cycle tends to have a more direct impact, given how large North American revenues are for the top four IT companies in the index.

    4. FII Flows Into Indian IT

    Foreign institutional investors hold large positions in TCS, Infosys, and HCL. When global risk sentiment shifts, recession fears, geopolitical tension, US rate signals. FIIs reduce emerging market holdings, and Indian IT gets sold first because it’s among the most liquid. These outflows create sharp short-term index moves that don’t necessarily reflect underlying business changes.

    5. Government Spending on Technology

    Domestic revenue from government contracts, defence technology, railway IT systems, and public health digitisation has grown meaningfully for some IT companies. The Union Budget 2024-25 allocated ₹1,16,342 crore toward IT and telecom, signalling continued public sector demand. This doesn’t move the index on a single day, but it shapes the medium-term revenue visibility for companies that have strong government client exposure.

    How to Get Exposure to the Nifty IT Index

    You can’t buy the index itself. But there are several practical routes.

    Buying individual stocks is the most direct. You pick TCS, Infosys, HCL Tech, or any other constituent and hold them in your Demat account. The trade-off is that you’re making active stock calls rather than tracking the sector as a whole, and managing 10 positions individually takes more effort.

    IT sector mutual funds give you active management. A fund manager decides which technology stocks to overweight; they may hold names outside the 10-stock index basket too, so performance will diverge from the Nifty IT index. Worth it if you believe active management adds value in this sector.

    Index funds replicating the Nifty IT index hold exactly the same 10 stocks in the same proportions. No active calls. Lower expense ratios. If your view is simply “I want clean IT sector exposure,” this is the most efficient route.

    IT ETFs work like index funds but trade on the exchange during market hours at live prices rather than end-of-day NAV. Useful for investors who want to enter or exit at specific price points intraday.

    Futures and options contracts exist for the Nifty IT Index for those who want to hedge existing IT holdings or take directional leveraged positions. Not a product for long-term retail investors without derivatives experience.

    Things to Think About Before Investing

    Ten stocks in one sector. That is the entire index. There’s no cushion from other parts of the economy when IT goes through a rough period, and the current data shows what a rough period looks like. YTD returns of -30.58% with no diversification buffer are a real experience that investors in IT sector funds faced through 2025–26.

    Infosys at 30.41% and TCS at 20.48% together make up over half the index. A bad earnings quarter from either company moves the index meaningfully. That’s not sector diversification in the traditional sense; it’s concentrated exposure to two businesses.

    The P/E of 17.26 is low by historical IT standards, which could mean the sector is attractively valued after the correction. Or it could mean earnings expectations are still being revised downward. Both interpretations are valid, and which one you believe should inform whether this is a time to enter or wait.

    Currency exposure is embedded in every IT investment. You’re taking a view on rupee-dollar dynamics, whether you’re thinking about it or not.

    How to Invest in IT Sector Funds Through Pocketful

    Step 1: Create Your Account

    Download the Pocketful app and sign up.

    • Enter your mobile number and verify with OTP
    • Set your login credentials
    • Access your dashboard

    Step 2: Complete Your KYC

    The entire process is online and paperless.

    • Add PAN and Aadhaar details
    • Enter bank account information
    • Complete digital verification

    Step 3: Pick Your IT Fund

    Browse IT sector mutual funds, stocks and ETFs on the platform.

    • Compare expense ratios and rolling returns vs the Nifty Technology Index benchmark
    • Check fund portfolio overlap with the Nifty IT Index
    • Choose a direct plan for a lower cost

    Step 4: Start Investing and Track

    • Start a SIP or lump sum in your chosen IT fund
    • Track NAV movement and portfolio performance from the dashboard
    • Review against the index benchmark every 6–12 months

    Conclusion

    The Nifty IT Index has been tracking India’s technology sector since 1996, compounding at 20% annually since inception despite going through multiple severe corrections along the way. The current setup- 10 stocks, Infosys and TCS making up over half the weight, YTD returns deep in negative territory, reflects both the structural strength of Indian IT and the cyclical pressures the sector faces right now. Before investing in any fund benchmarked against the Nifty Information Technology Index, knowing the return data, the concentration, and what drives the index up and down helps you hold through the rough patches rather than exit when it hurts most.

    Start investing in IT sector mutual funds through Pocketful, with zero commission on mutual fund investing, so more of your returns stay with you.

    S.NO.Check Out These Interesting Posts You Might Enjoy!
    1What Is iNAV in ETFs?
    2How to Pledge ETFs for Margin in India
    3What are Bond ETFs?
    4What Is Nifty ETF?
    5What Is Nifty 50? How To Invest In It?

    Frequently Asked Questions (FAQs)

    1. How many stocks are in the Nifty IT Index? 

      Ten. All of them are IT sector companies listed on the NSE. The composition is reviewed in June and December each year.

    2. Can I invest directly in the Nifty IT Index? 

      No. You invest through index funds, ETFs, sector mutual funds that track or invest in the same stocks, or by buying individual constituents directly.

    3. Is this the same as Nifty 50? 

      No. Nifty 50 has 50 stocks across 13 sectors. The Nifty IT Index has 10 stocks, all from the IT sector only. They’re entirely different indices.

    4. When does the IT index get rebalanced? 

      Twice a year, in June and December. Changes take effect from the last Thursday of the review month.

  • Top 10 Richest Companies in the World

    Top 10 Richest Companies in the World

    Nearly every industry today intersects with a small group of companies that dominate global markets. Several of the applications on your phone, the chip powering your laptop, and the cloud servers storing your data likely trace back to one of the richest companies in the world. These firms are not distant, abstract corporations, they are deeply embedded in everyday technology and infrastructure. Many people searching for the world richest company name are simply trying to identify which single company sits at the very top of this list.

    This ranking is based on market capitalization, using current 2026 data. The following sections outline the top 10 companies, the factors behind their positions, and considerations to keep in mind before assuming today’s leaders will remain unchallenged.

    What Actually Decides Who’s “Richest”?

    Quick clarification before we get into it. When people type in world’s richest company, they usually mean market cap, not revenue, and definitely not profit, even though folks mix those up all the time.

    Market cap itself isn’t some complex formula. Share price times shares outstanding. Done. It’s basically the market placing a bet on what a company is worth today, nothing more permanent than that.

    Compare that to:

    • Revenue: everything a company sells, before a single expense gets subtracted
    • Net profit: what actually remains once bills, taxes, and overhead are paid
    • Assets: the cash, buildings, and equipment a company owns outright

    A supermarket chain can move enormous volumes of revenue and still land well below a tech company selling a fraction of that. Feels counterintuitive, sure. But it’s exactly why chipmakers and cloud businesses have taken over this ranking.

    Top 10 Richest Companies in the World

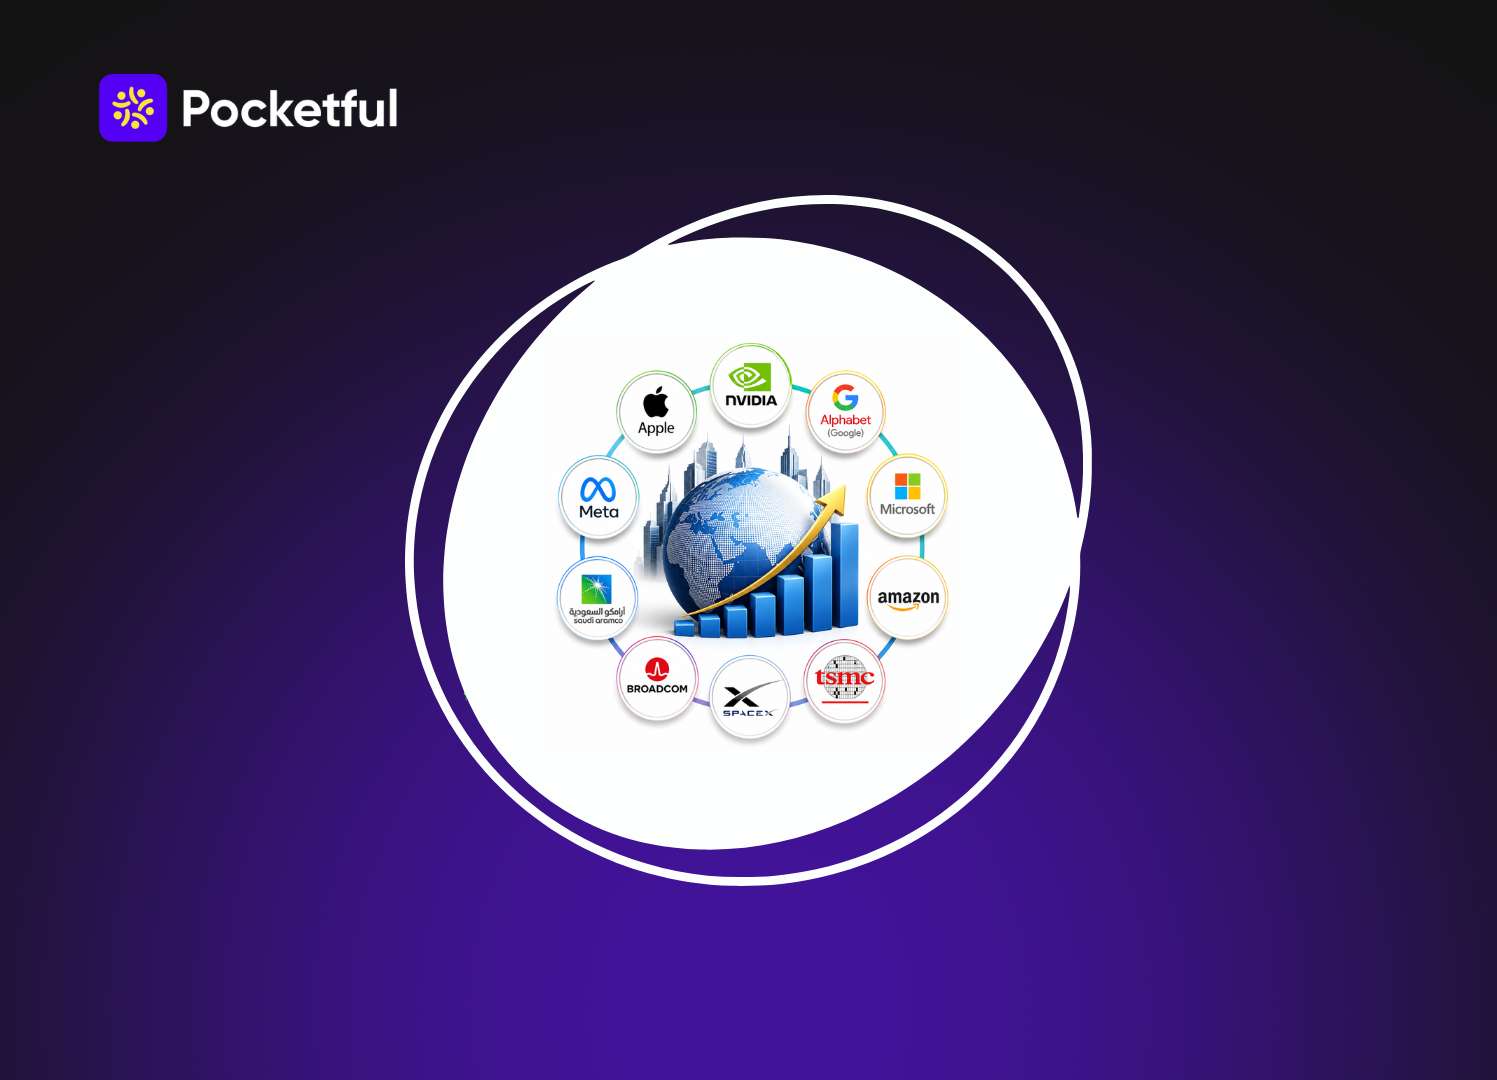
    RankCompanySectorApprox. Market CapHeadquarters
    1NVIDIASemiconductors / AI$4.8 TrillionUSA
    2AppleConsumer Tech$4.3 TrillionUSA
    3Alphabet (Google)Internet / AI$4.2 TrillionUSA
    4MicrosoftCloud / Software$2.8 TrillionUSA
    5AmazonE-commerce / Cloud$2.5 TrillionUSA
    6TSMCChip Manufacturing$2.3 TrillionTaiwan
    7SpaceXAerospace$2.1 TrillionUSA
    8BroadcomSemiconductors$1.8 TrillionUSA
    9Saudi AramcoOil & Energy$1.7 TrillionSaudi Arabia
    10Meta PlatformsSocial Media / AI$1.4 TrillionUSA

    These figures move around constantly, so don’t treat them as fixed. This is a mid-2026 snapshot. Apple and Alphabet, for instance, have swapped the number two spot back and forth more than once already this year.

    Overview of Top 10 Richest Companies in the World

    1. NVIDIA – The World No 1 Company by Market Cap

    Rewind three or four years and NVIDIA wasn’t even close to this list. Watching it climb this fast caught plenty of longtime market watchers off guard, honestly.

    What happened is simple to explain, harder to overstate. NVIDIA built its chips for gaming graphics originally. Turns out those same GPUs are almost perfectly suited for training AI models. Every cloud provider worth naming, every serious AI lab, leans on this hardware. That kind of demand doesn’t come cheap, and it’s dragged the valuation up near $4.8 trillion.

    2. Apple – Keeps Doing What It’s Always Done

    You’ve probably got an Apple product within reach as you’re reading this. That’s no accident. It’s decades of building things people genuinely don’t want to give up.

    Hardware only tells half the story though. Services – App Store fees, iCloud subscriptions, Apple Music bring in steady, high-margin cash every single quarter, phone upgrade cycle or not. Loyal customers paired with recurring income is tough to beat, and that combination keeps Apple firmly among the richest companies in the world.

    3. Alphabet – Rides the Search Engine and the AI Wave Together

    Google, YouTube, Android, Google Cloud all one company under the hood. Search ads remain the quiet moneymaker here, generating serious profit without much noise around it.

    Lately, AI is the bigger story. Alphabet has thrown real money behind Gemini and DeepMind, and that bet has clearly paid off through 2026. There have been stretches this year where Alphabet actually pulled ahead of Apple for second place.

    4. Microsoft – Blends Old Reliable With New Money

    Windows, Office, Xbox you’ve probably paid Microsoft at some point without giving it a second thought. Then there’s Azure, slugging it out with Amazon and Google for enterprise cloud deals.

    Its tie-up with OpenAI hasn’t hurt matters either. Between the cloud side and the AI angle, Microsoft’s valuation has pushed well past $2.5 trillion.

    5. Amazon – Grew Way Beyond Selling Books

    Easy to forget Amazon started as an online bookstore and nothing else. These days it’s practically the go-to example of a world best business company figuring out how to diversify the right way.

    E-commerce still grabs most of the attention, sure. But the real money comes from AWS, Amazon’s cloud division, which quietly runs a massive share of the internet’s backend that most people never think twice about.

    6. TSMC – Builds the Chips You Never Actually Buy

    You’ll never walk into a store and buy something branded “TSMC.” That’s kind of the point. Taiwan Semiconductor Manufacturing builds the chips inside NVIDIA’s GPUs, Apple’s processors, and a long list of devices you use daily.

    Pull TSMC out of the picture and a huge chunk of the tech industry grinds to a halt almost overnight. Not an exaggeration, chip manufacturing has gotten that concentrated. The company has also committed roughly $250 billion toward expanding its plants in the US.

    7. SpaceX – Just Went Public, and It Wasn’t Subtle

    SpaceX finally listed shares in mid-2026, and the debut made noise. Shares jumped fast enough that the valuation crossed $2 trillion within days of trading opening.

    What makes SpaceX different from everything else on this list is who it’s up against. It’s not just competing with other private companies anymore, it’s competing with national space programs and government satellite operations, and it now controls somewhere around 80% of the commercial launch market.

    8. Broadcom – Doesn’t Make Headlines, But It Makes AI Work

    Broadcom isn’t the company people bring up at dinner parties the way they do NVIDIA. Still, it’s become essential to how AI infrastructure actually gets built — custom chips for cloud providers, networking hardware, data center components.

    That slower, steadier climb landed it in the trillion-dollar club anyway, and it’s been rising faster than most people give it credit for.

    9. Saudi Aramco – Is the Odd One Out

    Scroll through this list and one company clearly doesn’t belong with the rest. Everyone else is tech. Saudi Aramco has held its spot near the top for years running on one thing: crude oil.

    Being state-owned, its cash flow from production and exports is massive. But unlike the tech names above, its valuation swings more with oil prices and regional politics than with typical stock market sentiment and this year’s conflicts in the region haven’t made that any calmer.

    10. Meta – Keeps Betting on What Comes After Social Media

    Facebook, Instagram, WhatsApp together they reach a genuinely staggering share of everyone online. Advertising across those apps still drives most of the money, and that part hasn’t shifted much.

    What has shifted is the AI push. Llama models, smart glasses, wearables  Meta is clearly trying to get ahead of whatever’s next instead of just riding on social media alone.

    Read Also: Top Assets by Market Cap Worldwide

    What’s Actually Driving These Companies to the Top?

    A few patterns keep showing up once you look past the individual companies:

    • AI investment – the single biggest growth driver on this whole list, hands down
    • Cloud computing – still printing reliable, high-margin revenue year after year
    • Global reach – selling in nearly every market cushions against local slowdowns
    • Brand loyalty – customers who don’t need much convincing to stick around
    • Cash flow – deep enough to fund continuous expansion without blinking
    • Constant reinvestment – staying ahead instead of coasting on past wins

    Eight out of ten companies here are tech firms. That says a lot about where investors are putting their confidence right now. Worth remembering, though, that sector dominance has flipped before more than once and nothing says it can’t happen again.

    How To Do Investing Through Pocketful

    If you want to start investing in International mutual funds or ETF the right way, Pocketful makes the entire process simple and structured. Here’s how you can get started:

    Step 1: Create Your Account

    The first step is to download the Pocketful app and sign up. The registration process is quick and takes only a few minutes.

    • Enter your mobile number and verify with OTP
    • Set your login credentials
    • Access your personal dashboard

    Step 2: Complete Your KYC

    KYC is mandatory before you can invest in any International mutual fund or ETF in India. On Pocketful, the entire KYC process is online and paperless.

    • Add your PAN and Aadhaar details
    • Enter your bank account information
    • Complete the verification process

    Step 3: Select a Mutual Fund

    Once your account is ready, you can browse International mutual funds or ETF based on your goal, risk appetite, and investment horizon. Pocketful lists funds across all major categories.

    • Choose from equity, debt, hybrid, or index funds
    • Filter by AMC, fund rating, or past performance
    • Compare expense ratios before finalising

    Step 4: Start Your SIP or Lump Sum Investment

    Decide how you want to invest through a monthly SIP or a one-time lump sum. SIPs can be started with as little as ₹100 per month.

    • Set your SIP amount and date
    • Choose the fund and confirm your investment
    • Track your SIP performance directly from the dashboard

    Pocketful gives you access to International mutual fund plans with zero commission.

    Read Also: Top 10 Richest People in the World

    Conclusion

    This ranking is a snapshot of just how much the global markets have been turned on their head by the likes of AI, cloud computing & digital platforms over the last few years. It’s taken nvidia years to build that stronghold on chip dominance , Amazon has been steadily pushing the boundaries with its cloud infrastructure and it’s taken Apple a long time to amass that loyal following of customers – and we all know that none of this is ever set in stone,it can all be taken away from them just as quick as it was built.

    Anyone delving into the top companies in the world for research, work or investment should look at this list as a one off snapshot, take it for what its worth on the day, rather than getting too hung up on some fixed pecking order – the truth is none of todays big shots were leading the pack 5 years ago & history proves that this list of the worlds most valuable companys is going to be in a state of flux in the years to come.

    S.NO.Check Out These Interesting Posts You Might Enjoy!
    1Top Highest Leverage Brokers in India
    2Top Investors In India And Their Portfolios
    3Best YouTube Channels for Stock Market in India
    4Best Trading YouTube Channels in India
    5Books for Beginners in Trading & Investing
    6Best Stock Market Traders in the World

    Frequently Asked Questions (FAQs)

    1. Which is the world’s richest company right now? 

      As of mid-2026, that’s NVIDIA, sitting above $4.8 trillion in market cap and still climbing on AI chip demand. If you’re looking up the world richest company name, NVIDIA is currently the answer, though the world richest company title has changed hands before and can shift again.

    2. Is market cap the only way to measure a company’s wealth? 

      Not really. Revenue, profit, assets, and cash flow each tell a different piece of the story, and depending on which one you lean on, the rankings can shift quite a bit.

    3. How often do Top 10 richest company rankings actually change? 

      More than most people would guess. Market cap tracks share prices day to day, so a company can gain or lose several spots in just a few weeks.

    4. Why are so many of the richest companies in the world based in the US? 

      Deep capital markets are a big part of it. US exchanges pull in investors from everywhere, and American tech firms tend to have enormous global customer bases. That mix pushes valuations higher than a lot of overseas competitors can reach, even with similar revenue numbers.

    5. Could a non-tech company break back into the top 10? 

      Sure, it’s happened before. Energy and banking giants have topped these lists in the past, and a shift in oil prices, interest rates, or regulation could move things fast. Saudi Aramco’s spot here proves tech doesn’t own a permanent monopoly on the top.

  • Global ETFs in India: Best ETFs, Returns & How to Invest

    Global ETFs in India: Best ETFs, Returns & How to Invest

    Invested in Nifty 50 or Sensex-linked funds so far? Then you are missing out on a big chunk of the world’s wealth creation. 

    If Apple, Microsoft, Nvidia, Amazon, Alphabet, none of these companies exist in your portfolio, and trading in Indian markets which is somewhat range-bound this year while US tech names keep hitting new highs, more and more retail investors are asking the same question: how do I actually get exposure to global markets from India?

    The answer, for most people, is global ETFs. They are simple, relatively low-cost, and do not require you to become an expert in picking individual foreign stocks. 

    Let us break down what they are, which ones are worth considering, and how you can actually go about investing in them.

    What are Global ETFs?

    A global (or international) ETF is basically a fund that holds a basket of stocks from outside India. They could be US tech companies, European blue chips, Chinese giants like Alibaba and Tencent, or a broad mix across multiple countries. Instead of buying 500 individual US stocks to replicate the S&P 500, you just buy one ETF unit and get proportional exposure to all of them.

    Ways to Invest in Global ETFs in India

    Route 1: NSE-Listed International ETFs 

    These are Indian mutual fund houses that have structured ETFs to track foreign indices, then listed them on our own exchanges. You buy and sell them in rupees, through your regular demat account. 

    Route 2: Direct Investing via LRS

    You can invest using the RBI’s Liberalised Remittance Scheme, which currently allows Indian residents to remit up to USD 250,000 per financial year for approved purposes, including investing.

    It works in a way that you open an account with a platform that gives you access to US or global exchanges, complete your KYC, and then transfer money from your Indian bank account under LRS

    List & Key Details to Invest in Global ETFs 

    FundsBase Expense Ratio (%)Launch DateNet Assets (Cr)Latest NAV52-Week High NAV52-Week Low NAVFund Manager (Tenure)
    Motilal Oswal NASDAQ 100 ETF0.52011-03-2914,112273.38285.46191.8Swapnil P Mayekar (0.8), Dishant Mehta (0.8)
    Mirae Asset NYSE FANG+ ETF0.62021-05-063,882163.68173.65123.03Siddharth Srivastava (5.2)
    Mirae Asset S&P 500 Top 50 ETF0.562021-09-201,09665.8568.9950.72Siddharth Srivastava (4.9)
    Nippon India ETF Hang Seng BeES0.792010-03-09964438481.65385.37Kinjal Desai (8.1), Amber Singhania (0.3), Vikash Agarwal (1.3)
    Mirae Asset Hang Seng TECH ETF0.532021-12-0635119.1625.3117.79Siddharth Srivastava (4.7)
    Motilal Oswal Nasdaq Q50 ETF0.42021-12-23180118.93122.774.44Rakesh Shetty (3.6), Swapnil P Mayekar (0.8), Dishant Mehta (0.8)
    (Data as of July 14th, 2026)

    Returns of Global ETFs

    Funds1 Yr Ret (%)3 Mth Ret (%)6 Mth Ret (%)
    Mirae Asset Hang Seng TECH ETF-0.33-0.52-15.64
    Mirae Asset NYSE FANG+ ETF30.517.6916.57
    Mirae Asset S&P 500 Top 50 ETF29.989.439.31
    Motilal Oswal NASDAQ 100 ETF42.9818.2120.7
    Motilal Oswal Nasdaq Q50 ETF6017.6929.93
    Nippon India ETF Hang Seng BeES14.1-2.17-3.44
    (Data as of July 14th, 2026)

    Read Also: Best IT ETFs in India

    Overview of Best Global ETFs to Invest in India

    1. Motilal Oswal NASDAQ 100 ETF

    • Category: Equity, Global US Technology
    • AUM stood at around ₹14,112 Cr as of June 30, 2026
    • This one tracks the top 100 non-financial companies on the Nasdaq, so you are basically getting a slice of America’s biggest tech and growth names
    • Nvidia, Apple, and Microsoft make up a good chunk of the top holdings
    • There is also decent exposure to communication services and consumer discretionary.
    • You can start with as little as ₹500
    • It is a very high-risk fund, treat it as a satellite holding, not your core portfolio

    2. Mirae Asset NYSE FANG+ ETF

    • Category: Equity, Global – Thematic Tech
    • AUM was around ₹3,382 Cr as of June 30th, 2026
    • Fairly concentrated fund with just 10 stocks, almost equally weighted, all big US tech and internet names
    • Meta, Nvidia, Tesla, Amazon and Netflix are among the top names here
    • Minimum investment amount is ₹5,000
    • Risk here is very high given how concentrated it is, works better as a small, high-conviction addition than a core holding

    3. Mirae Asset S&P 500 Top 50 ETF

    • Category: Equity, Global – US Large Cap
    • AUM came in at roughly ₹1,096 Cr as of June 30, 2026
    • Unlike the two above, this spreads across the 50 largest S&P 500 companies, so it is not just tech-heavy
    • Apple, Microsoft, Nvidia and Amazon still show up among the top holdings, but you also get financials, healthcare, and consumer names in the mix
    • Minimum investment is ₹5,000
    • Still high risk being an equity fund, but comparatively more diversified than its tech-focused peers

    4. Nippon India ETF Hang Seng BeES

    • Category: Equity, Global, Hong Kong/China
    • AUM is ₹964 Cr
    • It tracks the Hang Seng Index, giving you exposure to Hong Kong-listed companies
    • Tencent, HSBC Holdings, and AIA Group feature among the top holdings
    • Finance and retail trade dominate the portfolio, along with a bit of tech
    • Minimum Investment amount is ₹10,000
    • Carries very high risk, and there’s the added layer of China-related regulatory unpredictability to keep in mind

    5. Mirae Asset Hang Seng TECH ETF

    • Category: Equity, Global, China Tech Thematic
    • AUM was ₹351 Cr as of June 30, 2026
    • This tracks the top 30 tech-themed companies listed in Hong Kong 
    • Alibaba, Meituan, and Xiaomi are among its top holdings
    • Minimum investment starts at ₹5,000
    • Very high risk since it is concentrated and can react sharply to Chinese regulatory news

    6. Motilal Oswal Nasdaq Q50 ETF

    • Category: Equity, Global, US Emerging Growth
    • AUM stood at around ₹180 Cr as of June 30, 2026
    • Top Holdings here tend to be earlier-stage, faster-growing names that have not yet reached large-cap status
    • Beyond pure tech, there is also a mix of newer consumer and growth-stage businesses too
    • You can start investing with just ₹500
    • Very high risk, and it is also less liquid than the other funds on this list

    How to Invest in Global ETFs through Pocketful 

    1. Open your Account: If you do not have an account on Pocketful, you will need to open a demat account, which is free and has zero account opening charges and zero AMC. The KYC takes maybe 5-10 minutes: PAN, Aadhaar, bank details, and a quick video verification. 
    2. Search for the ETF: Once you log in to the app, there is a search bar at the top. Enter the name of the ETF you want to invest in.
    3. Click on the Name: You will be redirected to a page where the key details like the current price, day performance, and technical overview of the selected ETF are mentioned
    4. Select Buy Option: Once you click the buy option, you need to choose what suits you best: long-term investing, intraday trading, or buy now pay later. The choice is yours. 

    Read Also: Best ETFs in India to Invest

    Conclusion 

    In the end, we suggest you not put your entire portfolio into global ETFs just because US markets have been on a tear lately. 

    A reasonable allocation for most Indian investors is usually somewhere between 10-20% of their overall equity portfolio, depending on age, goals, and how much currency risk you are comfortable carrying.

    Global diversification is not about abandoning India as an investment destination. Indian markets have their own long-term growth story, and global ETFs simply let you participate in the world’s other growth stories at the same time.

    S.NO.Check Out These Interesting Posts You Might Enjoy!
    1Small-Cap ETFs to Invest in India
    2Best Energy ETFs in India
    3Best Silver ETFs in India
    4List of Best Gold ETFs in India
    5Best Debt ETFs to Invest in India

    Frequently Asked Questions (FAQs)

    1. Can I invest in global ETFs without opening a foreign account?

      Yes. You can buy NSE-listed international ETFs from your regular Indian demat account, in rupees.

    2. Do I have to pay TCS every time I invest in a global ETF? 

      If you are sending money abroad directly. TCS of around 20% kicks in on the amount above ₹10 lakh in a financial year, and you can claim it back when filing your ITR.

    3. How much of my portfolio should go into global ETFs? 

      There is no fixed rule, but many advisors suggest somewhere between 10-20% of your equity allocation, just for diversification  

    4. Are global ETFs risky? 

      They carry the usual market risk and currency risk. It is not high risk in the way a single stock is, but it is not risk-free either.

    5. Is there a limit to how much I can invest abroad? 

      Under RBI’s LRS rules, you can remit up to USD 250,000 per financial year for investments.

  • List of Best Nifty 50 ETFs in India (2026)

    List of Best Nifty 50 ETFs in India (2026)

    Smart investors usually look for simple ways to grow their wealth over time without stress. They want a proven method that avoids the need to track daily financial news constantly. A passive investment strategy offers exactly this kind of peace of mind. Instead of guessing which individual company will perform well, buyers can just purchase a small piece of the entire market. This approach lowers the overall risk while offering good returns. Let us explore an easy way to achieve this balance.

    What is Nifty 50 ETF?

    The question often arises among new market participants what is nifty etf exactly? In simple terms, it is a mutual fund that trades on the stock exchange and acts as a large basket of stocks. A nifty etf tracks the top 50 companies listed on the National Stock Exchange. These companies are proven leaders in their respective industries. They represent the biggest and most successful businesses operating in India today.

    When a person buys a nifty 50 etf, their money goes directly into these 50 large companies. The investment is spread out in the exact same proportion as the main index. This ensures the fund performance will closely mirror the broader market performance.

    These funds trade on the stock market just like regular company shares. Buyers can easily purchase and sell them during normal market hours without any hassle. If someone wants to see all available options, they can easily check an nse etf list on their chosen trading platform.

    Looking at a nifty 50 etf list is an excellent starting point for new market participants. It displays various funds managed by different asset management companies. Even though different financial institutions manage them, they all track the exact same 50 big stocks.

    List of 10 Nifty 50 ETFs in India as per AUM

    Here is a table showing ten popular funds, including their 1-year, 3-year, and 5-year returns. The data includes the total money managed by the fund, known as Assets Under Management. It also shows the expense ratio, which is the fee charged to manage the fund.

    ETF NameTicker SymbolExpense Ratio (%)AUM (in Crores)Price (₹)
    UTI Nifty 50 ETFNIFTYBETA0.0470,931267.58
    Nippon India ETF Nifty 50 BeESNIFTYBEES0.0364,785275.40
    ICICI Prudential Nifty 50 ETFNIFTYIETF0.0242,100273.72
    Kotak Nifty 50 ETFNIFTY10.033,436267.89
    Aditya Birla Sun Life Nifty 50 ETFBSLNIFTY0.043,21928.30
    SBI Nifty 50 ETFSETFNIF500.042,10,090260.32
    LIC MF Nifty 50 ETFLICNETFN500.06867269.43
    Tata Nifty 50 ETFNETF0.06709261.44
    Invesco India Nifty 50 ETFIVZINNIFTY0.08912744.17
    Motilal Oswal Nifty M50 ETFMOM500.0578252.77

    Overview of Best 10 Nifty 50 ETFs in India

    1. SBI Nifty 50 ETF

    This highly popular fund is managed by Raviprakah Sharma. A fact not known to everyone is that this fund handles massive investments directly from government bodies like the Employees Provident Fund Organisation, which gives the fund incredible stability 

    This fund comes from the reputable SBI Mutual Fund and was launched in 2015. It holds a giant asset base of more than 2,10,090 crore Rupees. The expense ratio is kept very low at 0.04 percent.

    ETF Name1-Year Return (%)3-Year Return (%)5-Year Return (%)AUM (in Crores)
    SBI Nifty 50 ETF-3.028.339.902,10,090

    2. UTI Nifty 50 ETF

    This large fund is efficiently managed by Sharwan Kumar Goyal, Ayush Jain, and Lokesh Kulthia. Similar to the SBI fund, a lesser known fact is that it also receives huge investments from various government pension bodies, making it a highly reliable and stable choice. 

    This fund was launched in August 2015 by UTI Mutual Fund. It manages a huge total asset base of 70,931 crore Rupees.

    ETF Name1-Year Return (%)3-Year Return (%)5-Year Return (%)AUM (in Crores)
    UTI Nifty 50 ETF-3.028.349.9170,931

    3. Nippon India ETF Nifty 50 BeES

    This massive fund is currently managed by Himanshu Mange. While many know it is big, a lesser known fact is that it is one of the oldest funds of its kind in India, starting all the way back in December 2001 

    Managed by Nippon India Mutual Fund, it is one of the oldest funds in this category, starting in 2001. It is a massive fund with an AUM of over 64,785 crore Rupees. Fund returns over the years are mentioned below.

    ETF Name1-Year Return (%)3-Year Return (%)5-Year Return (%)AUM (in Crores)
    Nippon India ETF Nifty 50 BeES-3.038.349.9264,785

    4. ICICI Prudential Nifty 50 ETF

    This fund is managed by a large team including Nishit Patel, Ajay Kumar Solanki, Ashwini Jemin Bharucha, and Venus Ahuja. An interesting fact is that despite being a growth focused fund, it has occasionally paid cash dividends to its investors, with a notable payout happening in 2016 

    It has AUM of 42,100 crore Rupees.The fund shows a 1-year return of -3.02 percent and a 3-year return of 8.35 percent. It is known for high efficiency and tight tracking of the main index.

    ETF Name1-Year Return (%)3-Year Return (%)5-Year Return (%)AUM (in Crores)
    ICICI Prudential Nifty 50 ETF-3.028.359.9342,100

    5. Kotak Nifty 50 ETF

    This established fund is actively managed by Satish Dondapati and Jeetu Valechha Sonar. A fact that many beginners miss is that this fund has a history of paying out cash dividends, with past payouts recorded in years like 2014 and 2017 

    Launched in February 2010 by Kotak Mahindra Mutual Fund, it is a very established fund. The fund handles an asset base of 3,436 crore Rupees. 

    The fund provided 1-year return of -3.01 percent and a 3-year return of 8.35 percent. The price per unit is about 267 Rupees. It is an excellent vehicle for securing broad market exposure.

    ETF Name1-Year Return (%)3-Year Return (%)5-Year Return (%)AUM (in Crores)
    Kotak Nifty 50 ETF-3.018.359.873,436

    6. Aditya Birla Sun Life Nifty 50 ETF

    This fund is carefully managed by Mehul Dama and Priya Sridhar. An interesting fact not known to everyone is that the fund tries to keep its cash holdings to an absolute minimum and actively avoids investing in debt or money market securities to stay fully invested in stocks 

    This fund stands out primarily due to its very low management cost. It also holds a massive asset base of over 3219 crore Rupees. The fund structure is carefully designed to guarantee high tracking accuracy.

    A massive asset base usually means better liquidity for both buyers and sellers. The fund has given a 1-year return of -2.99 percent, with a 3-year return of 8.35 percent. It trades at a very affordable price of around 28 Rupees per unit.

    ETF Name1-Year Return (%)3-Year Return (%)5-Year Return (%)AUM (in Crores)
    Aditya Birla Sun Life Nifty 50 ETF-2.998.359.933,219

    7. LIC MF Nifty 50 ETF

    This fund is expertly managed by Nikhil Kapoor and Sasikant Aravamuthan. A very surprising fact about this specific fund is that regular investors can start investing in it with a minimum lump sum amount of just one single Rupee 

    Launched in November 2015, this fund comes from the trusted house of LIC Mutual Fund. The 1-year return currently stands at -3.09 percent, while its 3-year and 5-year returns are 8.24 percent and 9.85 percent, respectively.

    ETF Name1-Year Return (%)3-Year Return (%)5-Year Return (%)AUM (in Crores)
    LIC MF Nifty 50 ETF-3.098.249.85867

    8. Tata Nifty 50 ETF

    This passive investment fund is managed by Rakesh Prajapati and Nitin Bharat Sharma. This passive investment fund was officially launched in January 2019. It aims to keep tracking errors to an absolute minimum while accurately matching index returns. Currently, it shows a 1-year return of -3.09 percent and a 3-year return of 8.27 percent.

    The fund currently manages a healthy 709 crore Rupees in total assets. The portfolio is widely diversified across different vital sectors of the economy. 

    ETF Name1-Year Return (%)3-Year Return (%)5-Year Return (%)AUM (in Crores)
    Tata Nifty 50 ETF-3.098.279.86709

    9. Invesco India Nifty 50 ETF

    This fund is managed by Abhisek Bahinipati at Invesco Mutual Fund. A lesser known fact is that this fund was previously called Invesco India Nifty ETF before it was recently renamed to include the number 50. 

    It carries an expense ratio of 0.08 percent. However, it does a very good job of mirroring the main index returns. This fund is a highly suitable option for passive investors wanting a strong large-cap focus.

    ETF Name1-Year Return (%)3-Year Return (%)5-Year Return (%)AUM (in Crores)
    Invesco India Nifty 50 ETF-3.088.279.9591

    10. Motilal Oswal Nifty M50 ETF

    This fund is currently managed by a team consisting of Swapnil P Mayekar, Rakesh Shetty, and Dishant Mehta. A unique historical fact about this fund is that when it was originally launched, it was actually India’s very first fundamentally weighted exchange traded fund based on the Nifty index. 

    Managed by Motilal Oswal, this fund offers a highly transparent way to invest in large-cap stocks. It has recorded a 1-year return of -3.02 percent and a 3-year return of 8.33 percent. The expense ratio is kept very low at 0.05 percent.

    ETF Name1-Year Return (%)3-Year Return (%)5-Year Return (%)AUM (in Crores)
    Motilal Oswal Nifty M50 ETF-3.028.339.9178

    Things to Consider Before Investing in ETF

    Before you put your hard-earned money into these funds, we suggest looking at a few important factors.

    • Tracking Error: This measures how perfectly the fund matches the actual Nifty 50 index. A lower tracking error is much better as it shows the fund is doing its job accurately.
    • Fund Liquidity: It is very important to check the trading volume of the fund. High liquidity means many people are trading it, making it very easy for you to buy and sell without any price problems.
    • Past Performance: Even though these funds follow the same 50 companies, you should still check their past records. A consistent history shows that the fund is managed properly and is a reliable choice for your goals.

    Read Also: Best Index ETFs in India

    How to invest in IT ETF

    • Step 1: Open a Demat Account. An investor needs a valid demat and trading account to buy these funds such as Pocketful
    • Step 2: Complete the KYC Process. The user must submit basic identity documents online. This includes providing a PAN card, an Aadhaar card, and linked bank account details for smooth verification.
    • Step 3: Search for the ETF. Once the trading account is fully active, the investor can log into the app or website. Searching for the desired ticker symbol, like ITBEES or ITAXIS, will instantly bring up the fund details.
    • Step 4: Place the Buy Order. The investor simply needs to enter the number of units they wish to purchase. Clicking the buy button will execute the trade immediately, and the units will appear in the demat account shortly.

    Conclusion

    Participating in the stock market does not have to be a highly complicated task. Index-based funds offer a highly practical and simple route for long-term wealth creation. They bring required discipline and proper structure to a personal financial portfolio.

    By investing in the top 50 companies of India, individuals can easily become part of the national economic growth story. This method removes the daily stress of analyzing and selecting individual stocks. It is a slow, steady, and highly transparent way to build financial security. Invest smarter in IT ETFs with Pocketful. Get Zero brokerage on ETF investments and grow your portfolio with ease. 

    S.NO.Check Out These Interesting Posts You Might Enjoy!
    1Small-Cap ETFs to Invest in India
    2Best Energy ETFs in India
    3Best Silver ETFs in India
    4List of Best Gold ETFs in India
    5Best Debt ETFs to Invest in India
    6Best Commodity ETFs in India
    7Top Nifty Metal ETFs
    8Best Nifty50 Index Funds in India

    Frequently Asked Questions (FAQs)

    1. What is the meaning of this fund? 

      It is a passive investment fund that directly holds shares of the top 50 companies listed on the National Stock Exchange.

    2. What are the main benefits? 

      It offers low management fees, high transparency, and the simple ability to trade during normal market hours.

    3. How to use a trading platform to invest? 

      Investors simply need an active Demat account. They can search for the specific fund ticker symbol and place a buy order.

    4. Are these funds safe for beginners? 

      They are generally considered safer than picking single stocks. The financial risk is spread across 50 large, well-established companies.

    5. Do these funds pay regular dividends? 

      Some funds automatically reinvest the dividends to increase the unit price. Other funds pay out cash dividends directly into bank accounts

  • Top 50 Stock Brokers in India by Active Clients

    Top 50 Stock Brokers in India by Active Clients

    If you want to view the new July 2026 rankings of top stock brokers in India based on active clients, this article is for you. Here, you will find a list of the top 50 brokers based on active client data, along with market trends and key insights. Additionally, a comparison of the top brokers by active client count is presented in simple language to help you easily choose the right broker.

    What Does an Active Client Mean in the Stock Market? 

    In the stock market, an ‘active client’ is an investor who has executed at least one buy or sell transaction within a specified period. Therefore, broker-wise active client data reflects a broker’s actual usage rather than merely the number of open accounts. This is why rankings of top stock brokers in India based on active clients help investors understand which brokers are witnessing the highest trading activity.

    Top 50 Stock Brokers in India by Active Clients – July 2026 

    RankStock BrokerActive Clients
    1Groww Invest Tech Pvt. Ltd.1,30,32,121
    2Zerodha Broking Ltd.68,83,999
    3Angel One Ltd.67,43,840
    4ICICI Securities Ltd.20,97,085
    5Upstox Securities Pvt. Ltd.19,61,826 
    6PocketfulRapidly Growing  
    7Kotak Securities Ltd.13,85,446 
    8HDFC Securities Ltd.13,79,984 
    9SBIcap Securities Ltd.11,60,277 
    10Raise Securities Pvt. Ltd. (Dhan)10,51,951 
    11Motilal Oswal Financial Services Ltd.9,01,868 
    12Paytm Money Ltd.8,61,706 
    13Indstocks Pvt. Ltd.6,93,526 
    14Sharekhan Ltd.5,30,958 
    15Axis Securities Ltd.4,28,671 
    16IIFL Capital Services Ltd.3,41,109 
    175Paisa Capital Ltd.3,31,486 
    18Choice Equity Broking Pvt. Ltd.2,50,748 
    19Mirae Asset Capital Markets (India) Pvt. Ltd.2,32,231 
    20Geojit Investments Ltd.2,16,303 
    21PhonePe Wealth Broking Pvt. Ltd.2,13,303 
    22Fyers Securities Pvt. Ltd.2,00,810 
    23SMC Global Securities Ltd.1,60,107 
    24Aaritya Broking Pvt. Ltd.1,50,011 
    25Anand Rathi Share & Stock Brokers Ltd.1,48,522 
    26Nuvama Wealth & Investment Ltd.1,41,361 
    27Jainam Broking Ltd.1,37,916 
    28Religare Broking Ltd.1,36,847 
    29Nirmal Bang Securities Pvt. Ltd.1,35,763 
    30JM Financial Services Ltd.1,14,615 
    31Finvasia Securities Pvt. Ltd.98,418 
    32Alice Blue Financial Services Pvt. Ltd.93,621 
    33YES Securities (India) Ltd.92,923 
    34Tradebulls Securities Pvt. Ltd.78,034 
    35StockHolding Services Ltd.75,976 
    36NJ India Invest Pvt. Ltd.74,762 
    37Aditya Birla Money Ltd.68,417 
    38Nu Investors Technologies Pvt. Ltd.67,432 
    39Moneywise Finvest Ltd.66,717 
    40Bajaj Financial Securities Ltd.60,870 
    41Master Capital Services Ltd.59,213 
    42Jhaveri Securities Ltd.58,508 
    43IDBI Capital Markets & Securities Ltd.58,332 
    44Globe Capital Market Ltd.54,618 
    45Bonanza Portfolio Ltd.53,907 
    46Arihant Capital Markets Ltd.53,173 
    47Swastika Investmart Ltd.52,199 
    48Indiabulls Securities Ltd.50,875 
    49Integrated Enterprises (India) Pvt. Ltd.50,631 
    50Samco Securities Ltd.50,359 

    Note: The above ranking is based on the latest NSE active client data available for the referenced period. Active client numbers and rankings may change every month based on trading activity. 

    Key Highlights from the July 2026 Active Client Rankings 

    The July 2026 data shows that competition in the Indian broking market is getting crazy. While a few names made moves, most top players saw their user counts barely move.

    • Groww holds the peak: Groww locked down the number one position with nearly 1.30 crore active users. Fresh investors keep signing up daily, which is keeping their upward run going strong.
    • The Big Three rule the market: Groww, Zerodha, and Angel One still run the show, sharing roughly 2.66 crore active clients between them. It proves that most everyday traders still stick with these big names.
    • Dhan Holds its Top 10 Spot: Raise Securities (Dhan) grabbed the ninth position by crossing 10.51 lakh active clients, showing steady growth during the month.
    • Newer Brokers Gaining Ground: Platforms like Aaritya Broking, Nu Investors Technologies, and Moneywise Finvest are growing fast. Their rising client numbers show that investors are willing to try fresh alternatives.
    • Mixed Results for Big Names: Growth wasn’t even across the board. While some expanded, giants like Zerodha, Angel One, and Upstox actually saw minor drops. It just shows that monthly ups and downs are normal when competition is this fierce.

    Read Also: Top 20 Stock Brokers in India for Stock Trading and Investing

    Active Client Distribution Across India’s Brokerage Industry 

    Data from July 2026 indicates that active clients are not evenly distributed across the market. A few large brokers hold the majority of investors, while the remaining brokers compete for a limited share.

    Group of brokersWhat does it indicate?
    Top 5 BrokersThey hold the majority of the market’s active clients.
    Top 10 BrokersA large section of investors uses these brokers.
    Top 20 BrokersStrong presence with a robust customer base.
    30 other brokersLow market share, but consistently remaining in the competition.

    Does a Higher Active Client Count Always Mean a Better Broker? 

    While the number of active clients reflects a broker’s popularity, one should also consider features, fees, and the overall trading experience when choosing the right broker.

    • Don’t decide based on rankings alone: A large active client base is a positive sign, but it doesn’t necessarily mean that the broker is the best choice for every investor. Compare aspects such as the trading platform, order execution, research tools, and customer support.
    • Choose a broker that suits your needs: Every investor has a different approach; some focus on long-term investments, while others engage in daily trading. Therefore, select a broker whose services align with your investment style.
    • Newer brokers can also offer great value: Every major broker was once new. Pocketful is a prime example of this. Although it may not currently top the rankings for active clients, it offers benefits like free Demat account opening, lifetime zero AMC, modern technology-driven brokerage platform and an interest rate of 5.99% p.a. on MTF making it an attractive option for cost-conscious investors.

    How to Choose the Right Stock Broker Beyond Active Client Rankings 

    It is also important to consider a few factors when choosing a broker.

    Factor to CompareWhy It Matters
    Brokerage ChargesLower charges help reduce your overall trading cost.
    Trading PlatformA fast and easy-to-use platform improves the trading experience.
    Order ExecutionQuick order execution helps avoid delays during trades.
    Research & ToolsGood research and tools support better investment decisions.
    Customer SupportReliable support helps resolve issues quickly.
    Investment OptionsAccess to stocks, IPOs, mutual funds, ETFs, and other products offers more flexibility.
    SEBI RegistrationEnsures the broker is regulated and follows SEBI guidelines.

    Emerging platforms are also becoming better options for new-age investors.

    New-age investors are no longer falling for big brand names alone. Instead, they are moving toward newer platforms that actually fix daily trading hassles with smart tech and a straightforward user interface.

    • Cutting through the noise with AI: A lot of new brokers are using AI to make investing less confusing. Take “Pocketful GPT” as an example it translates complicated stock data and market trends into plain, simple English so anyone can grasp it.
    • No more app hopping: Nobody wants to manage five different apps anymore. Pocketful packs stocks, IPOs, mutual funds, ETFs, bonds, commodities, and F&O into one single dashboard, which makes tracking your money a lot easier.
    • Built for fast execution: Serious traders need speed. The platform handles this by throwing in heavy-duty tools like Scalper Mode, advanced option chains, basket orders, and direct TradingView charts to keep trades quick and sharp.
    • Bigger trades on a tight budget: With Pocketful Margin Trading Facility (MTF), you can get up to 5x leverage, and the interest rates start quite low at 5.99% per year. It’s a solid option if you want to take bigger positions without putting up all your cash upfront.
    • Making the whole process simple: The real goal here isn’t just offering trades it’s about making the entire market easier to navigate. Features like live price updates, quick payouts, and a clean layout work well for absolute beginners while still giving pros exactly what they need.

    What Do Today’s Investors Expect from a Stock Broker?

    The days when traders just looked for a basic platform to buy and sell shares are gone. The checklist has changed completely people now want something that saves time and cuts out the headaches.

    • Zero patience for slow apps: Lagging screens and late prices irritate everyone. Traders want a simple layout where orders hit the market instantly and live rates update without any delay.
    • Tired of using multiple apps: Opening four different apps just to check your wealth is annoying. Everyone wants one simple screen that tracks stocks, IPOs, mutual funds, ETFs, bonds, and commodities together.
    • Smart features over raw data: Nobody likes staring at messy sheets anymore. People want quick, clear summaries, which is why AI tools and smart screeners are trending fast.
    • Clear pricing with zero surprises: Hidden fees are the quickest way to lose a customer’s trust. Traders naturally lean toward brokers who keep their fee structure completely transparent and trading costs low.
    • Support that actually answers: When a payment stucks or an order misbehaves, people want real help immediately. Good customer support is what actually keeps users loyal.
    • Why Pocketful Fits the Bill: Pocketful is built around these exact demands. By mixing smart features like Pocketful GPT and the Scalper tool with an easy layout and low brokerages, it gives modern traders the exact tech-first experience they are hunting for.

    Read Also: Best SEBI Registered Brokers in India

    Conclusion

    The ranking of top stock brokers in India based on active clients helps you understand which brokers have the highest number of active investors. However, do not rely solely on the number of active clients when choosing the right broker. Make your decision only after comparing brokerage charges, features, the trading experience, and your specific investment needs to ensure a better experience in the long run.

    S.NO.Check Out These Interesting Posts You Might Enjoy!
    1Lowest MTF Interest Rate Brokers in India 
    2Top 10 Highest Leverage Brokers in India
    3Best Paper Trading Apps in India
    4Top 10 Option Trading Books in India
    5Best Trading Apps in India

    Frequently Asked Questions (FAQs)

    1. What does an active client mean in stock trading?

      An active client is simply an investor who has placed at least one trade within a fixed timeframe.

    2. Who is the top stock broker by active clients in July 2026?

      Right now, Groww leads the market with the largest number of active clients.

    3. How often is the active client ranking updated?

      NSE updates active client data every month, so broker rankings may change from time to time.

    4. Does having the most active clients make a broker the best?

      Not really. Total numbers matter, but you must also check trading charges, platform tools, and support quality before picking a broker.

    5. Where can I check the latest broker-wise active client data?

      You can check the latest broker-wise active client data on the official NSE website and trusted brokerage reports.

  • Best IT ETFs in India (2026)

    Best IT ETFs in India (2026)

    Many individuals seek ways to participate in this digital revolution without the risk of picking individual stocks. A simple and highly effective method exists to achieve this financial goal. This type of investing means putting your money in a basket of top software and technology companies.

    Information technology market is highly dynamic and volatile. Holding a diversified portfolio of software stocks can be highly rewarding. Today, the discussion explores how individuals can easily take part in this exciting financial journey.

    What is an Information Technology ETF?

    An IT ETF stands for Information Technology Exchange Traded Fund. This is a special type of mutual fund that trades on the stock market just like regular shares. Finding the best it etf in india helps investors buy a small piece of all the top technology companies at one single time.

    By doing this, individuals avoid the huge risk of relying on just one single company. An it etf list usually includes industry giants like Tata Consultancy Services, Infosys, and HCL Technologies. There are several excellent it etfs in india available today for regular investors.

    These funds track a specific market index, such as the Nifty IT index. The main goal of an it etf india is to mirror the performance of this underlying technology index exactly. When the overall technology sector performs well, the fund’s value also increases. This provides a very simple and low-cost way for regular people to invest in the software and digital services industry.

    The Nifty IT Index consists of the largest and most liquid Indian information technology companies. These companies represent a massive portion of India’s technology exports. Funds that track this index buy shares in the exact same proportion as the index itself. This passive management style keeps the overall running costs very low for investors.

    List of Best 5 IT ETFs in India 

    The following table presents the top five information technology funds in India. They are ranked by their Assets Under Management (AUM). 

    ETF NameTicker SymbolAUM (₹ Cr)Price (₹)Expense Ratio (%)1Y Return (%)3Y Return (%)5Y Return (%)
    Nippon India ETF Nifty ITITBEES3,532.6532.160.19-25.570.471.35
    ICICI Prudential Nifty IT ETFITIETF532.4231.020.17-25.440.551.42
    Kotak Nifty IT ETFIT234.0031.060.08-25.210.681.54
    DSP Nifty IT ETFITADD14529.670.41-25.310.54NA
    Axis NIFTY IT ETFITAXIS143308.410.21-25.540.451.36

    Overview of Best 5 IT ETFs in India

    1. Nippon India ETF Nifty IT

    Nippon India ETF Nifty IT is the largest fund in this category. It currently manages assets worth ₹3532.65 crore. It trades under the popular symbol ITBEES on the stock exchanges. Having 0.19 expense ratio. The fund was launched in june 2020.

    Over the past five years, it has delivered an annualised return of 1.35 percent. The recent one-year negative return of -25.57 percent reflects a global slowdown in technology spending. High interest rates globally have temporarily affected the profit margins of these Indian companies.

    ETF NameAUM (₹ Cr)1Y Return (%)3Y Return (%)5Y Return (%)
    Nippon India ETF Nifty IT3532.65-25.570.471.35

    2. ICICI Prudential Nifty IT ETF

    ICICI Prudential Nifty IT ETF is the second-largest fund in the segment. It holds an AUM of ₹532.42 crore. It trades under the symbol ITIETF and was launched in August 2020.

    This scheme provides a highly accessible way for individuals to invest in the technology sector. The fund maintains a low expense ratio of 0.17 percent. It strictly replicates the Nifty IT index by investing heavily in major technology firms.

    Being relatively new, its five-year return data is not yet available. However, it closely mirrors the broader market trends with a one-year return of -25.44 percent.

    ETF NameAUM (₹ Cr)1Y Return (%)3Y Return (%)5Y Return (%)
    ICICI Prudential Nifty IT ETF532.42-25.440.551.42

    3. Kotak Nifty IT ETF

    Kotak Nifty IT ETF manages assets worth ₹231.00 crore. It is highly notable for having the lowest expense ratio among its peers. The expense ratio stands at just 0.09 percent.

    This incredibly low cost makes it very attractive for long-term investors. Launched in March 2021, the fund aims to generate returns that match the Nifty IT index. The fund holds a basket of reliable technology stocks.

    Investors can buy this fund efficiently through any standard brokerage platform. Like other funds, it has faced short-term pressure with a one-year return of -25.21 percent.

    ETF NameAUM (₹ Cr)1Y Return (%)3Y Return (%)5Y Return (%)
    Kotak Nifty IT ETF234.00-25.210.681.54

    4. DSP Nifty IT ETF

    DSP Nifty IT ETF is a relatively newer entrant in the market. It was launched recently in July 2023. It currently holds assets under management worth ₹145 crore.

    The fund trades under the symbol ITADD on the national exchanges. The expense ratio for this fund is at 0.17 percent. Since it is a new fund, five-year return metrics are not applicable yet.

    It continues to provide targeted exposure to India’s top ten liquid and large-cap IT stocks. The fund experienced a one-year return of -25.31 percent due to the ongoing global tech sector correction.

    ETF NameAUM (₹ Cr)1Y Return (%)3Y Return (%)5Y Return (%)
    DSP Nifty IT ETF145-25.310.54NA

    5. Axis NIFTY IT ETF

    Axis NIFTY IT ETF manages an AUM of ₹143 crore. It trades under the ticker symbol ITAXIS. It has a slightly higher unit price, trading around ₹308.41.

    The fund charges a competitive expense ratio of 0.25 percent. This fund was introduced to the market in March 2021. It has shown a positive long-term trend with a five-year return of 7.62 percent.

    The investment strategy focuses on the physical replication of the Nifty IT index components. The higher absolute share price does not affect the percentage returns for the investor.

    ETF NameAUM (₹ Cr)1Y Return (%)3Y Return (%)5Y Return (%)
    Axis NIFTY IT ETF143-25.540.451.36

    Read Also: Best Index ETFs in India

    Advantages of investing in IT ETF

    • Instant Diversification: Buying just one unit gives an investor exposure to multiple top software companies. This strategy significantly reduces the risk compared to investing all funds in one single stock.
    • Cost-Effective Investment: These funds generally feature a very low expense ratio. Investors save a lot of money on management fees, which naturally helps increase long-term profits.
    • Easy Liquidity: These funds trade directly on the stock exchange during normal market hours. Individuals can buy or sell them instantly, exactly like regular company shares.
    • Transparent Holdings: Investors do not need to spend hours researching individual companies. The fund automatically tracks the top technology businesses, and the portfolio is disclosed daily.

    Disadvantages of investing in IT ETF

    • Sector Concentration Risk: All the invested money goes into the technology sector only. If the technology industry faces a tough period, the entire investment value will drop at the same time.
    • No Market Outperformance: These funds are designed only to copy the market index. They cannot beat the market or give higher returns than the index itself.
    • Brokerage and Demat Charges: Buying and selling these funds requires an active demat and trading account. Investors must pay brokerage fees and other small taxes for every single transaction.
    • Tracking Error: Sometimes the returns of the fund slightly differ from the actual index returns. This minor difference occurs due to internal cash management and daily expense deductions.

    How to invest in IT ETF

    • Step 1: Open a Demat Account. An investor needs a valid demat and trading account to buy these funds. 
    • Step 2: Complete the KYC Process. The user must submit basic identity documents online. This includes providing a PAN card, an Aadhaar card, and linked bank account details for smooth verification.
    • Step 3: Search for the ETF. Once the trading account is fully active, the investor can log into the app or website. Searching for the desired ticker symbol, like ITBEES or ITAXIS, will instantly bring up the fund details.
    • Step 4: Place the Buy Order. The investor simply needs to enter the number of units they wish to purchase. Clicking the buy button will execute the trade immediately, and the units will appear in the demat account shortly.

    Read Also: List of Best Commodity ETFs in India

    Conclusion

    The Indian technology sector continues to hold immense potential for the future. Investing in ETFs, technology-focused funds offers a very straightforward path to participate in this ongoing digital growth. While there are certainly risks tied to focusing on a single sector, the clear benefits of low costs and instant diversification remain highly attractive.

    A well-planned investment approach can help individuals build steady wealth over a long period. Selecting the right online trading platform, such as Pocketful, makes the entire investment journey smooth and completely hassle-free. 

    S.NO.Check Out These Interesting Posts You Might Enjoy!
    1Small-Cap ETFs to Invest in India
    2Best Energy ETFs in India
    3Best Silver ETFs in India
    4List of Best Gold ETFs in India
    5Best Debt ETFs to Invest in India

    Frequently Asked Questions (FAQs)

    1. What is an IT ETF?

      It is a passive mutual fund traded directly on the stock exchange. It invests solely in the top information technology companies in India.

    2. What are the main benefits?

      These funds offer very low management costs, and easy trading on stock exchanges. Investors gain safe exposure to tech giants without picking individual stocks.

    3. How do individuals use these funds?

      Investors hold them in a standard demat account to build long-term wealth. They serve as a focused technology portion within a much broader investment portfolio.

    4. Are these investments risky?

      Yes, they carry sector concentration risk. If the global software industry struggles due to economic factors, the fund value will drop accordingly.

    5. Do these funds pay dividends?

      Most of these funds automatically reinvest company dividends back into the fund’s net asset value. This internal process helps in compounding the invested money much faster.

  • Top 20 Stock Brokers in India for Stock Trading and Investing

    Top 20 Stock Brokers in India for Stock Trading and Investing

    Picking the best stock broker in India is a decision that shapes every rupee you earn or lose to fee over the next decade. A full-service broker can charge you ten times more per trade than a discount broker for the exact same order. This gap grows over years and can cost you a lot.

    That is why we have listed the top 20 stock brokers in India based on verified pricing pages, platform stability, and product depth. The aim is to help you pick the best broker for trading or investing without wading through affiliate-driven noise.

    How We Ranked the Top Brokers in India

    Every broker on this list was evaluated on six factors that actually affect your returns:

    • Brokerage charges, including delivery, intraday, F&O, AMC, and DP fee.
    • Platform stability during high-volume trading sessions.
    • Margin trading and leverage offerings.
    • Research, charting, and trading tools.
    • Customer support quality and speed.
    • SEBI registration and regulatory compliance.

    Quick Comparison: Best Stock Brokers in India at a Glance

    S.NoBrokerAccount OpeningAMCDelivery BrokerageIntraday/F&OBest For
    1GrowwFree₹0₹20 or 0.1% (lower)₹20 flatBeginners, SIP investors
    2ZerodhaFree₹300 + GST₹0₹20 or 0.03%Long-term investors, active traders
    3Angel OneFree₹240/yr₹20 or 0.1%₹20 flatResearch-backed discount trading
    4UpstoxFree₹300/yr (1st yr free)₹20/order₹20/orderF&O traders who want TradingView
    5PocketfulFree₹0₹0₹20 flat or 0.03%Active traders wanting AI tools and low MTF
    6DhanFree₹0₹0₹20/orderOptions traders, zero AMC seekers
    7ICICI DirectFree₹700/yr~0.29%~0.029%3-in-1 banking convenience
    8HDFC Securities₹999₹750/yr0.32%0.032%HDFC Bank customers
    9Kotak Securities (Neo)FreePlan-basedPlan-basedTiered plansYoung investors under 30
    10Motilal OswalFreeStandard% based% basedResearch-driven investors
    11Paytm MoneyFreeLow/nil₹20-level₹20-levelCasual mobile-first investors
    12FyersFreeLow₹0 to ₹20 tier₹20/orderTechnical, chart-heavy traders
    135paisaFreeLowFlat fee₹20/orderBudget-conscious traders
    14m.Stock (Mirae Asset)One-time fee plansPlan-basedZero-brokerage planZero-brokerage planHigh-volume traders
    15SBI SecuritiesStandardStandard% based% basedSBI account holders
    16Axis DirectStandardStandard% based% basedAxis Bank 3-in-1 users
    17SharekhanStandardStandard% based% basedOffline branch support
    18IIFL SecuritiesStandardStandard% based% basedAdvisory and wealth products
    19GeojitStandardStandard% based% basedSouth India branch network
    20RupeezyFreeLow₹0₹20 or 0.03%Strategy builders, MTF

    Note: Charges above exclude statutory levies, which are identical across every broker since the government sets them. The data is based on information available online and is bound to change. Use it for educational needs only.

    Read Also: Best SEBI Registered Brokers in India

    Reviews of the Best Stock Brokers in India

    Now that you know the top ones, let’s take a quick deep dive into each to understand better. This will help you while making decisions.

    1. Groww: Best Investing Platform for Beginners

    Groww started as a mutual fund platform before expanding into stocks, with its founders deliberately building a product around simplicity. That approach helped it become the biggest stock broker in India by active clients. 

    Account opening is fully digital with ₹0 AMC, making it one of the best stock brokers for Investing. The trade-off is that charting remains basic, and commodity trading is still unavailable. 

    2. Zerodha: Best Overall Trading Platform for Indian Stocks

    It was founded in 2010. It actually changed the Indian broking industry. It introduced the flat-fee pricing model, making it one of the top brokers in India. Its Kite platform handles high-volatility sessions well, while Varsity offers free market education for beginners. 

    As the best broker for trading, it balances reliability and simplicity, although customer support is primarily ticket-based with no physical branch network. 

    3. Angel One: Best Hybrid of Research and Discount Pricing

    Angel One began as a traditional full-service broker. It recently transformed into a digital-first platform with discount pricing. Its AI-powered ARQ advisory engine and nationwide branch network make it suitable for investors who value research alongside affordability. 

    It remains one of the top 20 stock brokers in India, though the app frequently promotes additional financial products beyond stockbroking. 

    4. Upstox: Best for F&O Traders on a Budget

    Founded in 2009, Upstox expanded rapidly after receiving backing from investors. These included Ratan Tata. Today, it offers TradingView integration, over 100 technical indicators, and useful derivatives tools without additional charges. 

    Platform stability has improved significantly in recent years, making it one of the best broker for trading for active F&O participants seeking advanced charting at a competitive cost.

    5. Pocketful: Best for Active Traders Who Want AI Tools and Low-Cost Margin

    Pocketful is a new aged technology-driven platform Backed by 27+ years of market experience, it combines low brokerage with modern technology. Features like Pocketful GPT, built-in TradingView charts, Advance tools for F&O and MTF rates starting at 5.99% have helped position it among the fastest growing stock brokers. 

    While its offline presence is smaller than legacy firms, it offers strong value for traders looking for an AI-powered best stock broker in India. 

    6. Dhan: Best Zero-Cost Structure for Options Traders

    Launched in 2021, Dhan has quickly built a reputation among options traders with features like strategy builders, draggable chart orders, and TradingView integration. With ₹0 AMC and free equity delivery, it offers excellent value for active traders. 

    As one of the fastest growing stock brokers, Dhan keeps adding new features, although its research ecosystem is still developing compared to older brokers. 

    7. ICICI Direct: Best Full-Service Broker

    This has been a trusted name since 2000. It is one of the top brokers in India for investors seeking a full-service experience. Its integrated 3-in-1 account, Trend Scanner, and extensive research appeal to long-term investors. 

    While the platform offers convenience and reliability, its standard brokerage charges are higher than those of most discount brokers. 

    8. HDFC Securities: Best for HDFC Bank Loyalists

    HDFC Securities is known for its detailed research and relationship manager support. It offers smooth integration with HDFC Bank accounts. Its Smart Order Routing compares prices before placing trades. This helps investors secure better execution. 

    It remains a preferred choice among the best stock brokers for investing, though higher account opening fees and annual maintenance charges may discourage cost-conscious investors. 

    9. Kotak Securities (Neo): Best for Investors Under 30

    Operating since 1994, Kotak Securities combines the trust of an established financial institution with the modern Neo trading platform. It also offers access to international stocks and advanced trading tools like Kotak Nest. 

    For young investors, it has been one of the top 20 stock brokers in India. But its pricing structure has changed several times.

    10. Motilal Oswal: Best for Research-Driven Investors

    It offers great in-depth equity research and long-term investment advice. It is not known for low brokerage alone. Investors also benefit from features like My Wallet and margin funding on select stocks. 

    If research is your priority, it remains one of the best stock brokers for Investing. But its pricing is generally higher than most discount brokerage platforms. 

    11. Paytm Money: Best for Casual, Mobile-First Investors

    Paytm Money began as a direct mutual fund platform before expanding into stock and F&O trading. Leveraging the Paytm ecosystem, it offers a simple digital investing experience with paperless account opening and zero commission on direct mutual funds. 

    It is a good choice among the top brokers in India for casual investors, although advanced charting and trading tools remain fairly limited.

    12. Fyers: Best Charting-First Platform for Technical Traders

    It was built in 2015 with active traders in mind. It offers TradingView-powered charts. IT also has a well-documented API for strategy automation. Its trader-first approach helped to earn a loyal following despite a smaller customer base.

    If technical analysis is your priority, Fyers is among the best broker for trading even when the presence is small.

    13. 5paisa: Best for Budget-Conscious Traders

    5paisa was one of India’s earliest discount brokers to popularise flat-fee brokerage across multiple investment products. Backed by the IIFL Group, it continues to attract cost-conscious traders with affordable pricing. 

    It remains one of the top 20 stock brokers in India for those focused on keeping trading costs low, although its charting capabilities are less advanced than many newer platforms.

    14. m.Stock (Mirae Asset): Best for High-Volume Traders

    Backed by Mirae Asset, m.Stock introduced a lifetime subscription model that offers zero brokerage on equity delivery, intraday, and F&O after a one-time payment. 

    Frequent traders can recover this cost quickly, making it an attractive option among the fastest growing stock brokers. However, occasional investors may not benefit enough from the upfront subscription fee. 

    15. SBI Securities: Best for SBI Account Holders

    SBI Securities combines the trust of India’s largest public sector bank with a convenient 3-in-1 banking, trading, and Demat account. It also offers portfolio management, forex, derivatives, and regular market research. 

    For investors who prioritise reliability, it remains one of the best stock brokers for Investing, although its technology and trading interface still trail many modern discount brokers. 

    16. Axis Direct: Best for Axis Bank 3-in-1 Users

    Axis Direct combines banking, trading, and Demat services. All these are through its seamless 3-in-1 account. It also offers detailed research reports, investment advice, and webinars for investors. 

    Among the top brokers in India, it appeals to research-focused users. Its percentage-based brokerage is high which can be a drawback for many traders.

    17. Sharekhan: Best for Offline Branch Support

    Sharekhan has built its reputation through a strong branch network. It runs investor education initiatives like Sharekhan Classroom. Along with research-backed recommendations, it allows traders to use fixed deposits as collateral for F&O positions. 

    It remains one of the best stock brokers for Investing. If you value personalised support, then its newer app-first platforms are the best.

    18. IIFL Securities: Best for Advisory and Wealth Products

    IIFL Securities blends traditional advisory services with modern investing tools, offering access to research platforms like Trendlyne and Refinitiv, along with IPO and mutual fund investing. 

    It is a suitable option among the top 20 stock brokers in India for investors seeking a broader wealth management experience. However, the absence of a dedicated 3-in-1 banking setup adds an extra step when transferring funds. 

    19. Geojit: Best for South India Branch Network

    It was established in 1987. It has built a strong presence across South India and among NRIs in the Middle East. Its Flip platform works well with all assets. This makes it a well-rounded offering. 

    It remains one of the best stock brokers for Investing. It is still lacking in some of the top features for many newer digital-first competitors. 

    20. Rupeezy: Fastest Growing New-Age Broker to Watch

    Rupeezy has rapidly expanded to over 300,000 customers by combining competitive pricing with trader-focused technology. Features like a no-code options strategy builder, F&O scanner, and unified ledger have helped position it among the fastest growing stock brokers. 

    Its product range is still growing. Based on it, this is now in the list of the best stock broker in India with advanced trading tools.

    Discount Broker vs Full-Service Broker: Which Should You Choose

    The choice is mainly based on cost and need. The table below can help you out.

    FeatureDiscount BrokerFull-Service Broker
    BrokerageFlat fee (usually ₹20 or less per order)Percentage-based (around 0.3%–0.5% per trade)
    AdvisoryNo personalised adviceResearch reports and investment recommendations
    Relationship ManagerNot availableUsually included
    Best ForActive traders and DIY investorsBeginners, NRIs, and investors seeking guidance
    ExamplesZerodha, Groww, Pocketful, DhanICICI Direct, HDFC Securities

    Example: For a ₹2 lakh delivery trade, a discount broker may charge ₹0–₹20. But a full-service broker may charge around ₹600. Self-directed investors usually save more with discount brokers.

    Read Also: Top Discount Brokers

    How to Verify a SEBI-Registered Broker

    Before opening an account anywhere, confirm the broker is genuinely SEBI registered:

    1. Visit sebi.gov.in.
    2. Go to Intermediaries, then Recognised Intermediaries.
    3. Search by the broker’s registered legal entity name.
    4. Match the SEBI registration number with one on the broker’s website footer.
    5. Cross-check active NSE membership on nseindia.com.
    6. Read the broker’s mandatory Investor Charter and monthly complaint disclosure.
    7. Confirm your demat account is with CDSL or NSDL before starting.

    Note: Avoid brokers asking for payments to personal accounts or promising guaranteed returns.

    Start Your Investment Journey with Pocketful

    After comparing the top 20 stock brokers in India, choose a platform that matches your financial goals. Pocketful combines low brokerage, AI-powered research, TradingView charts, and competitive MTF rates, making it an excellent choice for both new and experienced investors. Open your account today and take the next step in your investing journey.

    S.NO.Check Out These Interesting Posts You Might Enjoy!
    1Lowest MTF Interest Rate Brokers in India 
    2Top 10 Highest Leverage Brokers in India
    3Best Paper Trading Apps in India
    4Top 10 Option Trading Books in India
    5Best Trading Apps in India

    Frequently Asked Questions (FAQs)

    1. Which is the best stock broker in India for beginners?

      Groww and Zerodha are best for beginners. But Pocketful is a strong option for beginners who also want access to AI-assisted research without extra charges.

    2. Which broker has the lowest brokerage charges in India? 

      Zerodha, Dhan, and Pocketful all charge ₹0 on equity delivery. For intraday and F&O, most of these brokers charge a flat ₹20 per order. All these are the deciding factors for traders.

    3. Is Pocketful a good broker for active trading? 

      Yes. Pocketful offers zero brokerage on equity delivery and AMC. It offers a flat ₹20 per order on intraday and F&O. It also offers the lowest Margin Trading Facility rates starting at 5.99% PA.

    4. What is the safest stock broker in India for large investments? 

      Safety depends on regulation rather than broker size. But if you wish to find the safest and low charge one, then Pocketful, Dhan, Zerodha, and a few others top the list.

    5. Which are the best brokers for trading options and futures in India? 

      Pocketful and Dhan both offer zero AMC with strong options tooling, including advanced option chains and strategy features. This can help with stable trades.

  • Mukesh Ambani Net Worth: Per Day, Hour & Second Income (2026)

    Mukesh Ambani Net Worth: Per Day, Hour & Second Income (2026)

    People always discuss amongst their groups about how rich is mukesh ambani. The chairman of Reliance Industries has built an empire that covers almost every part of everyday life. From mobile internet networks to local grocery stores, his company is present everywhere.

    Tracking his financial growth provides excellent lessons in business strategy. The following report will look closely at his investments and his expanding portfolio. It will also break down the exact numbers behind his massive wealth.

    What is Mukesh Ambani’s Net worth

    The financial world always pays close attention to the ambani net worth. People often want to know the exact figure of the mukesh ambani net worth indian rupees because the scale is hard to imagine. As of July 2026, the mukesh ambani net worth in rupees has reached a record breaking 8.55 lakh crore.

    This massive number makes him the wealthiest person in India. To make it easier for global comparisons, the ambani net worth in billion stands at roughly 89.6 billion US dollars. This huge sum places him firmly at the very top of the wealthiest individuals in Asia.

    With such a large total wealth, financial experts are naturally curious about his regular earnings. The mukesh ambani daily income is not calculated like a normal monthly salary. Instead, it comes from the rising value of his company shares and regular dividends.

    When observers look at the stock market during a highly successful year, they frequently ask, how much ambani earn per day? Based on the rapid daily rise in his stock value during strong market periods, the one day income of mukesh ambani can be estimated at around 163 crore rupees.

    Breaking this massive number down further gives an even clearer picture of his financial power. The mukesh ambani 1 hour income is calculated to be roughly 6.79 crore rupees. Even more shocking is the microscopic breakdown of his wealth growth.

    The mukesh ambani per second income is estimated at about 18,866 rupees. Understanding these figures shows the true power of holding strong business investments over a long period. His wealth grows every single moment because his businesses operate around the clock.

    Mukesh Ambani Income : Per day, per Hour, Per Minute, Per Second

    To understand this vast wealth better, it helps to see the exact mathematical breakdown. His income primarily comes from two different financial channels. The first channel is the cash dividend he gets directly from his shares in Reliance Industries.

    The second channel is the constant daily increase in the market value of those shares. When the Indian stock market performs very well, his total wealth grows at an incredible speed. The numbers below reflect wealth growth during very strong market periods.

    Time FrameEstimated Income (Rupees)
    Per Day163 Crore
    Per Hour6.79 Crore
    Per Minute11.31 Lakh
    Per Second18,866

    If an analyst looks only at his pure dividend income, the numbers are still extremely large. He earns around 4,000 crore rupees every year just from company dividends. That means a daily cash dividend income of about 11 crore rupees.

    These numbers show exactly how big businesses reward their primary owners. Understanding these massive figures is the first step in learning about the stock market.

    It is important to remember that this income is not actual cash sitting in a bank account. A large part of it is tied to the stock market performance. If the stock market goes down, these daily income numbers can also decrease. However, over a long period, strong companies usually see their value go up steadily.

    Read Also: Top 10 Richest Persons in India

    Last 10 year networth of Mukesh Ambani

    The numbers below reflect his estimated wealth as recorded by Forbes billionaire lists over the last 10 years.

    YearNet Worth (US Dollars)
    201738.0 Billion
    201847.3 Billion
    201951.4 Billion
    202088.7 Billion
    202192.7 Billion
    202290.7 Billion
    202383.4 Billion
    2024116.0 Billion
    2025105.0 Billion
    202699.7 Billion

    Sources of Income for Mukesh Ambani

    His massive wealth does not come from a single job or a small business. It is built on a highly diverse portfolio covering many different sectors. Here are the main sources of his income:

    • Reliance Industries Limited Shares: He and his family own about 50 percent of Reliance Industries. The rising share price of this giant company is the single biggest source of his wealth. This company operates in oil, retail, and telecommunications.
    • Dividend Payouts: Every year, Reliance pays a part of its profit directly to its shareholders. With crores of shares in his name, he earns thousands of crores in cash dividends alone. This provides a massive and steady flow of actual cash.
    • Jio Platforms: This digital and telecom arm is a massive wealth contributor. It provides internet to millions of homes and partners with global technology leaders. This platform completely changed how India uses mobile data.
    • Jio Financial Services: This is a newly created company separated from the main business partnership with Blackrock. It offers digital banking, insurance, and lending services to millions of customers. This marks his entry into the fast growing financial sector.
    • Media and Entertainment: His investments include big media networks like Viacom18 and Network18. 
    • Green Energy Investments: He is currently investing heavily in solar power and green hydrogen. This future focused energy business adds huge long term value to his overall portfolio. He plans to spend 75,000 crore rupees on these projects.

    Investors can research similar strong companies using modern financial tools.

    Roles of mukesh ambani in Reliance Industries

    As the top leader, he plays several vital roles in the company. He is not just a passive owner but a very active and busy manager. His daily decisions shape the future of the entire business group.

    • Chairman and Managing Director: He leads the board of directors and sets the big goals. He makes the final major decisions for the entire Reliance group. This role requires managing multiple business heads and tracking massive projects.
    • Chief Strategist for New Ventures: He constantly guides the company into brand new areas. He personally led the shift from traditional oil refining to digital technology and modern telecom. This strategy keeps the company relevant in a changing world.
    • Green Energy Leader: He is personally driving a massive investment into clean energy. This includes building large solar factories and battery plants to replace older fuels. This role ensures the company survives the global shift to green power.
    • Global Partnership Builder: He secures large financial investments from foreign companies. He successfully brought global giants to invest billions in Jio. Building these relationships is a very critical part of his daily job.
    • Debt Manager: He played a major role in making Reliance entirely net debt free in the year 2020. This smart move protected the company from financial trouble during tough economic times.

    Salary of Mukesh Ambani

    The official salary of Mukesh Ambani is zero rupees. For the sixth consecutive year, including the financial year 2026, he has drawn no salary from Reliance Industries.

    He officially stopped taking a salary in 2020 during the global pandemic to show support for his company. Even before 2020, he kept his salary strictly capped at 15 crore rupees for over ten years. His actual earnings come entirely from stock dividends.

    Read Also: Mukesh Ambani Companies List

    Quality of Mukesh Ambani that helps him remains at the top

    Remaining at the very top of the competitive business world requires special qualities. He has shown several unique traits that keep his business empire growing year after year. These qualities serve as a great lesson for anyone interested in business.

    • Long term vision: He saw the massive future of data and the internet long before many others in the industry. When he launched Jio, he made the internet very cheap and easily available to everyone. This clear vision totally changed the entire telecom industry in India.
    • Adaptability: Reliance originally started as a simple textile company. It then became a massive giant in oil and chemicals. Now, it is transforming quickly into a modern technology and green energy leader. 
    • Excellent capital allocation: This simply means he knows exactly where to put money to get the best financial returns. 
    • Focus on the consumer: His retail and digital businesses always aim to provide high quality services at very low prices. By solving daily problems for the common person, he ensures that his businesses have millions of highly loyal customers. This focus on customer satisfaction builds deep trust.

    Conclusion

    To sum up, the business journey of Mukesh Ambani is a perfect example of financial brilliance. His massive net worth is a direct result of smart planning and bold decisions. He successfully shifted his focus from old industries to modern technology and clean energy.

    This flexibility keeps his company fully ready for the coming future. His financial story shows that holding good investments over the long term can create truly amazing wealth. It serves as a great inspiration for anyone looking to build strong and lasting value in the exciting world of business.

    S.No.Check Out These Interesting Posts You Might Enjoy!
    1Top Highest Leverage Brokers in India
    2Top Investors In India And Their Portfolios
    3Best YouTube Channels for Stock Market in India
    4Best Trading YouTube Channels in India
    5Books for Beginners in Trading & Investing

    Frequently Asked Questions (FAQs)

    1. What is Mukesh Ambani per second income? 

      It’s more than Rs.18,000 per Second.

    2. What are the benefits of studying Mukesh Ambani portfolio? 

      It teaches investors how spreading money across telecom, retail, and energy protects overall wealth.

    3. Who is richer, Ambani or Tata?

      Mukesh Ambani is the richest person according to Net worth, Tata largely owned in Tata trust & group companies.

    4. Does Mukesh Ambani receive a regular monthly salary? 

      No, he has taken a zero salary for six years, earning entirely through company dividends.

    5. Why is Mukesh Ambani investing in green energy? 

      He aims to make his company a global leader in clean energy for high future profitability.

  • Top 10 Debt-Free Companies in India

    Top 10 Debt-Free Companies in India

    Financial markets are highly fluctuating in nature with continuous ups and downs. During uncertain market situations a strong company needs to have a strong balance sheet that can become a protective shield for their businesses. Companies that have huge debt generally avoid paying high interest rates when the economy slows. 

    This financial safety acts as a powerful magnet for long-term investors. A clean balance sheet brings stability,consistent growth, and complete peace of mind. For those looking to build wealth steadily over the years,focusing on cash-rich businesses remains a highly successful strategy in today’s unpredictable market environment.

    What is a Debt-Free Company?

    Exploring the world of debt free stocks reveals businesses that run using their own money instead of taking bank loans. It relies completely on internal cash flows to manage its operations and expansion. 

    Some companies might have very tiny short-term obligations for daily operations. This could include pending payments to suppliers or small lease liabilities. True zero debt means the debt-to-equity ratio is exactly zero on the balance sheet.

    Zero debt means absolutely no bank loans exist on the books. Low debt means the company has a very small amount of debt compared to its overall equity. Usually, a debt-to-equity ratio below 0.1 is considered almost debt-free. Often, top debt free stocks in India actually fall into this low debt category because they keep borrowings strictly under control.

    These companies carry a much lower risk of going bankrupt during tough economic conditions. Finding strong debt free companies in India ensures that business profits go directly to shareholders rather than paying bank interest. 

    Top 10 Debt-Free Companies in India 2026 

    Let us look at the list of top 10 debt free companies based on their market capitalisation and debt status. 

    RankCompanySectorApprox. Market Cap (₹ Cr)Debt Status
    1Tata Consultancy Services LtdIT Services7,47,876Zero Debt
    2Life Insurance Corporation of IndiaInsurance5,46,543Zero Debt
    3Hindustan Unilever LtdFMCG5,19,424Low Debt
    4Sun Pharmaceutical Industries LtdPharmaceuticals4,57,025Low Debt
    5Maruti Suzuki India LtdAutomobile4,51,199Zero Debt
    6Infosys LtdIT Services4,22,393Zero Debt
    7ITC LtdFMCG3,61,851Low Debt
    8Bharat Electronics LtdDefense3,03,502Zero Debt
    9HCL Technologies LtdIT Services2,98,283Low Debt
    10Hindustan Aeronautics LtdDefense2,96,193Zero Debt
    (Data as of 8 July 2026)

    List of Top Debt-Free Companies in India 2026

    1. Tata Consultancy Services (TCS)

    A part of the TATA group, TCS is a global leader in the IT service sector. This company is completely debt free and has an efficient cash flow structure. With digitization all across the globe, the company’s focus is on digital transformation making it highly profitable and reliable for long term investors.

    2. Life Insurance Corporation of India (LIC)

    This is the largest life insurance providing company in India that even dominates the financial sector. The market share of the company is very huge and the day to day operations of the company are totally debt-free. LIC generates a massive cash revenue by collecting premium income from millions of policyholders.

    3. Hindustan Unilever

    This is one of the fastest and biggest consumer goods companies in India. Daily millions of households buy their products making them generate massive money and paying good dividends to the investors. The company has a very debt-to-equity ratio of 0.04.

    4. Sun Pharmaceutical Industries

    This is one of the largest global pharma companies that specializes in generic medicines. Medicine development requires intense R&D, making it highly dependent upon regular cash flow. But the company functions totally debt free with an debt-to-equity ratio of 0.04. With its global presence the company generates huge income from international sales.

    5. Maruti Suzuki India

    The company is the key player in the Indian passenger car market and even dominates this sector. Despite heavy investments and manufacturing cost the company runs totally debt free. The huge profits are used in R&D, expanding production and releasing new car models for the users. 

    6. Infosys

    This company is one of the other giants in the IT sector that has clients all across the globe. The company’s main function is to build software and manage IT systems for its customers. The company works totally debt-free without borrowing any money from the financial institutions. The company’s clean balance sheet and regular dividend payments are its key highlights.

    7. ITC

    This is a  very diversified business that deals in consumer goods, hotels, and agricultural products. The company has a very low debt-to-equity ratio of around 0.03. The company’s massive cigarette business helps the company to generate huge cash flow making it independent and does not rely on bank loans or debts. 

    8. Bharat Electronics

    This is one of the companies that is run by the state and is one of the prominent defence equipment manufacturers in India. It supplies critical radar and communication systems to the defence forces of India. The company is completely debt free and has a massive order lined up for its upcoming future.

    9. HCL Technologies

    HCL Technologies is a prominent IT and software services firm. The company helps global businesses with cloud computing and artificial intelligence solutions. The company’s debt to equity ratio is 0.09 meaning most of the revenue becomes the part of the revenue which is best for its future growth and dividends for the investors.

    10. Hindustan Aeronautics

    This company designs and manufactures aircraft and helicopters for the Indian defence forces. The company is completely debt free despite its huge investments and day to day running cost even though the aerospace industry is very capital intensive in nature. The company has a secured future as it has long-term government contracts and huge existing cash flow. 

    Read Also: Best Low-Risk Stocks in India

    How to Select Best Debt Free Companies in India 

    Picking the best companies requires looking at several financial health markers. The following pointers shall be used by the investors to select the top debt free companies in India. 

    • Market Capitalisation: This shows the total value of the company in the stock market. Only large and highly established companies are selected to ensure safety.
    • Debt-to-Equity Ratio: This tells us about comparison between the total debt of a company and shareholder equity. The selected companies must have a ratio of zero or strictly below 0.1.
    • Long-term Borrowings: Companies are checked to ensure they do not have large bank loans. Avoiding long-term debt keeps heavy interest expenses away.
    • Cash Reserves: A good company must have plenty of cash in its bank accounts. Rich cash balances act as a safety net during tough economic times.
    • Profitability: The business must make real money consistently. Companies that sell products at a good profit margin are highly preferred.
    • Return on Equity (ROE): ROE tells us about how well the company is using the money of the shareholders to generate profits. A high ROE shows capable and efficient business management.
    • Consistent Earnings: Income should remain steady year after year. Businesses that make money in all market conditions are much safer.
    • Business Stability: The company needs a proven track record of success. Having a dominant market share ensures the business will not easily fail.

    Benefits of Investing in Debt-Free Companies

    Adding such companies to an investment portfolio brings multiple advantages. Here are some of the main benefits.

    • Lower Financial Risk: A company that is debt free performs well and is reliable as there are no or very less chances of defaulting or going bankrupt. 
    • Better Cash Flow Management: All the money entering the business stays inside the business.Management does not have to worry about paying monthly interest bills.
    • Higher Profit Retention: Because interest payments are zero, the net profit is naturally higher. The company can distribute more of these profits to shareholders as dividends.
    • Stronger Performance During Economic Slowdowns: When the economy suffers, heavily indebted companies struggle to survive. Debt-free companies easily sail through these tough periods.
    • Greater Financial Flexibility for Expansion: If a new opportunity arises, cash-rich companies can fund the project instantly. They do not have to wait for bank loan approvals.

    Factors to Consider Before Investing in Debt-Free Companies

    Even without loans, a stock must be evaluated carefully before investing. Here are the key factors to check.

    • Valuation Matters: If a company has a clean balance sheet it doesn’t mean that the stock price is cheap. One should always check if the price of the stock is too expensive or not by looking at the valuation of the company.
    • Revenue Growth: The company shall show continuous growth because if the sales are not growing it means the company might stagnate. 
    • Earnings Consistency: Company profits shall not fluctuate wildly. A steady and predictable growth makes sure that the investment is safe. 
    • Free Cash Flow: This is the actual cash left in the bank after paying for daily operations. High free cash flow indicates a very healthy business.
    • Return Ratios: High return ratios show business efficiency. These numbers prove the management is using capital wisely to generate returns.
    • Industry Outlook: The sector the company operates in must have a bright future. A great company in a dying industry is still a bad investment.
    • Management Quality: The leaders of the company must be honest and visionary. A good management team can take the company to the next level even if there are some challenges.

    Are Debt-Free Companies Good For Investments

    Investors often debate if zero debt guarantees a perfect investment. The answer has both positive and negative sides.

    • Advantages: The primary advantage is complete financial safety. Such companies usually survive the falling market and also make sure that the investors get regular dividends. As these companies are not under any debt, decision making is totally in their hands. 
    • Disadvantages: Sometimes, completely avoiding loans can slow down growth. Taking on a small amount of cheap debt can help a business build new factories much faster. A company that refuses all debt might miss out on huge market opportunities, allowing aggressive competitors to steal market share.

    Risks of Investing Only in Debt-Free Stocks

    While safe, focusing entirely on cash-rich stocks brings its own set of unique risks.

    • Overvaluation: Because these stocks are considered very safe, everyone wants to buy them. This high demand can push the stock price to very expensive levels.
    • Slow Growth: Companies that only use their own cash might grow slower than those using bank loans.Slower business growth can lead to smaller returns for shareholders over time.
    • Limited Capital Expansion: Massive projects like building a giant manufacturing plant require huge funds. Internal cash alone is sometimes not enough to fund such massive dreams.
    • Sector Risks: A debt-free technology company will still suffer if the global technology sector slows down.A clean balance sheet cannot fix a sudden drop in customer demand.
    • Market Volatility: No stock is immune to stock market crashes. If the overall market falls heavily, even the safest zero-debt stocks will see their share prices drop.

    Read Also: Most Undervalued Stocks in India

    Financial Overview of Debt-Free Stocks

    The table below provides a detailed financial comparison of these ten companies. All information is accurate as per July 06, 2026.

    CompanyROE (%)ROCE (%)Operating Margin (%)Net Profit Margin (%)Debt to EquityDividend Yield (%)
    TCS45.8858.6526.6718.520.005.26
    LIC32.740.865.175.880.002.32
    Hindustan Unilever30.8522.5422.4423.380.0410.55
    Sun Pharma13.7319.4528.6719.780.040.79
    Maruti Suzuki13.6916.9610.407.850.000.79
    Infosys32.0040.2323.3416.490.002.50
    ITC28.5336.3535.5426.170.032.42
    Bharat Electronics25.2731.8829.9021.810.000.62
    HCL Technologies22.1428.3318.3812.790.094.91
    Hindustan Aeronautics22.2113.7436.6127.410.000.79
    (Data as of March 2026)

    Conclusion

    Debt-free companies offer a wonderful mix of safety and stability. A clean balance sheet shows that the management runs a highly disciplined operation.

    While no stock is entirely free of risk, companies without heavy loan burdens easily survive economic storms and continue to reward shareholders. By focusing on valuation and consistent growth, investors can use these stocks to build a very resilient long-term portfolio.

    For more market news and insights, download Pocketful – offering users zero brokerage on delivery trades and an easy to use platform designed for both beginners and experienced investors.

    S.NO.Check Out These Interesting Posts You Might Enjoy!
    1Best Jewelry Stocks in India
    2List of Best Monopoly Stocks in India
    3Top 10 Best Summer Stocks in India
    4List of Top 10 Blue Chip Stocks in India with Price
    5List Of Best Logistics Stocks in India

    Frequently Asked Questions (FAQs)

    1. What makes a company completely debt-free? 

      A company is debt-free when it runs entirely on its own cash and profits. It does not hold any long-term borrowings from banks or financial institutions.

    2. Can low debt companies be considered safe just like the zero debt companies? 

      Investors can rely on companies that have a debt-to-equity ratio below 0.1, as these companies can be considered safe. This small amount of debt can be considered for daily operations cost.

    3. Why do debt-free companies pay better dividends? 

      Since these companies do not have to pay large monthly interest bills to banks, they retain higher net profits. They often share these extra profits directly with their investors as cash dividends.

    4. Do debt-free stocks fall during a market crash? 

      Yes, all stock prices fluctuate based on overall market moods. Although debt-free companies show less downward movement and they have the potential to recover faster as the business core is financially strong. 

    5. Is it a good sign or a bad sign if some company is debt free?

      It is not a bad sign, but such companies have a slow growth pattern. Companies that do not rely on bank loans grow slowly which can hamper their opportunity to grab the market. 

  • Open Free Demat Account

    Join Pocketful Now

    You have successfully subscribed to the newsletter

    There was an error while trying to send your request. Please try again.

    Pocketful blog will use the information you provide on this form to be in touch with you and to provide updates and marketing.