In a country where achieving financial inclusion remains a challenge, Bandhan Bank has brought hope to millions. From its humble beginnings as a microfinance initiative, it has grown into a fully-fledged universal bank, catering to the unbanked sections of India with great dedication.
Today’s blog presents a case study on Bandhan Bank from its grassroots beginnings, business model, and SWOT analysis to understand the factors driving its growth.
Company Overview and History

Bandhan Bank stands as a prominent Indian universal bank, recognized for its significant emphasis on financial inclusion and catering to markets with limited banking presence, particularly in semi-urban and rural settings. Its origins date back to 2001, starting as a non-profit organization focused on advancing financial inclusion and empowering women in rural Bengal. Later, Bandhan broadened its scope by acquiring an NBFC in 2006, which aided in expanding its microfinance operations. By 2010, it had grown to become India’s largest microfinance entity. In a landmark shift, Bandhan obtained a banking license from the Reserve Bank of India in 2015, allowing it to evolve into a universal bank offering comprehensive financial solutions. Presently, Bandhan Bank manages an extensive network of locations throughout India, serving varied clientele through retail, MSME, corporate, and digital banking channels, all while upholding its dedication to inclusive finance and increasing financial accessibility in previously unreached areas.
Read Also: Bandhan Long Duration Fund NFO: Objective, Benefits, Risks, and Suitability Explained
Business Model of Bandhan Bank
As of 2026, Bandhan Bank continues to widen its footprint across India, steadily adding new customers and deepening existing relationships. Based on the bank’s latest reported data up to December 31, 2025 (FY 2025–26), it now serves a customer base of more than 3.25 crore individuals.
Product Portfolio of Bandhan Bank
The bank provides numerous services, which include the following:
- Digital banking – The bank offers feature-rich internet banking services to customers to help them meet their everyday banking needs.
- Housing Finance – The Bank offers individuals home and property loans, including loans for the purchase, construction, repair, renovation, or extension of dwelling units. It also provides Loan Against Property (LAP) on self-occupied residential property and loans against rent receivables on commercial property.
- Retail Liabilities & Retail Assets – This segment offers gold loans, personal loans, auto loans, etc.
- Agri-Business Loan – Under this segment, the bank offers a wide range of credit for agricultural activities to all consumers involved in the agri value-chain system.
- MSME Lending – It offers an array of loan products at competitive interest rates to cater to the needs of micro, small, and medium enterprises (MSMEs).
- Commercial LAP – Catering to various entities such as proprietorships, partnerships, private limited and non‑listed public limited companies, and individual borrowers for loans against property (LAP).
- Third-Party Products – This segment covers insurance products, mutual funds, etc.
Market Data of Bandhan Bank
| Current Market Price | INR 155 |
| Market Capitalization | INR 24,479 crores |
| 52 Week High | INR 192 |
| 52 Week Low | INR 128 |
Financial Statements of Bandhan Bank
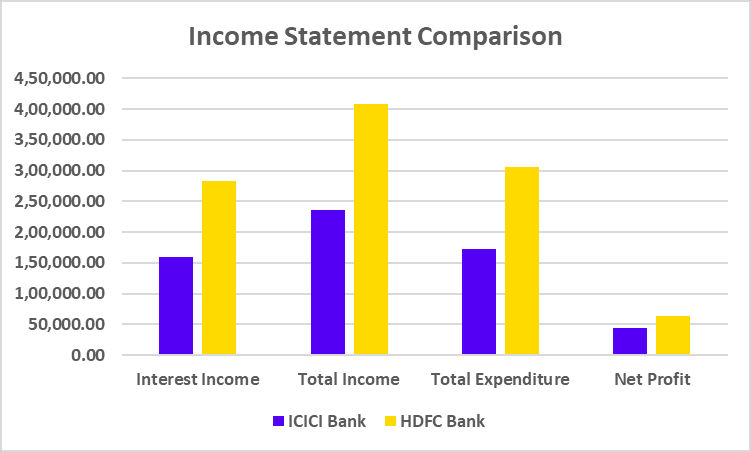
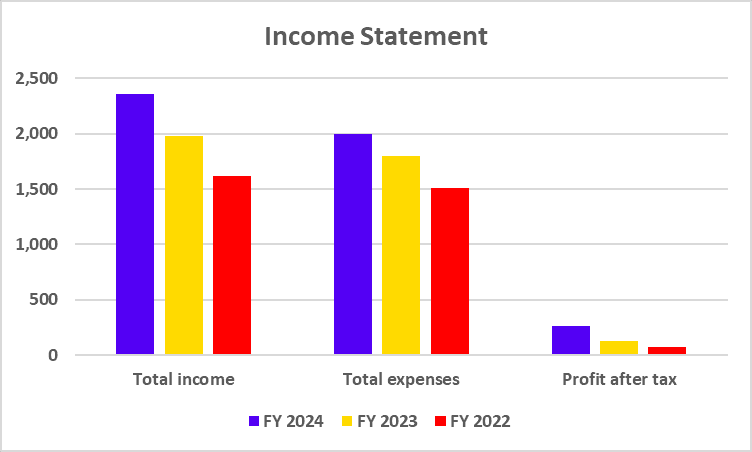
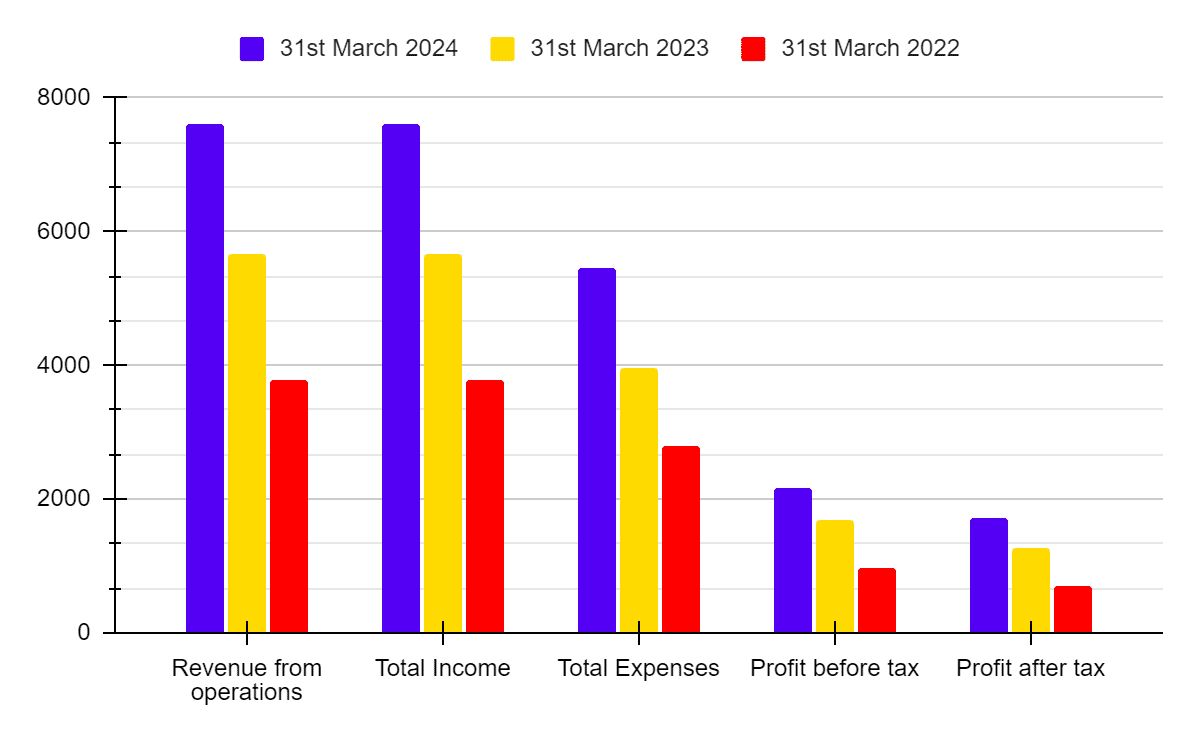
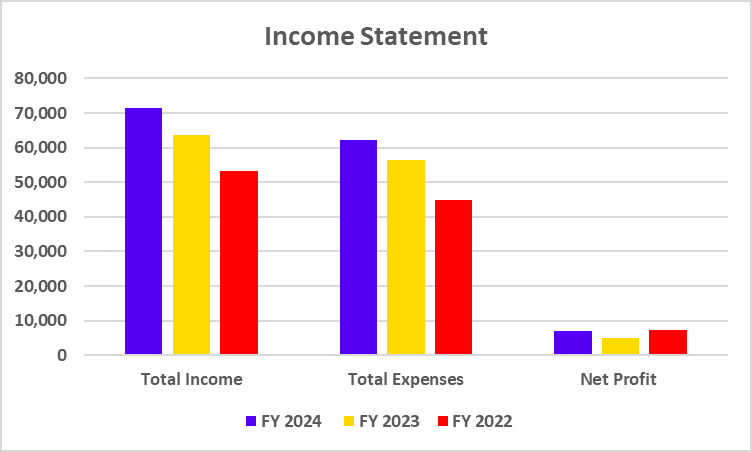
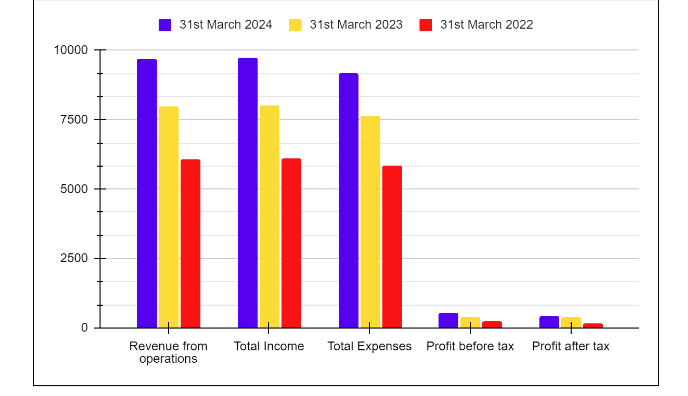
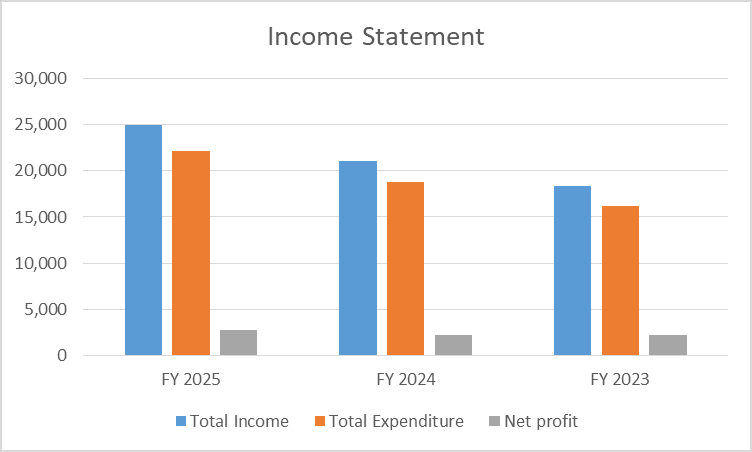
Income Statement
| Key Metrics | FY 2025 | FY 2024 | FY 2023 |
|---|---|---|---|
| Total Income | 24,915 | 21,034 | 18,373 |
| Total Expenditure | 22,169 | 18,804 | 16,178 |
| Net profit | 2,745 | 2,230 | 2,195 |
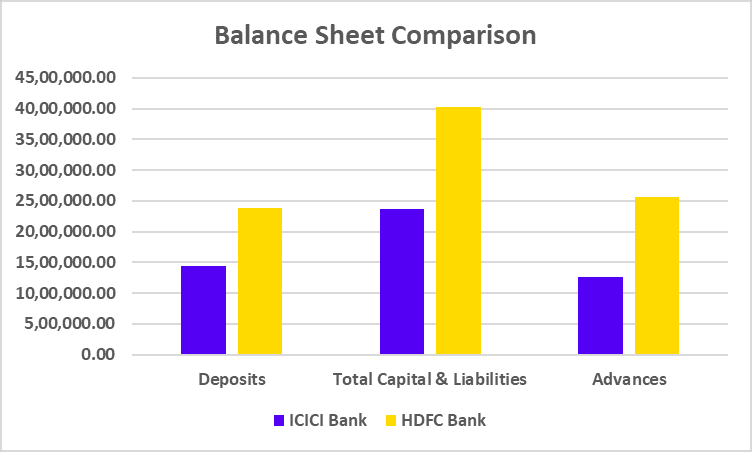
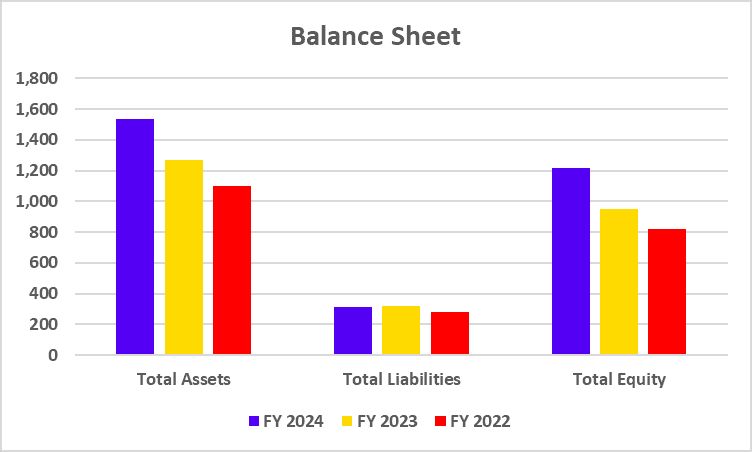
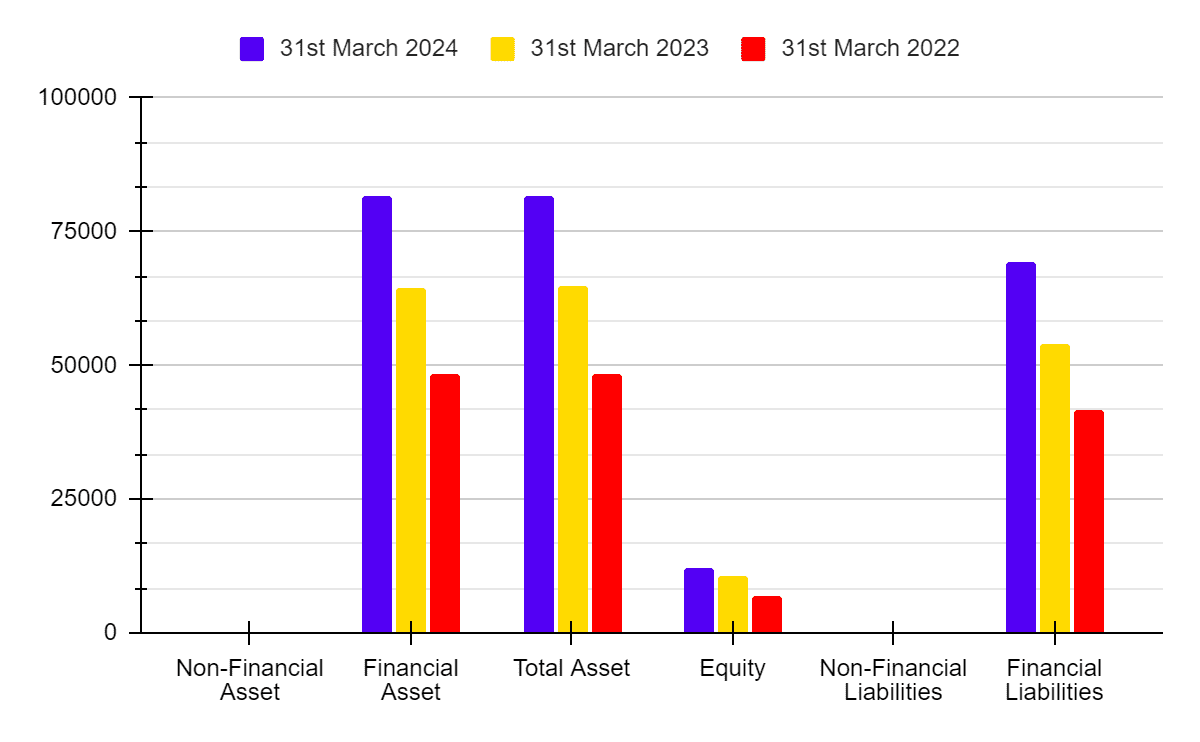
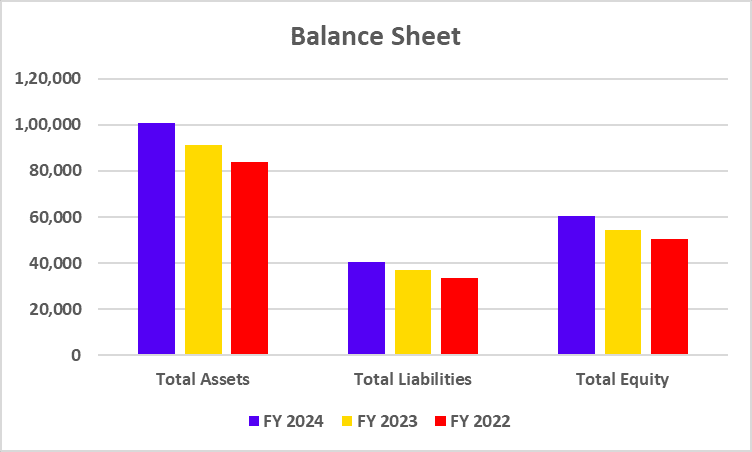
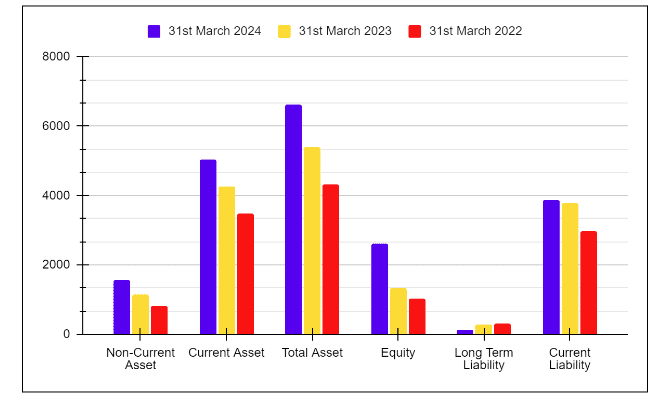
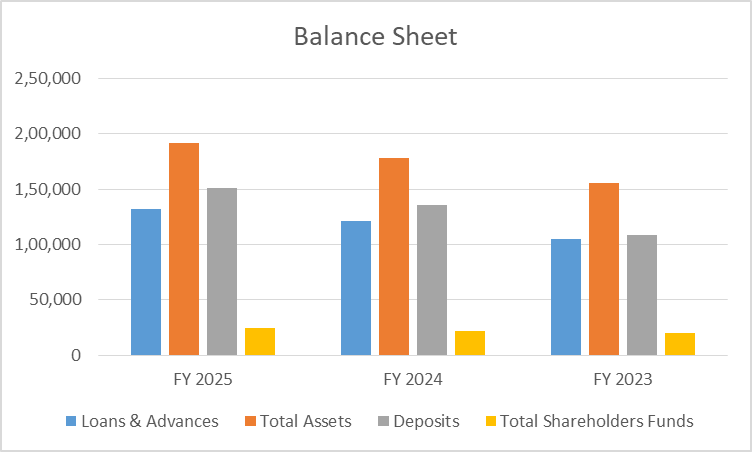
Balance Sheet
| Key Metrics | FY 2025 | FY 2024 | FY 2023 |
|---|---|---|---|
| Loans & Advances | 1,31,987 | 1,21,136 | 1,04,756 |
| Total Assets | 1,91,476 | 1,77,841 | 1,55,769 |
| Deposits | 1,51,212 | 1,35,201 | 1,08,069 |
| Total Shareholders Funds | 24,605 | 21,609 | 19,584 |
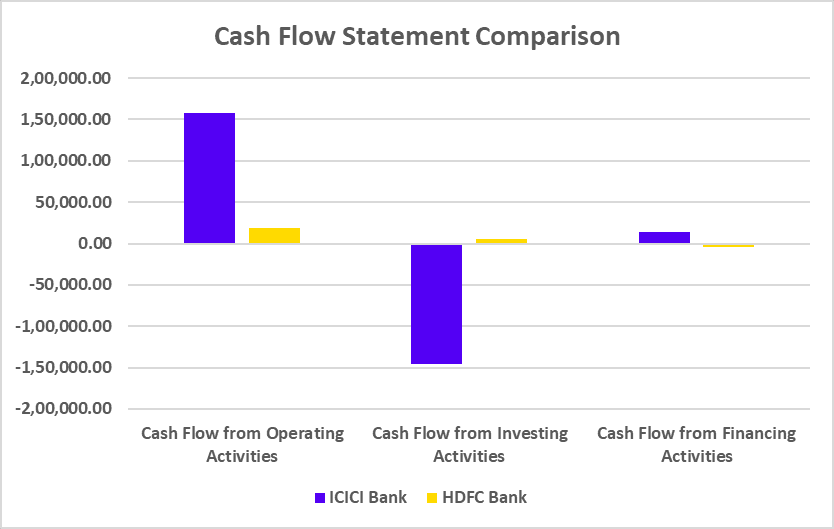
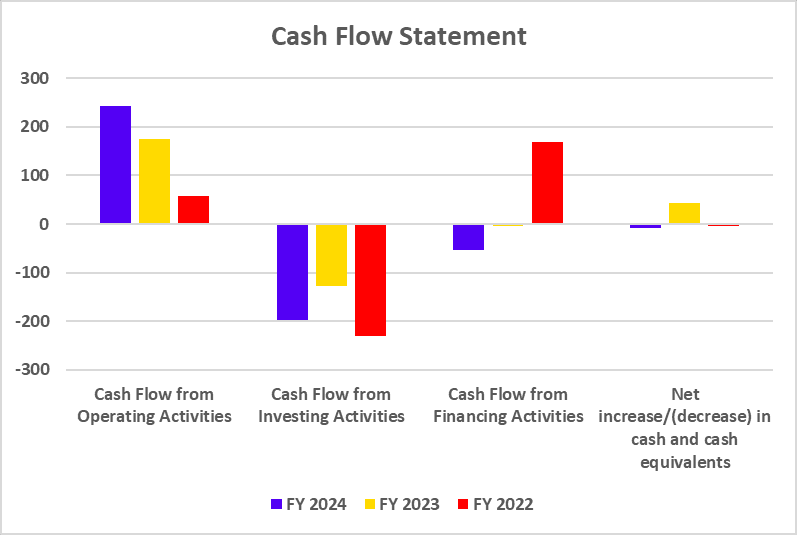
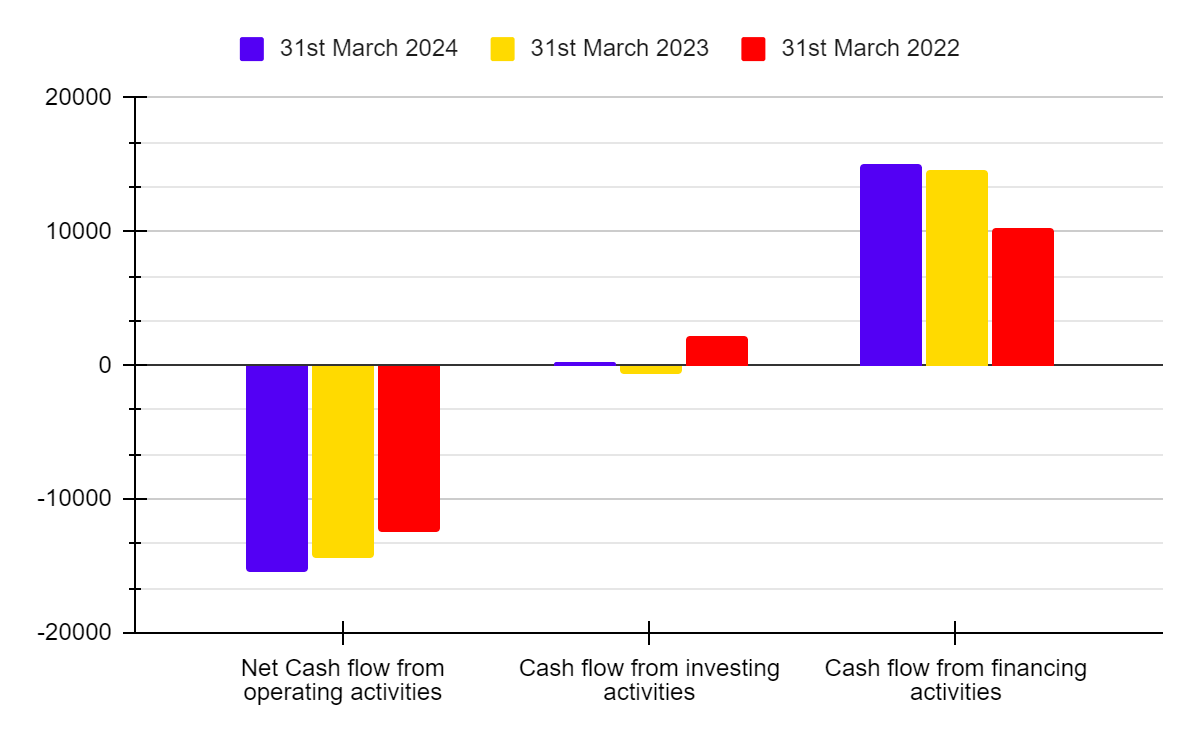
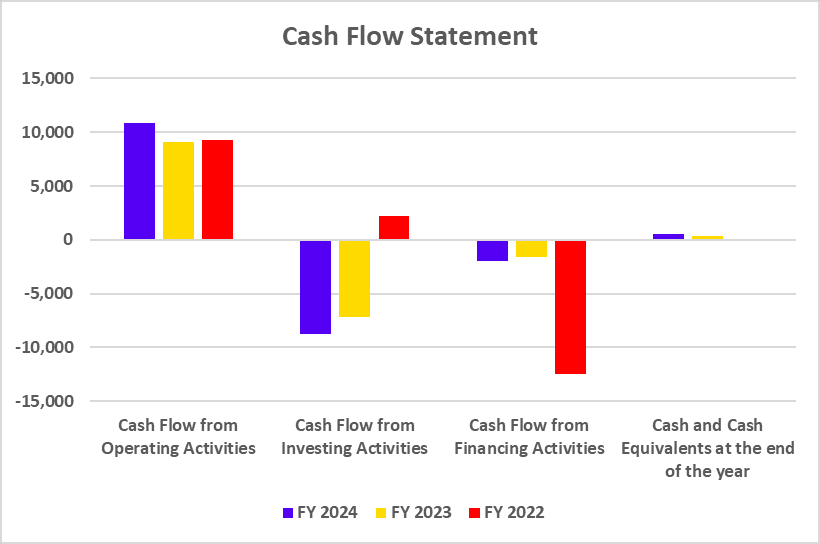
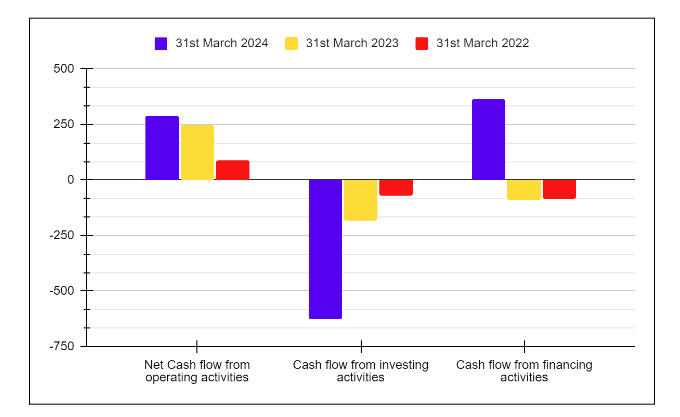
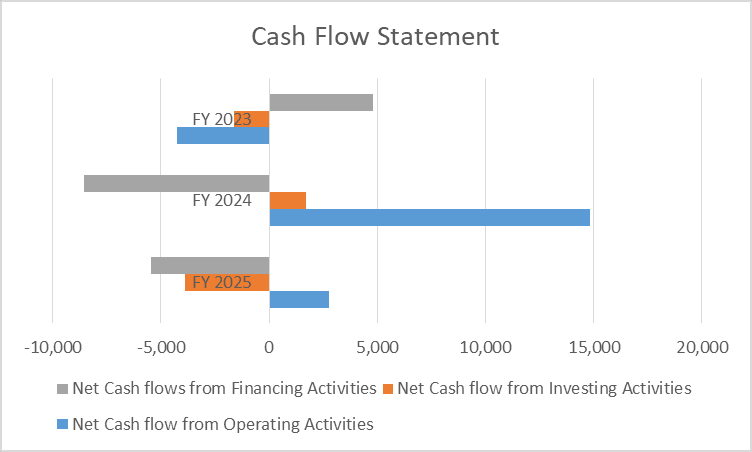
Cash Flow Statement
| Key Metrics | FY 2025 | FY 2024 | FY 2023 |
|---|---|---|---|
| Net Cash flow from Operating Activities | 2,752 | 14,808 | -4,244 |
| Net Cash flow from Investing Activities | -3,878 | 1,690 | -1,617 |
| Net Cash flows from Financing Activities | -5,474 | -8,578 | 4,791 |
Key Performance Indicators (KPIs)
| Key Metrics | FY 2024-25 | FY 2023-24 | FY 2022-23 |
|---|---|---|---|
| ROCE (%) | 3.95 | 3.83 | 4.65 |
| Net Interest Margin (%) | 6.00 | 5.80 | 5.94 |
| Net NPA (in %) | 1.28 | 1.11 | 1.17 |
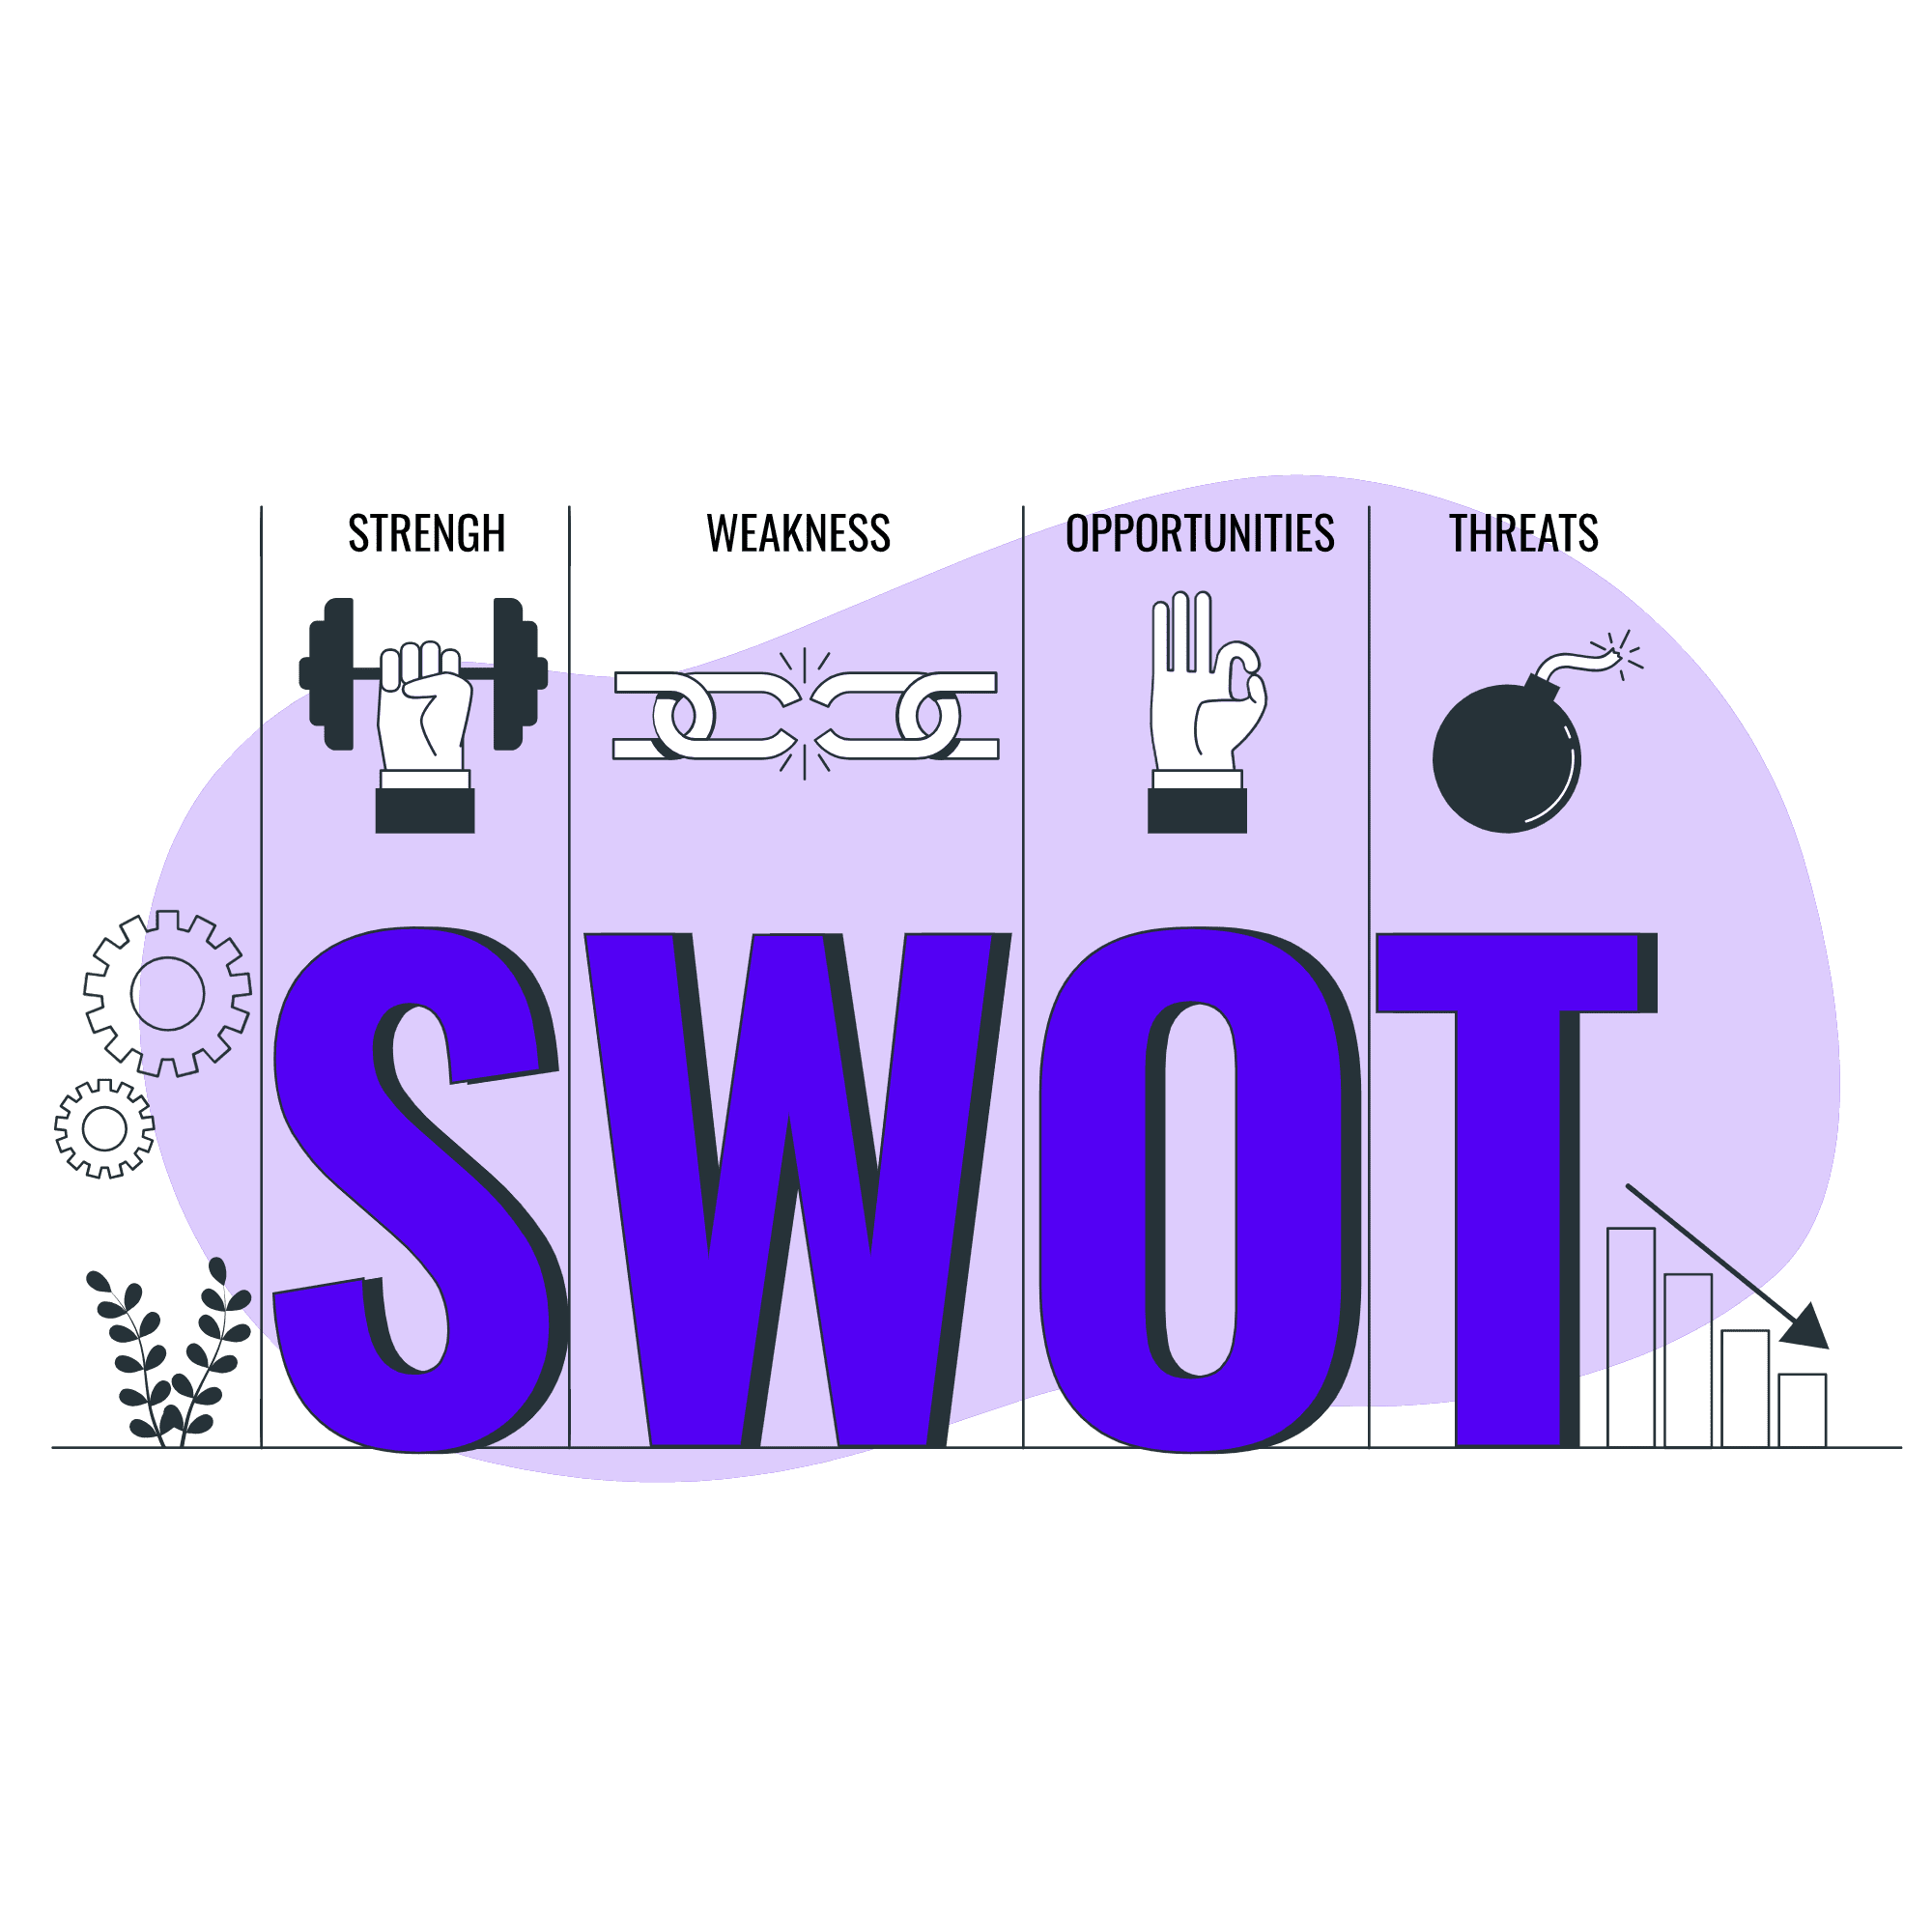
SWOT Analysis of Bandhan Bank
The Bandhan Bank SWOT Analysis highlights its strengths, weaknesses, opportunities, and threats, showcasing its market position and growth potential.
Strengths
- The bank keeps growing. Total income jumped from ₹18,373 crore in FY23 to ₹24,915 crore in FY25. Net profit moved up too, hitting ₹2,745 crore. That’s a clear sign their operations are running better than before.
- Deposits look strong – they climbed to ₹1.51 lakh crore. Loans and advances hit ₹1.32 lakh crore in FY25. All this pushed their balance sheet to a healthier place.
- Net Interest Margin tells the same story. It improved to 6.0% in FY25. That shows they’re lending well and getting good returns on their assets.
- Shareholder funds are up as well. Equity rose to ₹24,605 crore, so the bank’s capital position and overall stability just got a boost.
Weaknesses
- ROCE slipped to 3.95% in FY25, still falling short of what’s ideal for a bank.
- Asset quality took a hit too—net NPA climbed to 1.28% in FY25, a sign the loan book’s feeling some strain.
- Operating cash flow swung down hard this year. The drop from FY24 to FY25 shows earnings aren’t reliably turning into cash.
- Expenses shot up right along with income, so margins barely budged.
Opportunities
- Profitability’s got room to grow. If the company uses assets more efficiently and keeps a closer eye on costs, shareholders see the benefit – plain and simple.
- There’s real opportunity in credit growth, too. Growing the loan book, especially in retail and MSME areas, pushes income higher.
- Margins look solid right now, with a 6% NIM. Finding ways to lower funding costs will help keep earnings headed in the right direction.
- And then there’s valuation. Trading at ₹155, well under last year’s high of ₹192, there’s upside here if the numbers keep moving the right way.
Threats
- Asset quality risks: If NPAs keep rising, profits and capital buffers take a hit.
- Interest rate swings: Shifts in rates change margins and bump up borrowing costs.
- Liquidity pressure: With negative financing cash flows lately, things get tight fast if funding dries up.
- Competition: Bigger private banks and NBFCs push hard, making it tougher to grow and keep pricing power.
Conclusion
Bandhan Bank has made great progress in the Indian banking industry, especially in terms of financial inclusion. Its focus on microfinance and its move into universal banking makes it a major player in the market. However, challenges such as asset quality and technological adoption need to be addressed to ensure sustained growth. Bandhan Bank must focus on its strengths and address its weaknesses to succeed in the competitive banking industry. The bank can further fortify its market position by capitalizing on opportunities such as digital banking and geographical expansion.
Frequently Asked Questions (FAQs)
When was Bandhan Bank founded?
Bandhan Bank’s roots trace back to 2001, when it started as a non-profit microfinance organization. It received its banking license and commenced operations as a bank in 2015.
Is Bandhan Bank listed on the Indian stock exchanges?
Yes, it is listed on the NSE and BSE.
What is Bandhan Bank’s current market price and market capitalization?
The market price of the Bandhan Bank stands at INR 212, and the market capitalization is INR 34,201 crores on 2 August 2024.
How has Bandhan Bank performed financially?
Bandhan Bank has shown decent growth in recent years, expanding its branch network and customer base.
Is Bandhan Bank a good investment option?
Investing in banks needs a long-term outlook because of market fluctuations and economic cycles. Like any other bank, Bandhan Bank carries inherent risks, and investors should analyze their risk appetite before investing.