Have you ever thought of investing in the pharmaceutical companies whose products you generally purchase when you’re sick? Do you know where pharma companies get their revenue from and how they operate? What limitations do the regulatory bodies have placed on them?
We’ll uncover all such questions in this blog.
Company Overview
Dilip Shanghvi founded Sun Pharmaceutical Industries Limited in 1983 to make medicines accessible and affordable to the general public. Over time, the company has expanded to become one of the biggest pharmaceutical companies in India and the fourth-largest generic pharmaceutical company globally. The corporation operates forty-three manufacturing sites.
The company employs about 41,000 people worldwide and complies with regulations set forth by several regulatory bodies, including the Pharmaceutical and Medical Devices Agency (PMDA) in Japan, the European Medicines Agency (EMA), and the US Food and Drug Administration (FDA).
Business Model

Sun Pharma’s business model is supported by two key pillars: a wide product range and an emphasis on research and development.
Product Portfolio
The company provides a wider spectrum of ailments with competitively priced, high-quality generic medications. In addition, the business sells specialty medications that are used to treat serious and chronic disorders.
Research and Development
About 6 to 8% of Sun Pharma’s total income is allocated to research and development, which expands the company’s current product line and creates new medications. They maintain their competitive advantage by extensively spending on research and development.
Financial Highlights
Let’s have a look at the financials of the Sun Pharma:
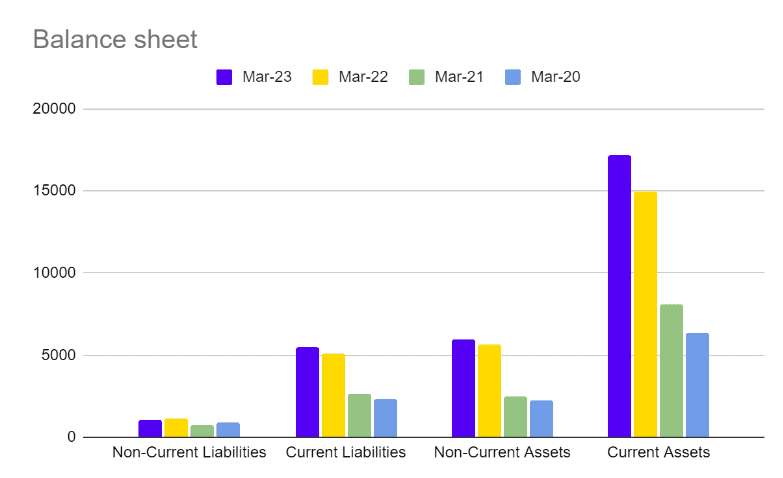
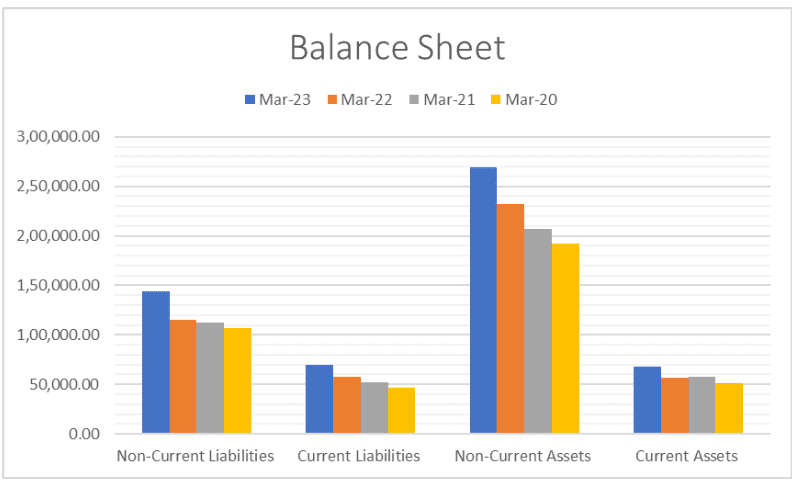
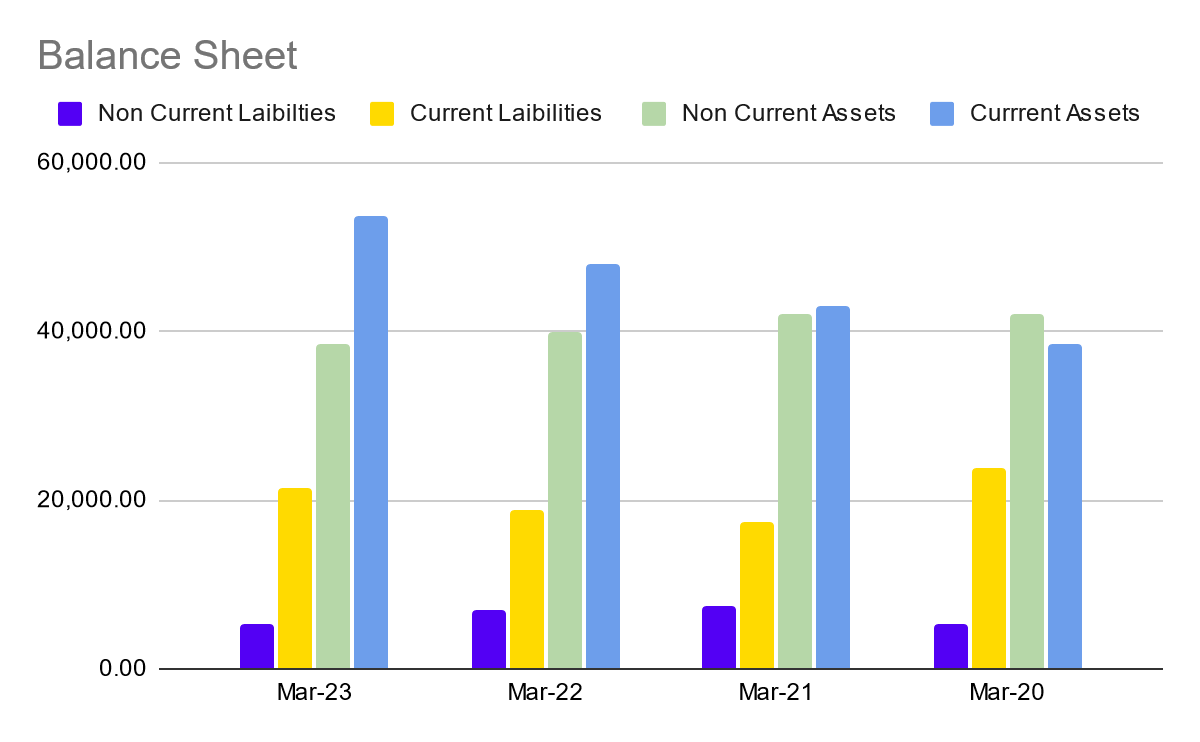
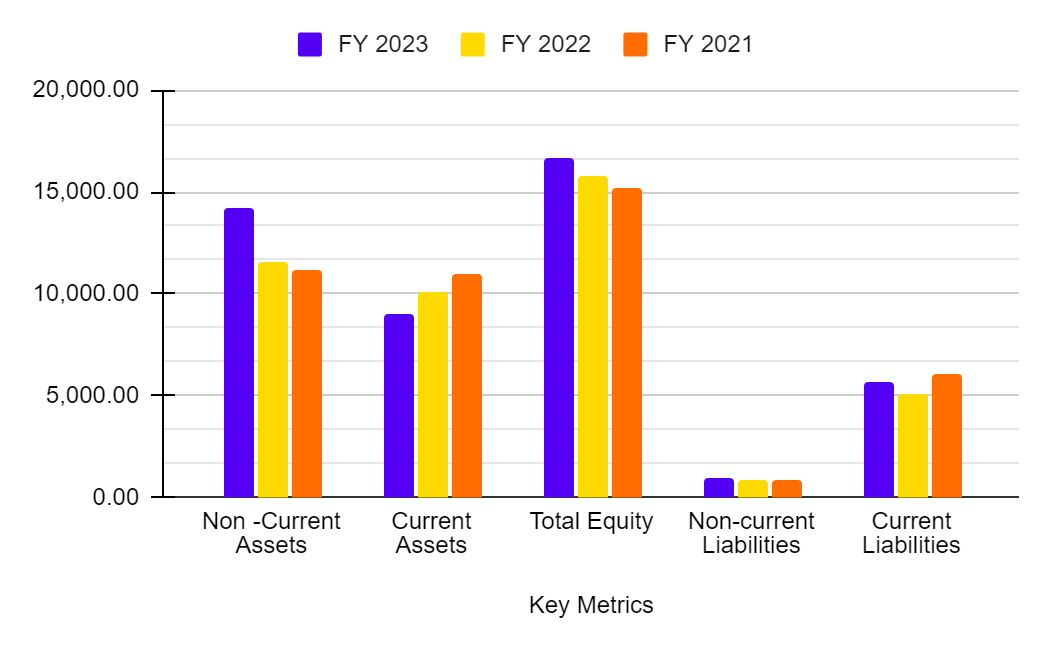
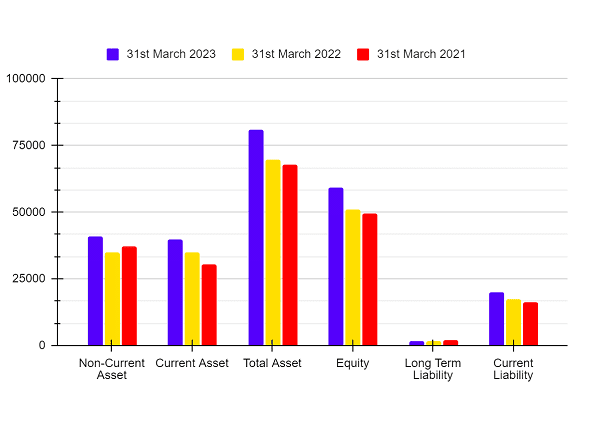
Balance Sheet (In INR crore)
| Particulars | 31st March 2023 | 31st March 2022 | 31st March 2021 |
| Non-Current Asset | 40,860.25 | 34,943.17 | 37,224.65 |
| Current Asset | 39,861.94 | 34,864.60 | 30,442.08 |
| Total Asset | 80,743.59 | 69,807.77 | 67,666.73 |
| Equity | 59,315.47 | 51,066.11 | 49,479.83 |
| Long Term Liability | 1,521.12 | 1,533.21 | 2,041.27 |
| Current Liability | 19,906.38 | 17,208.45 | 16,145.63 |
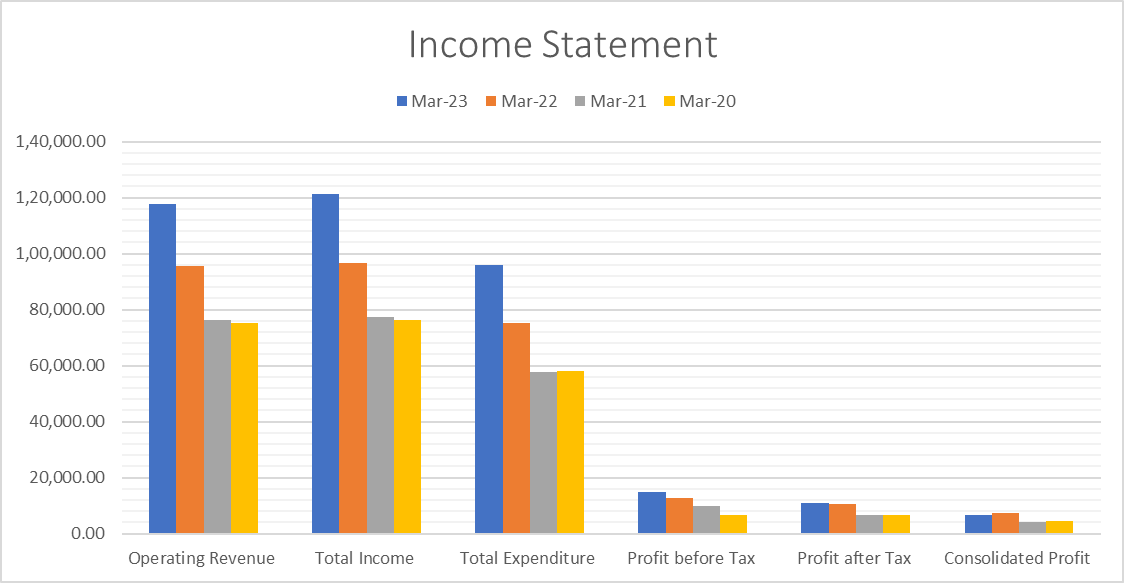
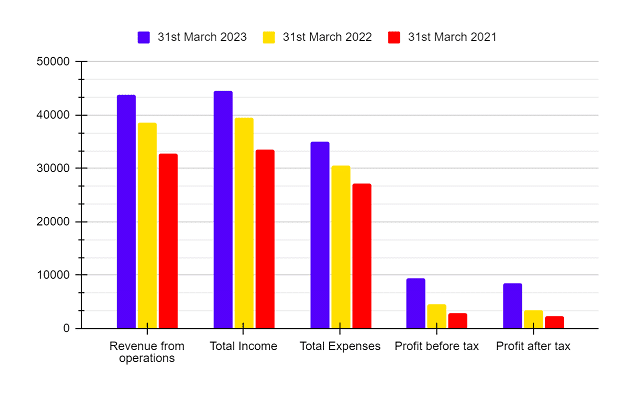
Income Statement (In INR crore)
| Particulars | 31st March 2023 | 31st March 2022 | 31st March 2021 |
| Revenue from operations | 43,885.68 | 38,654.49 | 32837.5 |
| Total Income | 44,520.20 | 39,576.00 | 33,473.48 |
| Total Expenses | 34,940.32 | 30,527.86 | 27,228.15 |
| Profit before tax | 9,408.43 | 4,481.32 | 2,799.37 |
| Profit after tax | 8,512.94 | 3,389.28 | 2,272.35 |
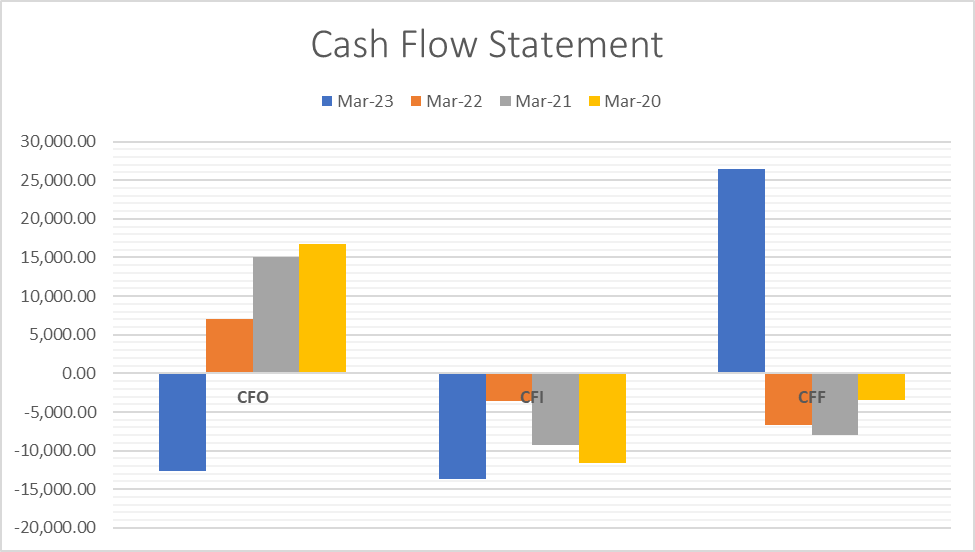
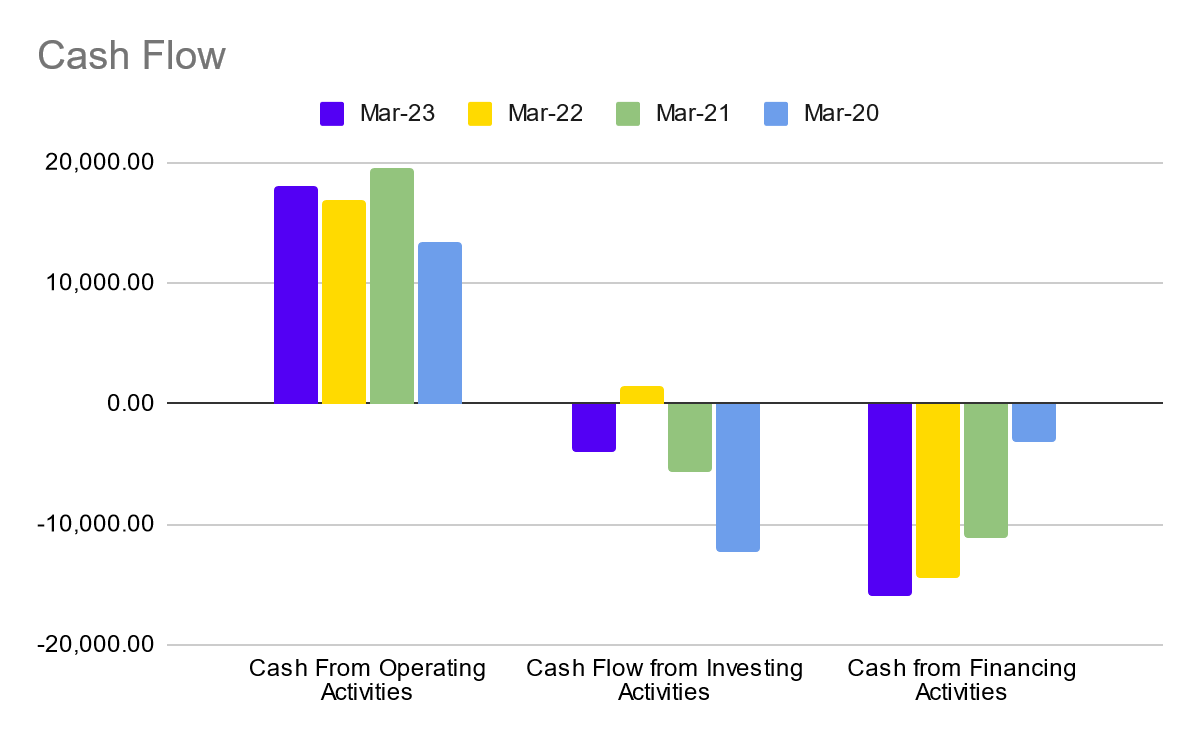
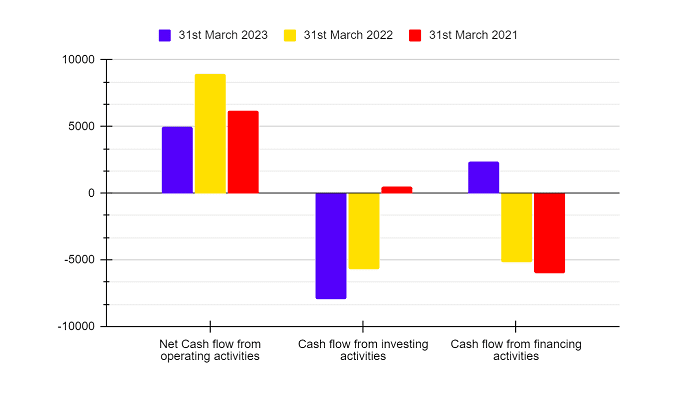
Cash Flow Statement (In INR crore)
| Particulars | 31st March 2023 | 31st March 2022 | 31st March 2021 |
| Net Cash flow from operating activities | 4,959.33 | 8,984.54 | 6,170.37 |
| Cash flow from investing activities | -7,943.68 | -5,724.74 | 536.22 |
| Cash flow from financing activities | 2,376.07 | -5,193.46 | -5,980.48 |
Key Performance Indicators (KPIs)
| Particulars | 31st March 2023 | 31st March 2022 | 31st March 2021 |
| Operating Profit Margin (%) | 24.75 | 16.13 | 19.52 |
| Net Profit Margin (%) | 8.12 | -0.64 | 16.71 |
| Return on Capital Employed (%) | 15.79 | 8.2 | 8.15 |
| Current Ratio | 2 | 2.04 | 1.89 |
| Return on Net Worth (%) | 15.13 | 6.81 | 6.24 |
| Debt to Equity Ratio | 0.11 | 0.02 | 0.07 |
Sun Pharma’s operating profit margins have improved year over year, rising from 16.13% in 2022 to 24.75% in the financial year 2023. The company’s return on net worth ratio has also improved over time.
SWOT Analysis
Strength
- The company is a market leader and is among India’s top 5 pharma companies, having a solid brand presence for a long period.
- The product portfolio of the company is well diversified which includes products from generic to specialty pharmaceuticals.
- The company’s investment in the research and development department allows it to improve its product continuously.
- The company’s financial performance has improved over the period, their profit and revenue both have increased in the past 3 years.
Weakness
- The regulations in the pharma industry are stringent, and the company has faced various challenges issued by the USFDA.
- A major portion of the company’s revenue comes from generic medicines; any price change would lead to a decrease in their revenue.
- The company faces stiff competition from various national and international players.
Opportunity
- The company can expand its business overseas in emerging markets such as Southeast Asia, Africa, and other European Nations.
- Along with generic medicines, the company can focus more on specialty pharmaceuticals, which typically have higher margins.
- The company spends a higher percentage of its revenue on product research and development, however, there’s still room to work with biotech companies and other research institutions to expand its product line.
Threat
- Pharma is a highly competitive market; there are many well established players in the pharmaceutical sector, and any change in the product’s price will result in a significant reduction in the company’s profit.
- Any kind of disruption in the supply chain of the company would directly affect its sales and profit.
- The Sun Pharma owns several patents, and their expiration would result in increased competition from generic drug makers. It can significantly reduce the margins of the company.
Awards & Recognitions
- According to patient groups, the company is the best generic pharmaceutical company in the “Corporate Reputation of Pharma” study conducted in 2021.
- The Best New Product Introduction award is given to Sun Pharma by DIANA (Distribution Industry Award for Notable Achievements in Healthcare) at the 2021 Annual Healthcare Distribution Alliance Conference.
- In 2020, the business was given the Global Peacock Award for Corporate Social Responsibility.
Conclusion
The healthcare market is constantly changing, and Sun Pharma is a pioneer in this field since it prioritizes drug development and research while leading the way for a healthier and more promising future for everybody. The company manages to conquer its many rivals, despite the challenges it faces, with effectiveness. The business is growing exponentially and is in excellent financial standing. Annually, their operational revenue is likewise rising in tandem with this.
However, if you want to invest in this company, you should analyze the risks of the company in detail as activities of Pharma companies are closely observed by the USFDA and other regulatory bodies. Further, it is suggested to consult with your advisor before making any investment decision.
Frequently Asked Questions (FAQs)
Who is the founder of Sun Pharma?
Mr. Dilip Shanghvi is the founder and managing director of Sun Pharma Industries Ltd.
What is the total promotor pledging in Sun Pharma Industries?
As of December 2023, the promoters have pledged a total of 1.33% of total equity.
Who are the main competitors of Sun Pharma Industries Ltd?
Sun Pharma faces major competition from its listed peers, which include Cipla, Dr. Reddy, Zydus Life Sciences, Divis Labs, etc.
Is Sun Pharma Industries Ltd a profitable company?
Yes, Sun Pharma Industries is a profitable company, it has posted a profit of INR 8,512.94 crores for the financial year ended 2023 and has been continuously posting profits for the last 10 years.
How big is Sun Pharma Company?
Sun Pharma is India’s largest pharmaceutical company and the 4th largest generic drug company in the world.