You must have heard about Kotak Mahindra Bank, but ever thought about its rich history and kind of products and services it offers?
We will deep dive into the Kotak Mahindra Bank in this blog and explore their diverse range of products and services, from everyday banking to wealth management solutions.
Overview of Kotak Mahindra Bank
Kotak Mahindra Bank is a leading Indian banking and financial services company headquartered in Mumbai. It offers a wide range of banking products and financial services for corporate and retail customers. It is India’s third largest private sector bank by market capitalisation.
Kotak Mahindra was founded in 1985 by Uday Kotak as Capital Management Finance, an investment and financial services company.
In the year 1986, Anand Mahindra and his father Harish Mahindra, invested in the company which was subsequently renamed Kotak Mahindra Bank. The company was initially engaged in bill discounting, along with lease and hire-purchase activities.
In 2003, Kotak Mahindra Bank became India’s first non-banking finance company to convert into a commercial bank.
Did you know?
Kotak’s 811 draws its name from 8-11-2016, when the government announced demonetisation. According to Uday Kotak, founder of Kotak Mahindra Bank, it was the day that changed India.
Business Model of Kotak Mahindra Bank

Products and services offered by the Kotak bank include banking, financing through non-banking financial firms (“NBFCs”), asset management, life and general insurance, stock broking, investment banking, wealth management, and asset reconstruction for all customers and geographic segments in India.
Collectively, Kotak Mahindra Bank conducts business in foreign markets via foreign subsidiaries or branches located in the US, UK, Singapore, Mauritius, UAE, and Mauritius.
The banking operations are categorised into the following:
- Consumer Banking – It includes deposit taking, disbursing loans such as home loans, loans against property, personal loans, working capital loans, and offers various products such as debit cards and credit cards.
- Commercial Banking – Under this, the bank provides commercial loans to small and medium-sized enterprises, tractor loans, commercial vehicles loans, construction equipment financing, and agricultural finance.
- Corporate Banking – Provide products and services such as corporate loans, trade finance, foreign exchange & derivatives, and cash management activities.
- Treasury Management – Under this segment, the bank offers standardised and structured client solutions including loan syndication, bond placement, mezzanine financing, and securitisation through the Debt Capital Markets division. Additionally, the treasury also provides foreign exchange services and interest rate risk management solutions.
Key Highlights as of March 2023
- INR 4,20,880 crore Assets under management.
- More than 1,00,000 Full-time Employees, out of which 33,697 are Women Employees.
- 1,780 Bank branches, including overseas.
- Kotak Mahindra Bank also has an international banking unit in Gujarat International Finance Tec-City (GIFT City), a bank branch in the Dubai International Financial Centre (DIFC).
Furthermore, the bank boasts a diverse range of financial services through its several subsidiaries,
- Kotak Mahindra Prime – Provides financing against securities, real estate loans and corporate structured finance solutions.
- Kotak Mahindra Investment Company – Specialises in broking services through Kotak Securities.
- Kotak Mahindra Mutual Fund – Manages a variety of mutual fund schemes to suit various investment goals.
- Kotak Mahindra General Insurance – It is a wholly-owned subsidiary specialising in non-life insurance products like car, health, and home insurance.
- Kotak Mahindra Life Insurance Company Limited – With a major focus on customer experience throughout their journey, this part of the Kotak Group offers a complete range of life insurance solutions across various life stage needs of customers through its multi-channel distribution network, including digital channels.
Read Also: Yes Bank Case Study: Business Model, Financial Statement, SWOT Analysis
Financial Statement Analysis of Kotak Mahindra Bank
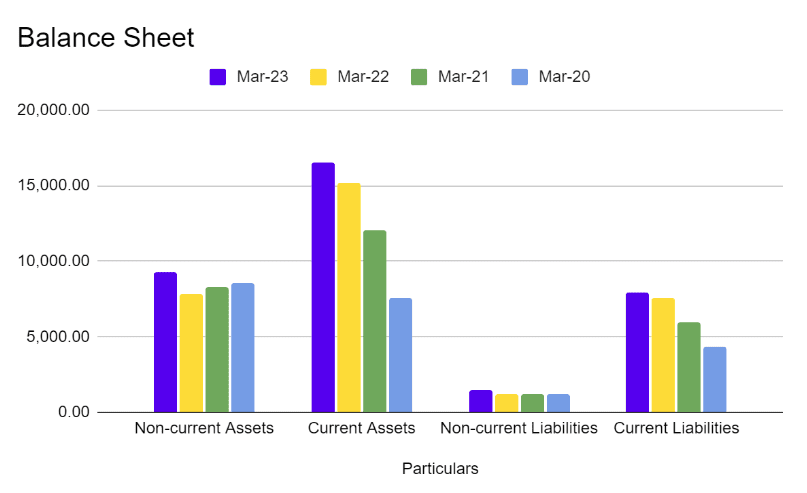
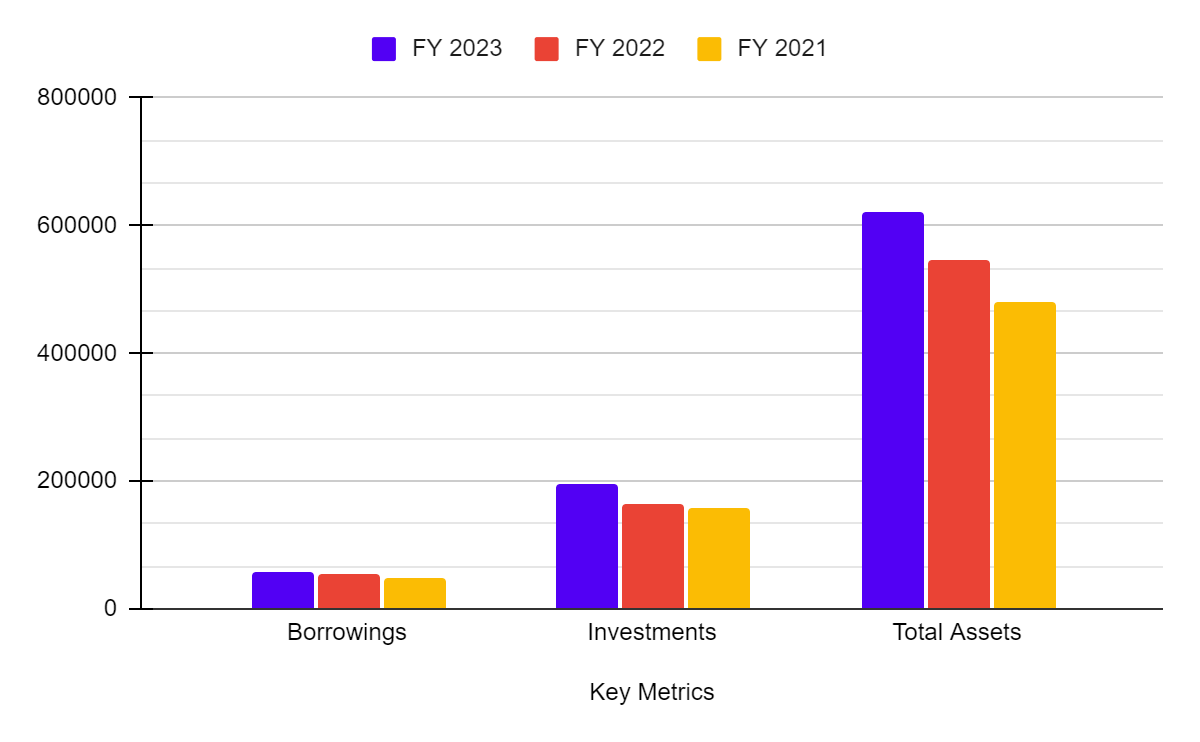
Balance Sheet (INR Crore)
| Key Metrics | FY 2023 | FY 2022 | FY 2021 |
|---|---|---|---|
| Borrowings | 57,034 | 55,160 | 47,739 |
| Investments | 195,338 | 164,529 | 156,946 |
| Total Assets | 620,430 | 546,498 | 478,854 |
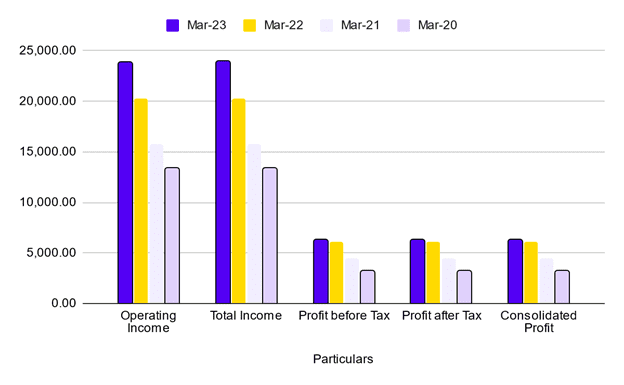
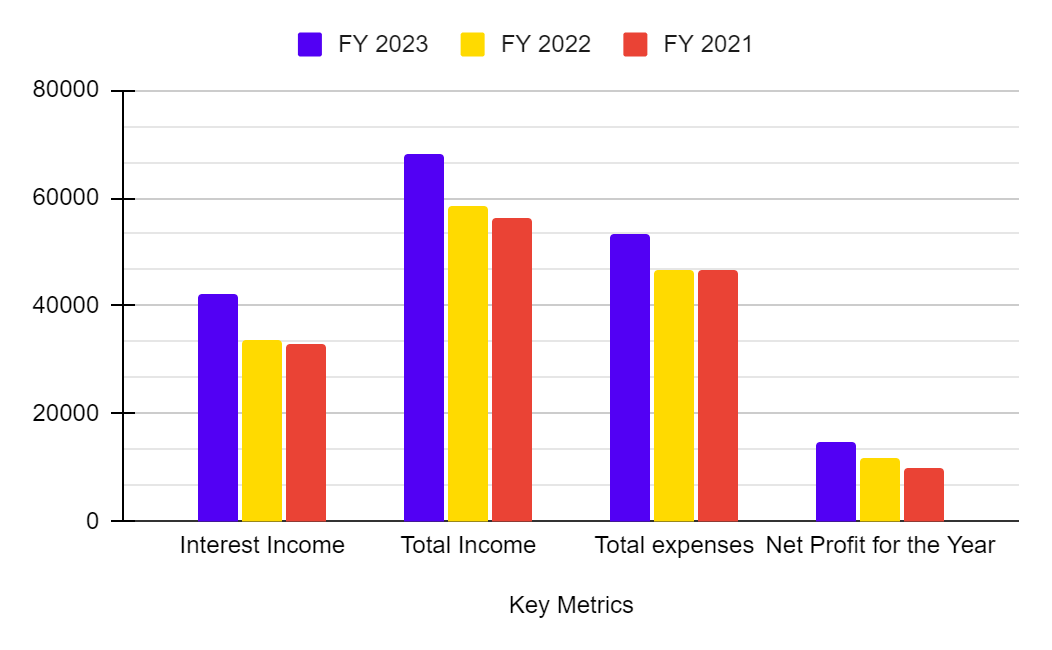
Income Statement (INR Crore)
| Key Metrics | FY 2023 | FY 2022 | FY 2021 |
|---|---|---|---|
| Key Metrics | FY 2023 | FY 2022 | FY 2021 |
| Interest Income | 42,151 | 33,741 | 32,820 |
| Total Income | 68,142 | 58,682 | 56,408 |
| Total expenses | 53,362 | 46,750 | 46,505 |
| Net Profit for the Year | 14,780 | 11,932 | 9,903 |
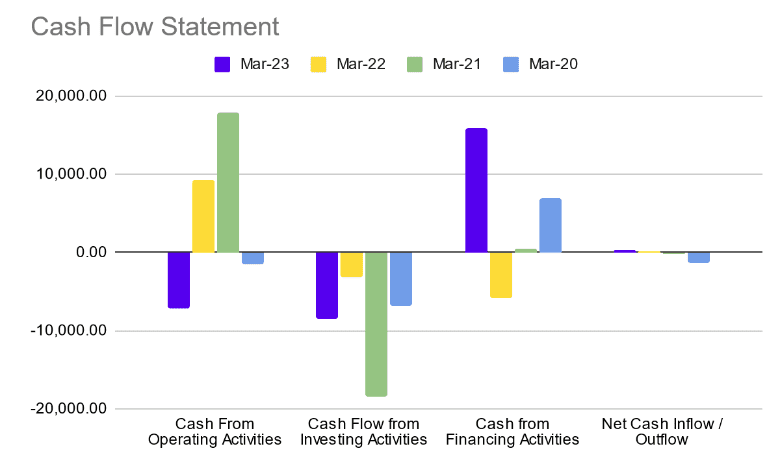
Cash Flow Statements (INR Crore)
| Cash Flows | FY 2023 | FY 2022 | FY 2021 |
|---|---|---|---|
| Net cash flow from operating activities | -1,242 | 8,308 | 4,881 |
| Net cash flow (used in) investing activities | -10,550 | -10,969 | -11,116 |
| Net cash flow from / (used in) financing activities | 1,883 | 7,543 | -10,072 |
| Cash and cash equivalents at the end of the year | 42,925 | 52,665 | 47,717 |
Ratio Analysis
| Key Ratios (in %) | FY 2023 | FY 2022 | FY 2021 |
|---|---|---|---|
| Key Ratios (in %) | FY 2023 | FY 2022 | FY 2021 |
| Net Interest Margin | 4.47 | 4.05 | 4.14 |
| Net Profit Margin | 35.06 | 35.36 | 30.17 |
| ROCE | 3.41 | 3.45 | 3.62 |
| Return on Equity | 13.34 | 12.5 | 11.84 |
| CASA | 52.77 | 60.62 | 56.35 |
| Net NPA | 0.4 | 0.6 | 1.2 |
Inferences from the above numbers:
- With a net profit of INR 14,780 crore for FY23—a 23.5% rise over FY22, recent figures show a favourable trend.
- The presence of non-performing assets (NPAs) is a key sign of a bank’s capacity to collect debts. The net NPA ratio of the bank of 0.4 in FY 2023 as compared to 0.6 suggests improvement in quality of loans.
- A decent increase in Net Interest Margin demonstrates the bank’s effective investment management.
- According to reports, Kotak Mahindra Bank’s CASA ratio is approximately 52.83%. This shows that current and savings accounts, which are seen as inexpensive sources of funding, account for more than half of the bank’s deposits.
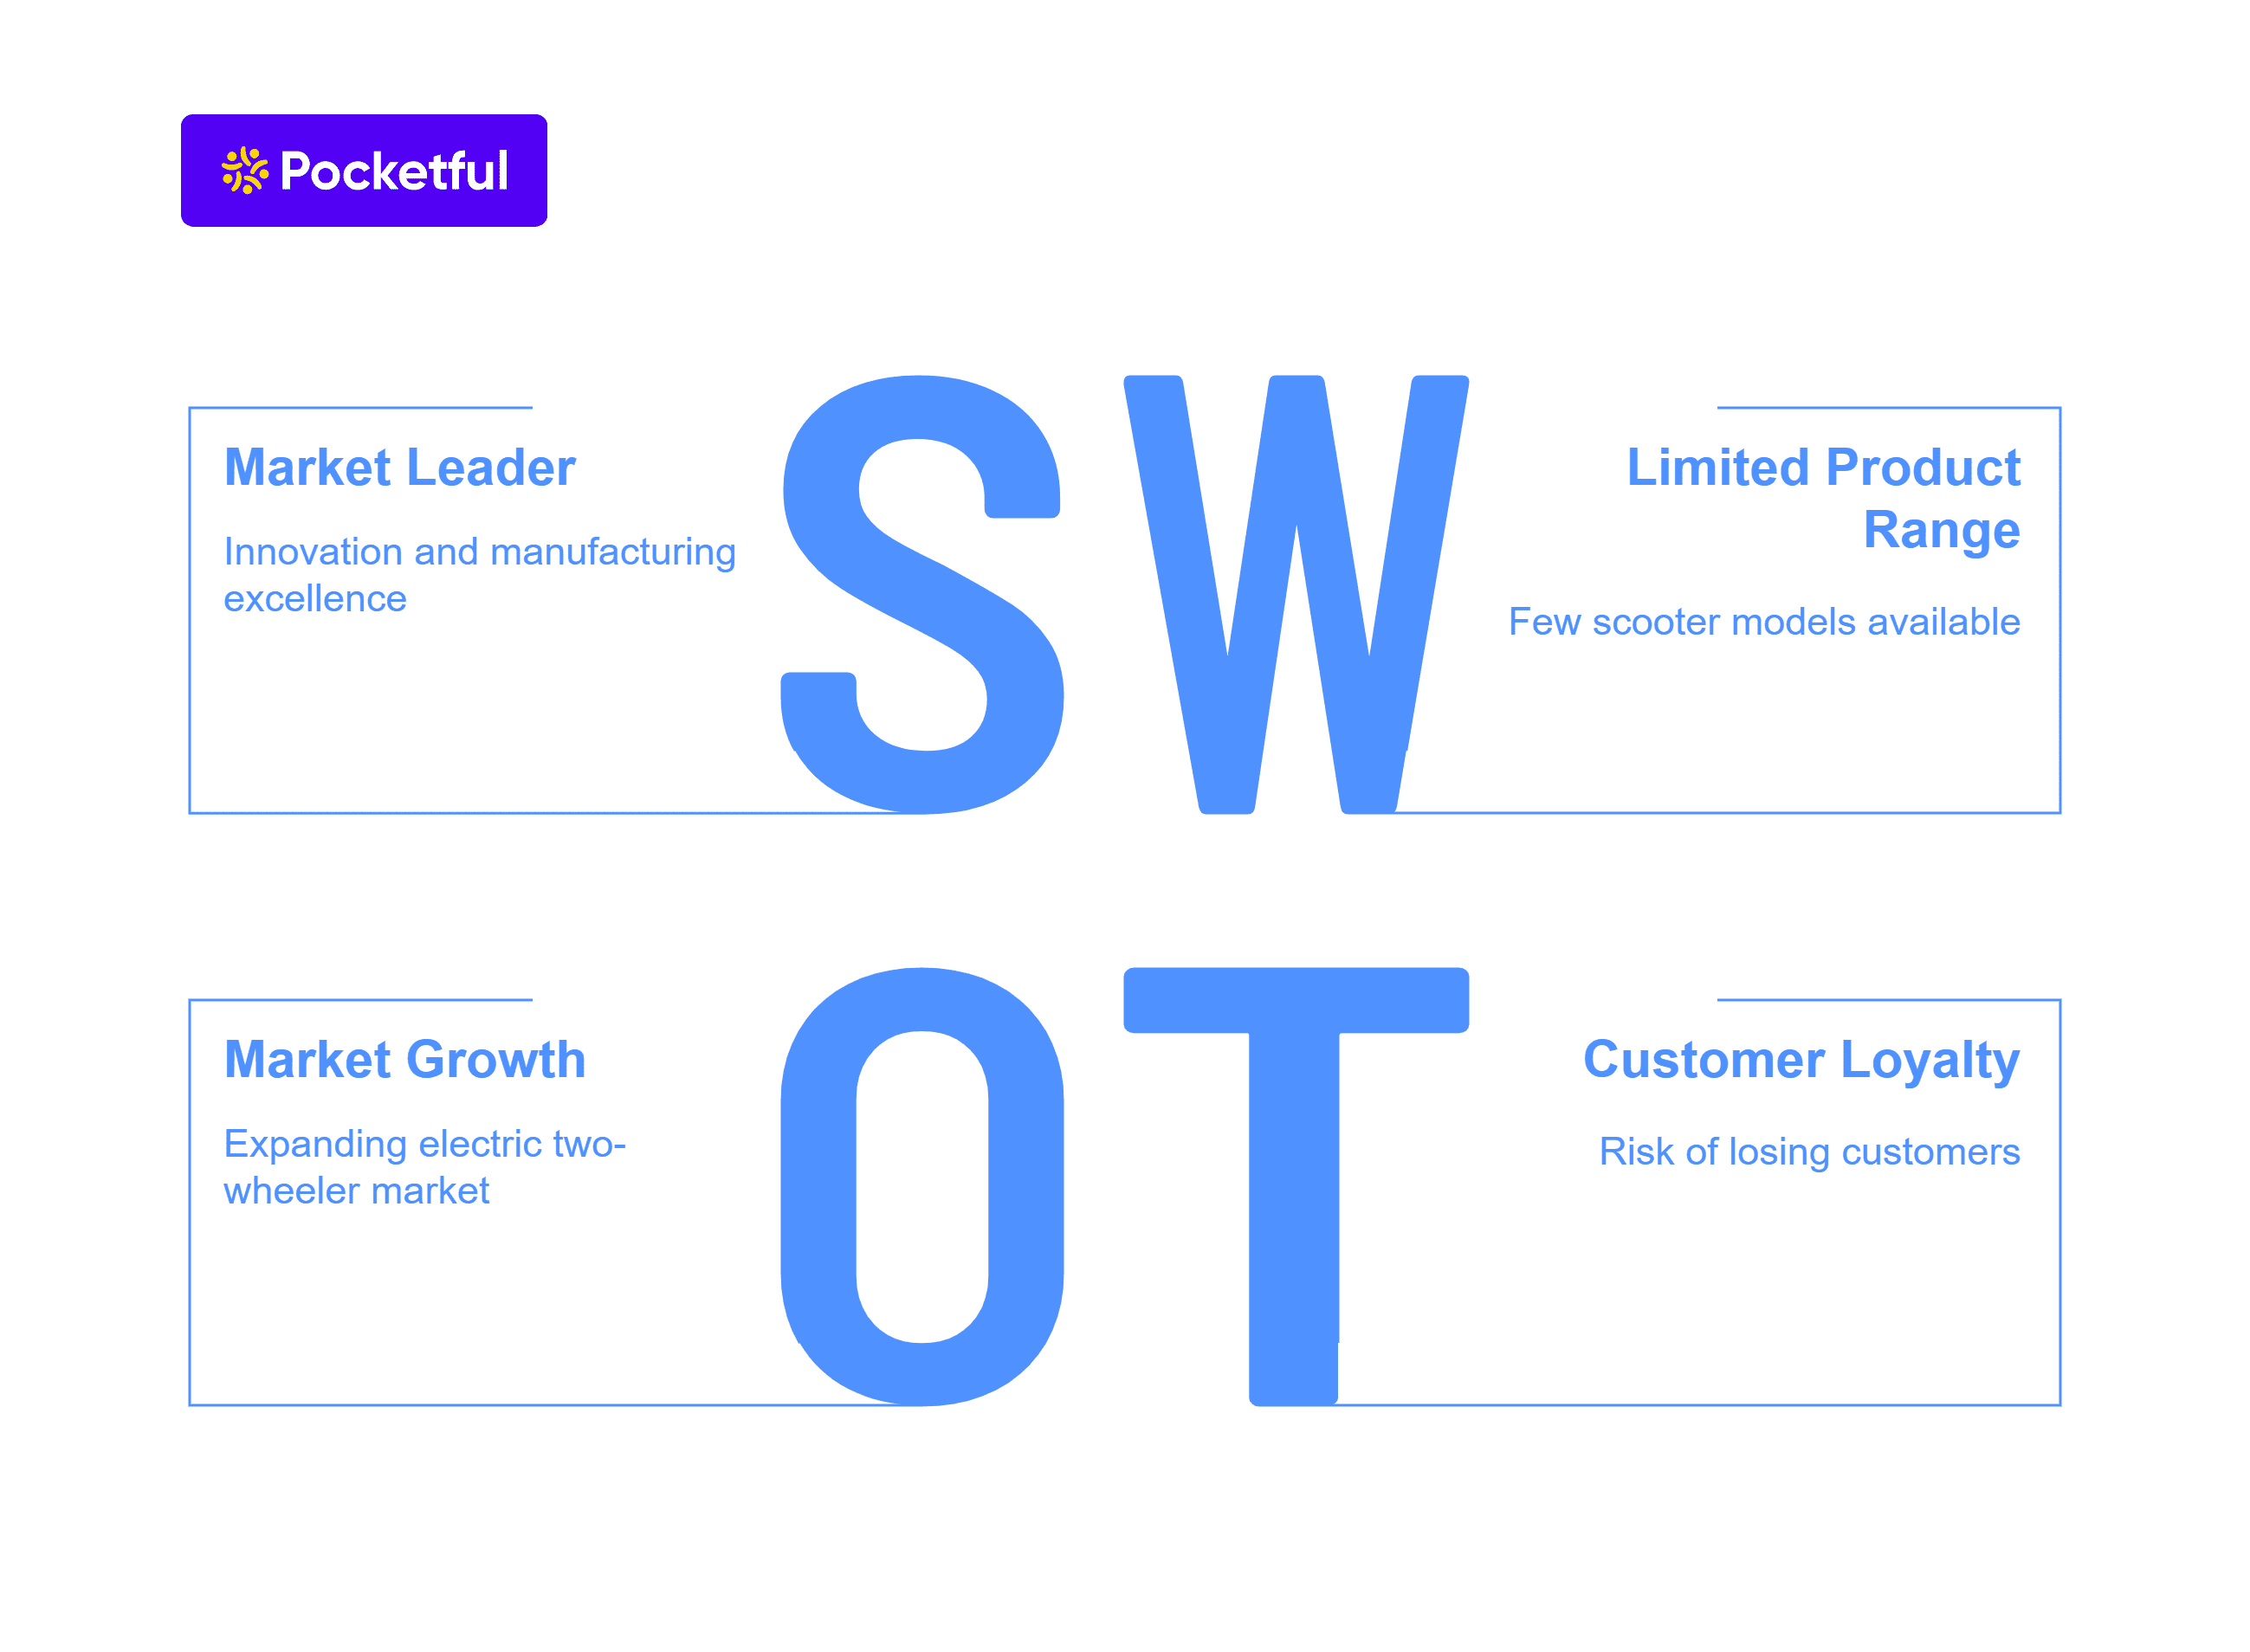
SWOT Analysis of Kotak Mahindra Bank
The Kotak Mahindra Bank SWOT Analysis highlights its strengths, weaknesses, opportunities, and threats, showcasing its market position and growth potential.

Strengths
- Kotak Mahindra Bank offers a one-stop shop for all your financial needs in India, from banking and insurance to investments and wealth management.
- The expertise of the company lies in evaluating opportunities, ensuring and making clear choices that prioritize returns aligned with the level of risk involved.
- A seasoned management team with a commitment to ethical practices, fostering a culture of trust and responsible growth is the key strength of the company.
- Known for its dependability and customer-first philosophy, Kotak Mahindra Bank has established a strong brand name over the years.
Weakness
- The bank’s operations are primarily concentrated in India, making it vulnerable to fluctuations in the Indian economy and regulations.
- Compared to its public sector competitors, Kotak Mahindra spends less on marketing and advertising. This can hinder brand awareness and customer acquisition, especially in new markets.
- Despite being dominant in the retail banking space, Kotak Mahindra is lesser known in the potentially profitable corporate banking space.
Opportunities
- The increasing popularity of online banking services offers the bank a chance to expand and make better use of its online platform (Kotak 811), which will allow it to connect with more people.
- Strategic acquisitions can help the company to expand its product portfolio, enter new markets, or strengthen its presence in corporate banking.
- Changes in regulations, such as liberalization of banking norms or relaxation of foreign investment restrictions, could present opportunities for the bank to explore new business avenues.
Threats
- An increase in non-performing assets presents a major risk to the company’s financial health, as it would need to allocate more resources towards bad debts, eventually eroding profit.
- The company’s ability to meet capital requirements may be jeopardized in the event of a large borrower default or a decline in the performance of any of the industry sectors to which it is significantly exposed.
- The ever-evolving landscape of cybercrime exposes the bank to a multitude of threats, such as hacking and phishing scams.
Read Also: Zaggle Case Study: Business Model, Financials, and SWOT Analysis
Conclusion
Kotak Mahindra Bank is a well-established player in the Indian banking sector, boasting strong brand recognition, experienced leadership, and a commitment to ethical practices.
However, the bank needs to address certain areas to maintain its competitive edge. Leveraging digitalisation via Kotak 811 and offering wealth management services to a growing affluent segment are all strategic avenues to pursue.
Frequently Asked Questions (FAQs)
Does Kotak Mahindra Bank offer digital banking services?
Yes, they offer a user-friendly banking platform known as Kotak 811 for convenient access to financial services.
What is the market capitalisation of the Kotak Mahindra Bank?
The market capitalisation of the bank as of April 2023 stands at app. 3,54,939 Crore.
When was Kotak Mahindra Bank listed on the stock exchange?
The bank was listed on the stock exchange in 1992 with the Holding entity Kotak Mahindra Finance Limited.
How many branches does the bank have?
As of March 2023, the bank operates a network of over 1780 branches and 2500 ATMs across India.
What are the key services offered by the Kotak Mahindra Bank?
The key services offered are personal banking, corporate banking, wealth management, insurance, and investment banking.