The Indian auto industry is a powerhouse driven by a thriving tyre sector that keeps its wheels turning. The Indian tyre industry showcases a diverse range of companies, each with its unique strengths and specialities.
In today’s blog, we will compare MRF and Apollo Tyres.
MRF Overview
MRF is an Indian multinational tyre manufacturing company with its headquarters in Chennai, Tamil Nadu. Founded in 1946 by K.M. Mammen Mappillai, it started as a toy balloon manufacturing unit and has grown into a tyre giant. The company manufactures a wide range of products, including tyres for two-wheelers, cars, trucks, and even airplanes. It also manufactures tyres, treads, tubes, conveyor belts, paints, and toys.
MRF is the largest tyre manufacturer in India and ranks among the top 20 globally. They are well-recognized for their high-quality tyres and extensive reach across the country.
It was incorporated as a private company, Madras Rubber Factory Limited, and began tyre production in partnership with an American company, Mansfield Tire & Rubber Factory.
MRF has a wide distribution network in India, serving retail stores, dealerships, and car manufacturers. The company sells tyres directly to manufacturers (B2B) for factory use and also has a strong presence in the replacement tyre market for individual consumers (B2C).
They achieve this reach through an extensive network of franchised stores and dealers. The company focuses on offering excellent customer service through initiatives like roadside assistance programs and informative resources on its website.
Apollo Tyres Overview
Apollo Tyres Limited is an Indian multinational tyre manufacturing company headquartered in Gurgaon, Haryana. The company was established in 1972 by Onkar Kanwar, and since then, it has grown from a domestic Indian company to a global tyre manufacturer with a presence in over 100 countries. Apollo caters to a wide range of segments, including passenger vehicles, two-wheelers, trucks, buses, and light trucks.
In the 1990s, Apollo Tyres expanded globally with an ambitious strategy. The company acquired manufacturing facilities in the Netherlands in 2009 to better serve the European market.
The company employs a multifaceted business model, successfully integrating manufacturing, branding, and a customer-centric approach. This strategic blend enables the company to effectively compete in the highly competitive global tyre market.
Company’s Comparative Study
| Particular | MRF | Apollo Tyres |
|---|---|---|
| Current Share Price | INR 1,38,616 | INR 504 |
| Market Capitalization (in INR Crores) | 58,773 | 32,025 |
| 52 Week High Price | INR 1,51,445 | INR 568 |
| 52-Week Low Price | INR 1,06,391 | INR 365 |
| FIIs Holdings (%) | 19.08 | 14.46 |
| DIIs Holdings (%) | 10.74 | 26.69 |
| Book Value per Share | INR 39,384 | INR 219 |
| PE Ratio (x) | 28.5 | 18.8 |
Read Also: Apollo Hospitals Case Study : Business Model, Financial Statements, And SWOT Analysis
Financial Statements Comparison
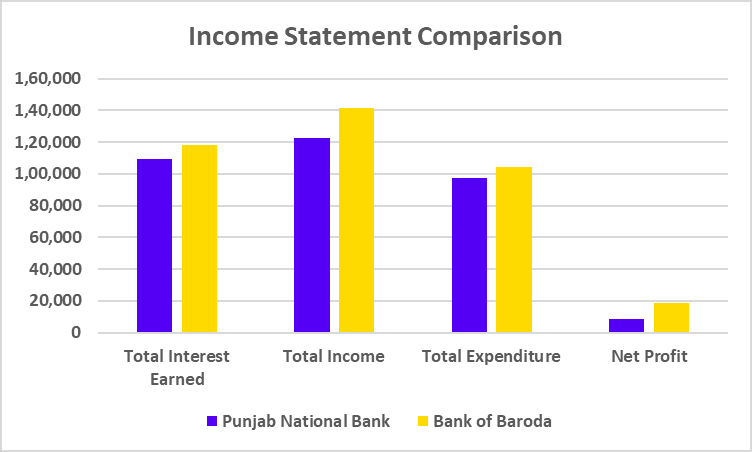
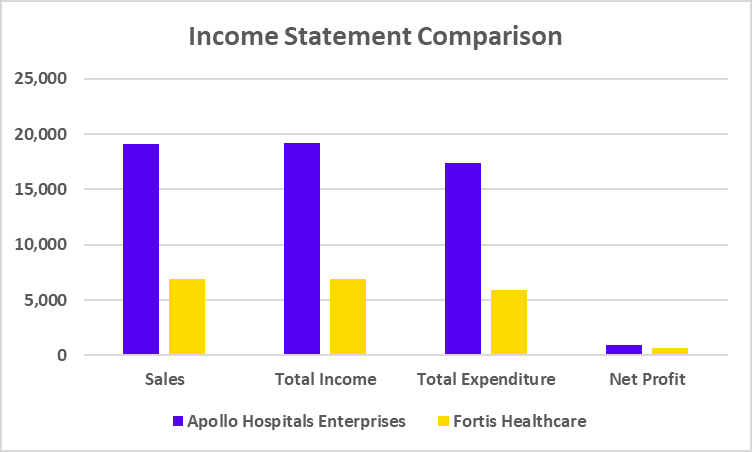
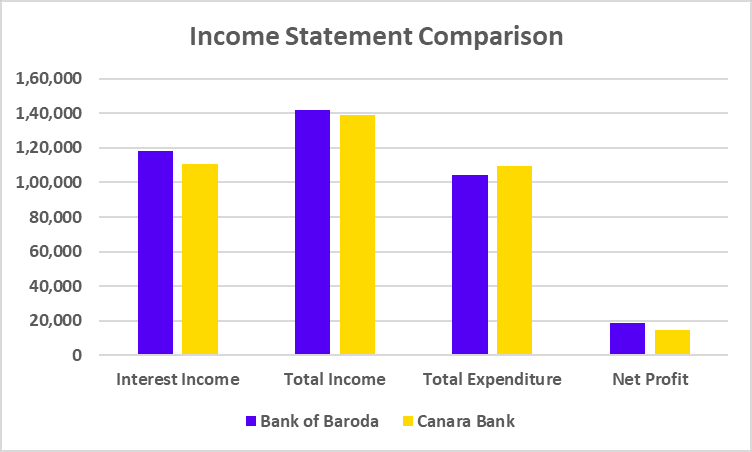
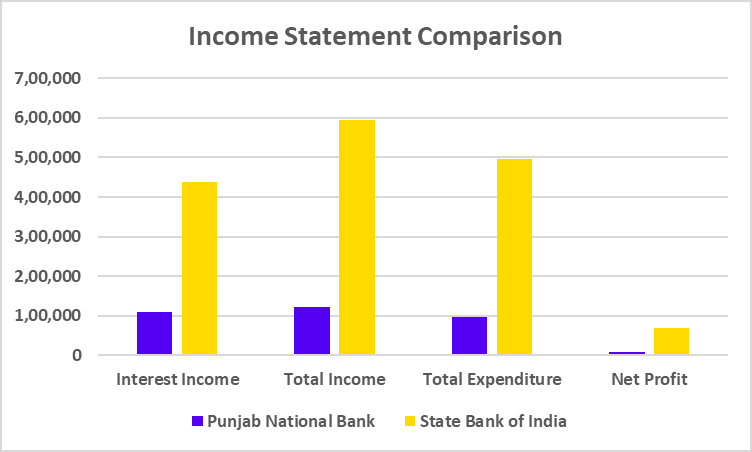
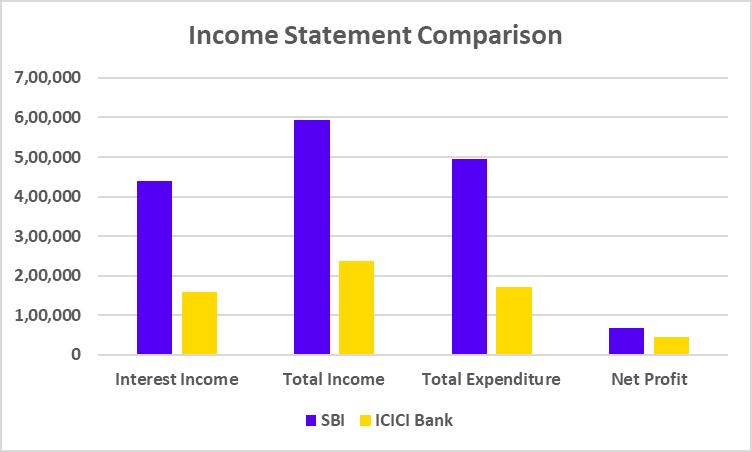
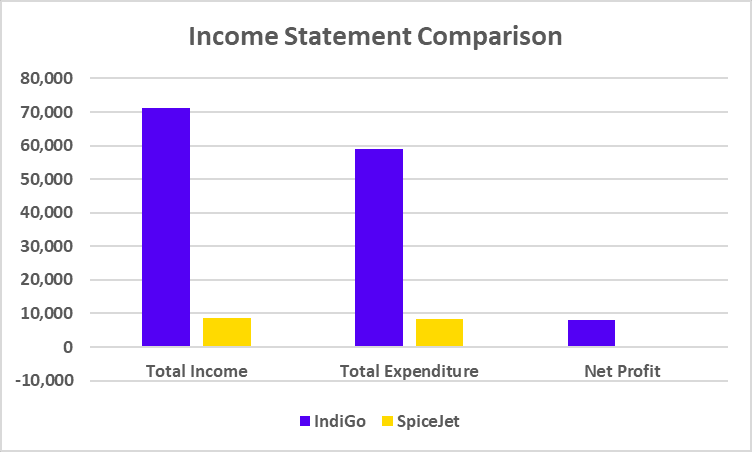
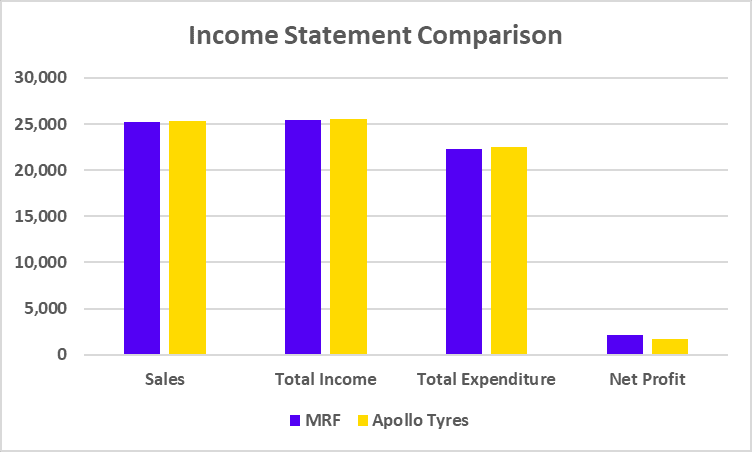
Income Statement Comparison (FY 2024)
| Particular | MRF | Apollo Tyres |
|---|---|---|
| Sales | 25,169 | 25,377 |
| Total Income | 25,486 | 25,531 |
| Total Expenditure | 22,345 | 22,485 |
| Net Profit | 2,081 | 1,721 |
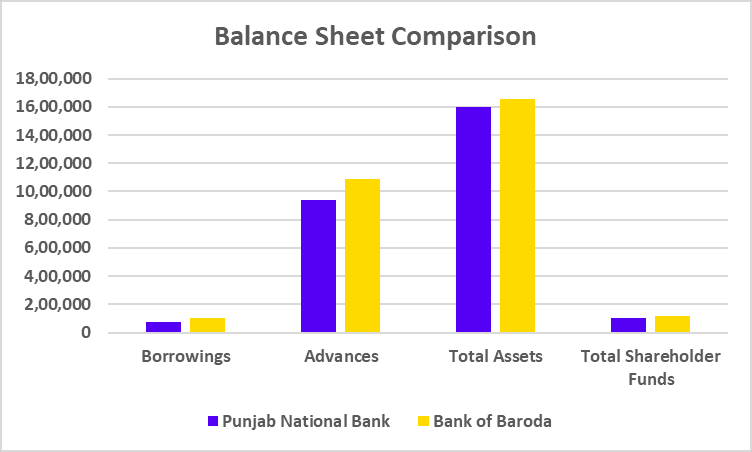
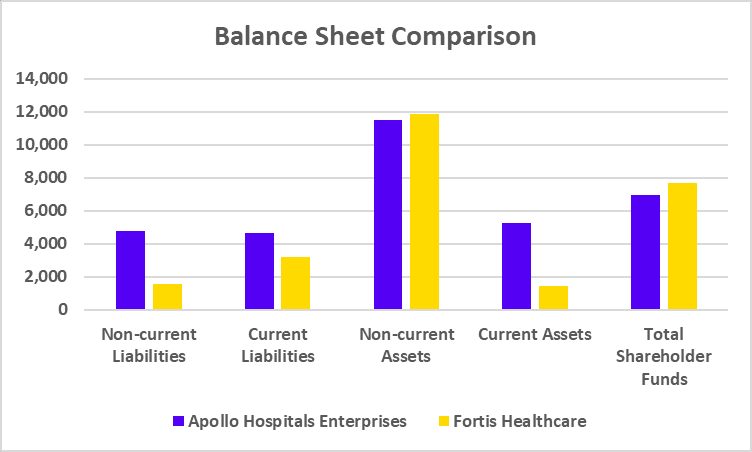
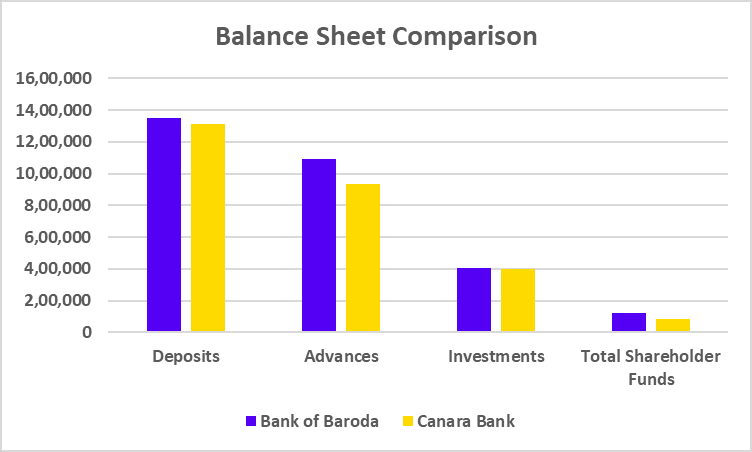
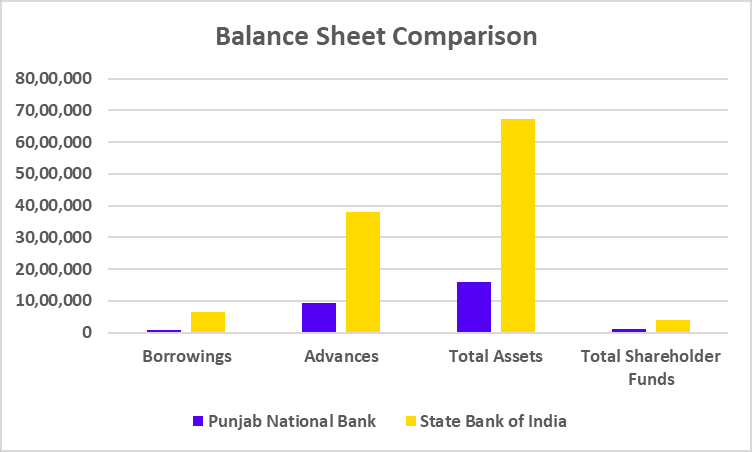
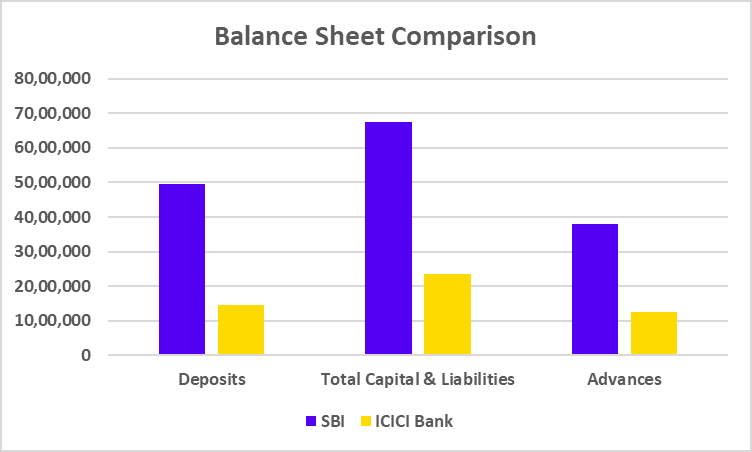
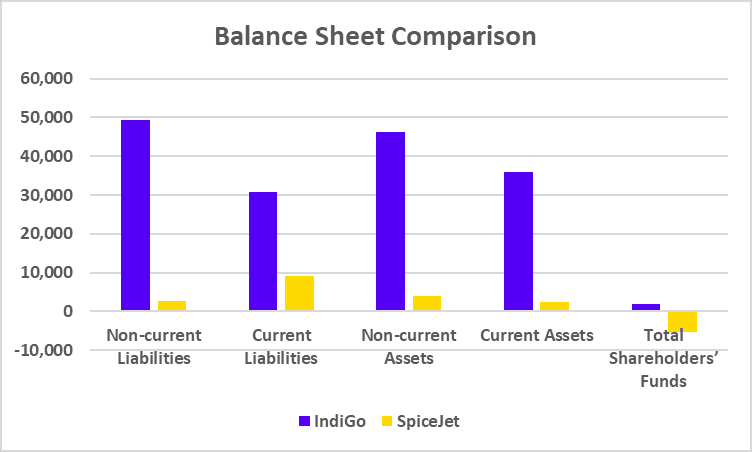
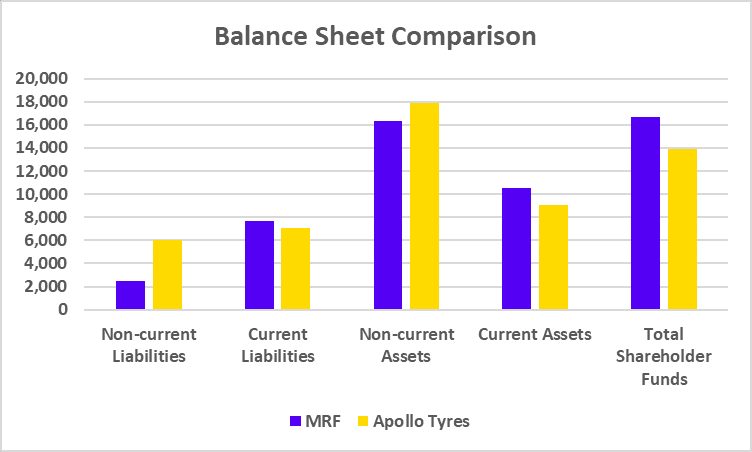
Balance Sheet Comparison (FY 2024)
| Particular | MRF | Apollo Tyres |
|---|---|---|
| Non-current Liabilities | 2,436 | 6,011 |
| Current Liabilities | 7,710 | 7,043 |
| Non-current Assets | 16,300 | 17,930 |
| Current Assets | 10,550 | 9,028 |
| Total Shareholder Funds | 16,703 | 13,902 |
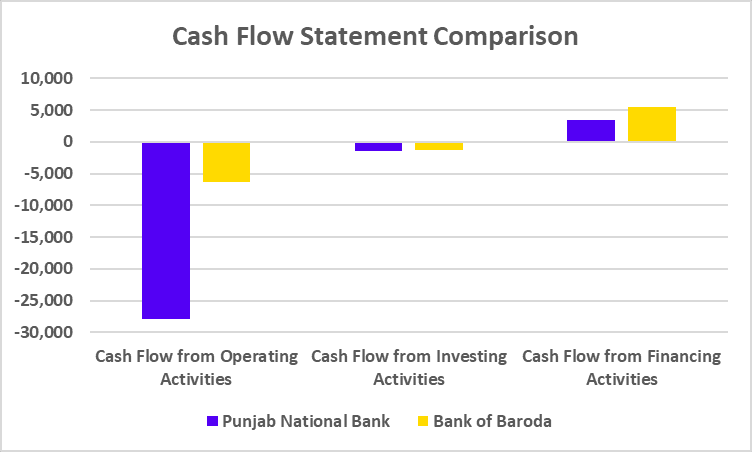
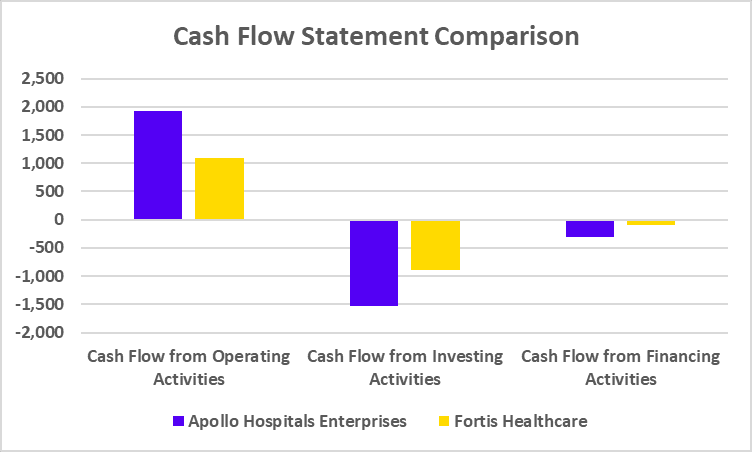
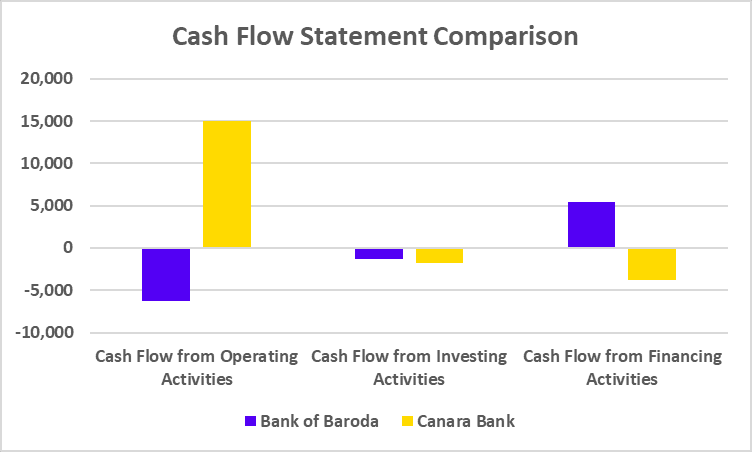
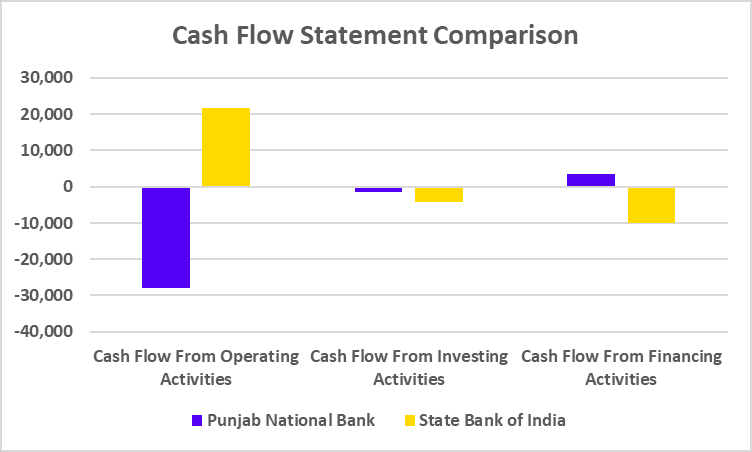
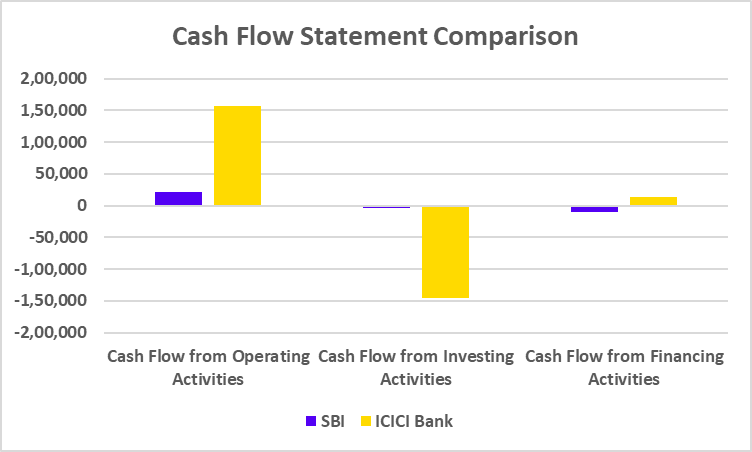
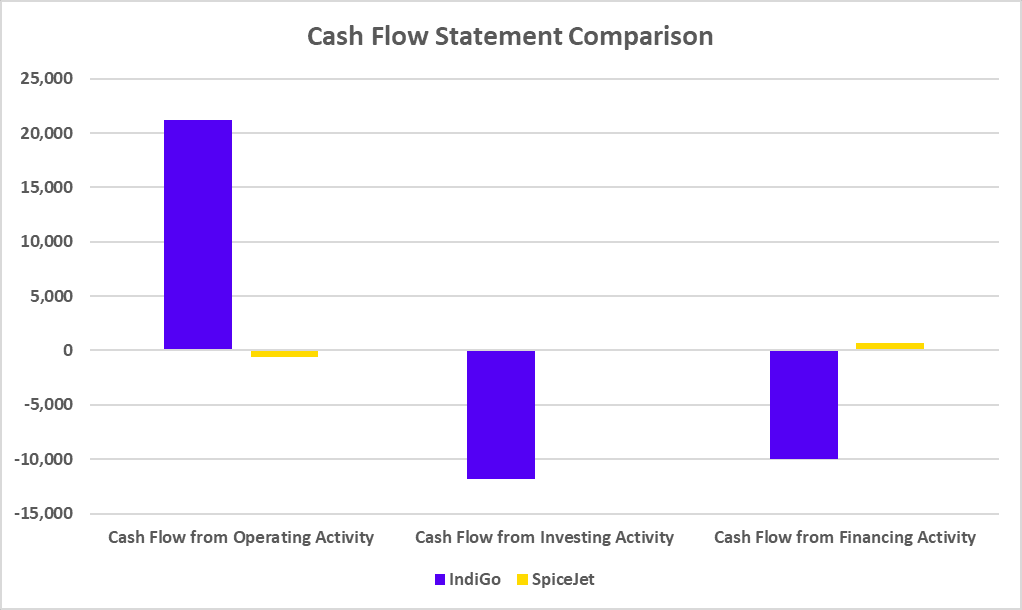
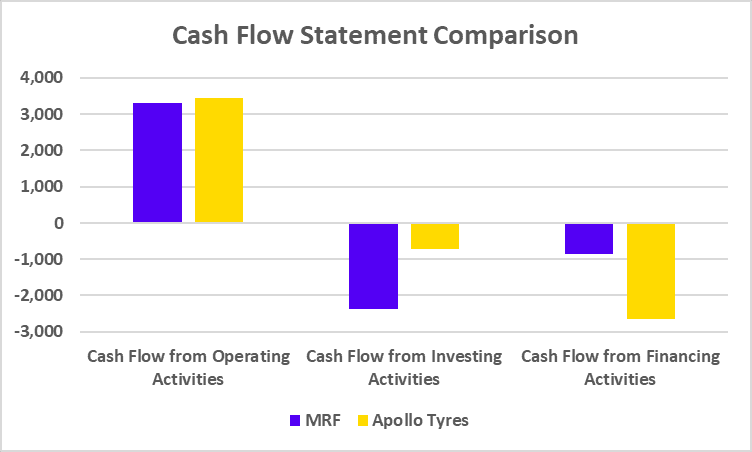
Cash Flow Statement Comparison (FY 2024)
| Particular | MRF | Apollo Tyres |
|---|---|---|
| Cash Flow from Operating Activities | 3,300 | 3,439 |
| Cash Flow from Investing Activities | -2,379 | -710 |
| Cash Flow from Financing Activities | -868 | -2,659 |
Key Performance Indicators
| Particular | MRF | Apollo Tyres |
|---|---|---|
| Net Profit Margin (%) | 8.26 | 6.78 |
| ROE (%) | 12.46 | 12.38 |
| ROCE (%) | 16.40 | 15.68 |
| Current Ratio | 1.37 | 1.28 |
| Debt to Equity Ratio | 0.12 | 0.28 |
Conclusion
The comparison between MRF and Apollo Tyres presented above leads us to conclude that while both MRF and Apollo Tyres have comparable sales, MRF posts higher net profit margins. Moreover, MRF has a slightly higher ROE and ROCE metric as compared to the metrics of Apollo Tyres. However, it is advised to speak with an investment expert before making investment decisions.
| S.NO. | Check Out These Interesting Posts You Might Enjoy! |
|---|---|
| 1 | Apollo Hospitals vs Fortis Healthcare: |
| 2 | Flair Vs DOMS |
| 3 | Mahindra & Mahindra vs Tata Motors |
| 4 | Tata Power Vs Adani Power |
| 5 | Tata Steel vs. JSW Steel |
Frequently Asked Questions (FAQs)
Who is the founder of MRF?
K.M. Mammen Mappillai established MRF in 1946.
What is the full form of MRF?
MRF stands for Madras Rubber Factory.
Who is the managing director of Apollo Tyres?
Neeraj Kanwar is the Managing Director of Apollo Tyres.
Which company is more profitable: MRF or Apollo Tyres?
MRF has a net profit of INR 2,081 crores compared to INR 1,721 crores for Apollo Tyres for FY 2024.
Which company has a larger market capitalization: MRF or Apollo Tyres?
MRF has a larger market capitalization than Apollo Tyres as of 27 August 2024.