India is one of the world’s fastest-growing economies and is facing substantial challenges in managing its energy requirements. With a population of over 140 crore, the Government of India is making all the necessary efforts to meet the country’s rising energy needs. Two government-owned businesses, NHPC and NTPC, are responsible for energy production in India.
In today’s blog post, we’ll compare NTPC and NHPC.
NHPC Overview
The NHPC was established in 1975 by the Government of India as a division of the Ministry of Power. The company’s primary goal is to increase the nation’s hydropower output. The company has operations in Jammu & Kashmir, Uttarakhand, Arunachal Pradesh, Sikkim, etc. The corporation uses wind energy and solar energy, among other sources, to generate electricity.
In 2008, the company went public on the Indian Stock Exchange. With a hydro share of 6971.20 MW as of March 2024, the corporation has a total capacity of 7144.20 MW or 14.85% of the nation’s hydro capacity. The organization is always concentrating on using renewable energy sources to generate electricity. It also develops several infrastructure types, including tunnels, dams, and powerhouses. The company’s main office is located in Faridabad.
NTPC Overview
In response to the country’s growing need for power, the Indian government established the firm in 1975 as a public-sector corporation. The company used coal to produce electricity and is now focusing on utilizing renewable energy sources. Due to its substantial contribution to the nation’s electricity consumption, the business became India’s largest power utility in 1990. The company launched an initial public offering (IPO) in 2004 and became listed on the Indian Stock Exchange.
The corporation is diversifying its sources of electricity generation, including nuclear, solar, wind, and hydroelectric power. The firm has 94 facilities with a combined capacity of 76,134 MW, of which 52 are owned and run by NTPC, and 43 are in joint ventures or subsidiaries. The company plans to achieve a 130 GW capacity by 2032. The business produced 400 billion units of power in 2023–2024. The organization’s headquarters is in New Delhi.
Comparative Company Study
| Particular | NHPC | NTPC |
|---|---|---|
| Current Share Price | INR 95 | INR 413 |
| Market Capitalization (In INR Crores) | 95,378 | 4,00,084 |
| 52-Week High Price | INR 118 | INR 426 |
| 52-Week Low Price | INR 48.4 | INR 216 |
| FIIs Holdings (%) | 8.96 | 17.68 |
| DIIs Holdings (%) | 11.55 | 27.66 |
| Book Value Per Share | INR 38.5 | INR 166 |
| PE Ratio (x) | 26.4 | 18.7 |
Read Also: ITC vs HUL
Financial Statements Comparison
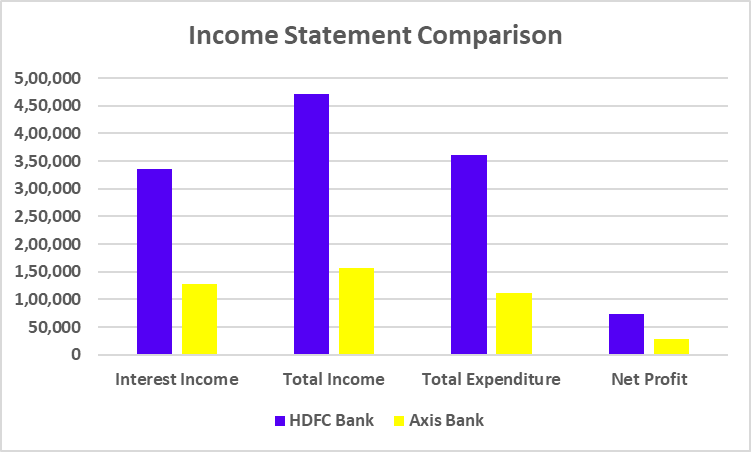
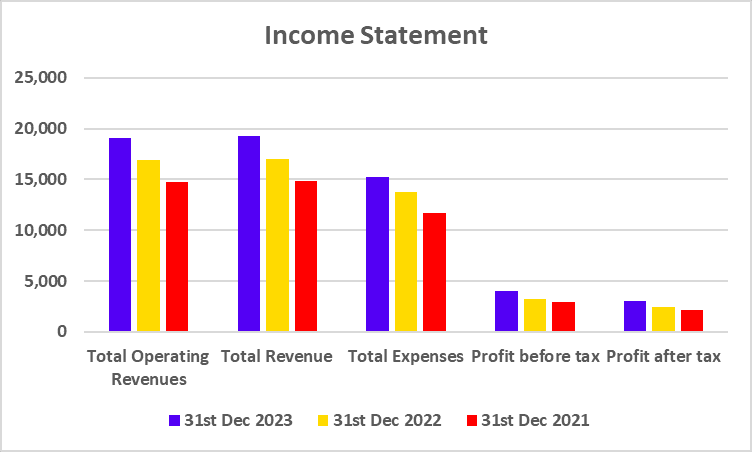
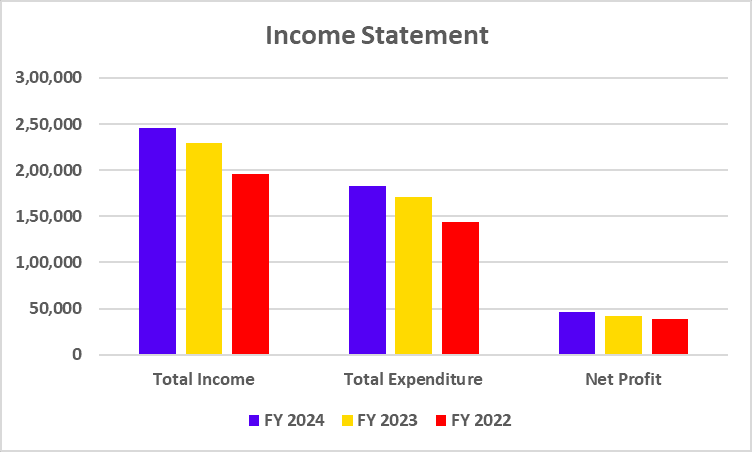
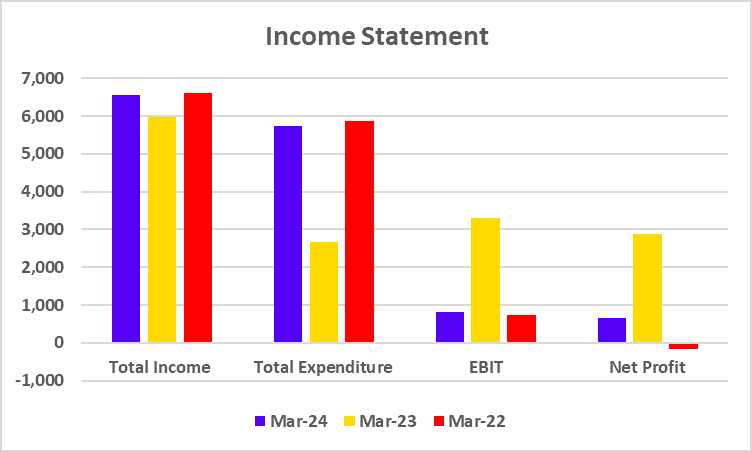
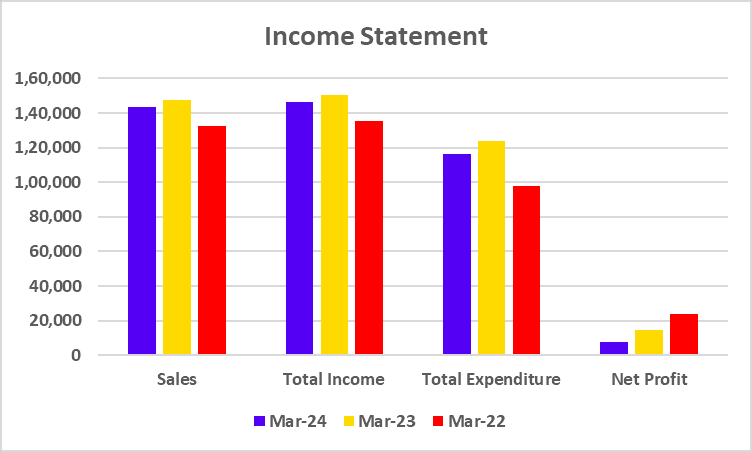
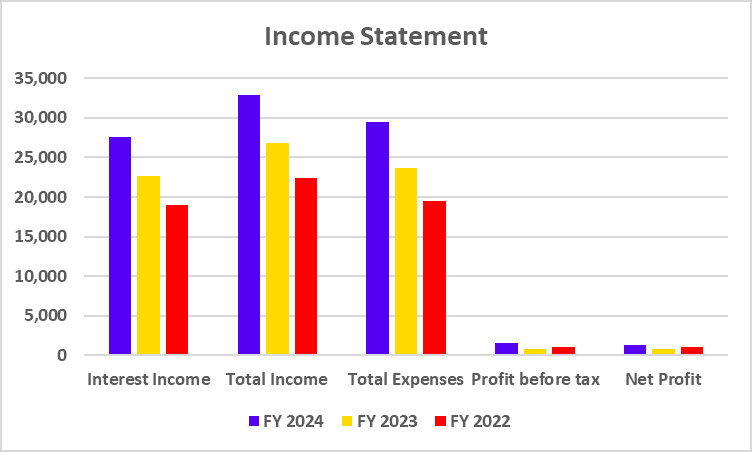
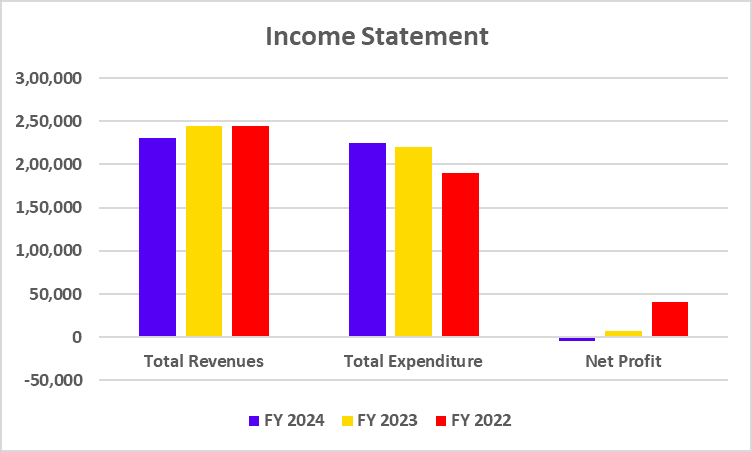
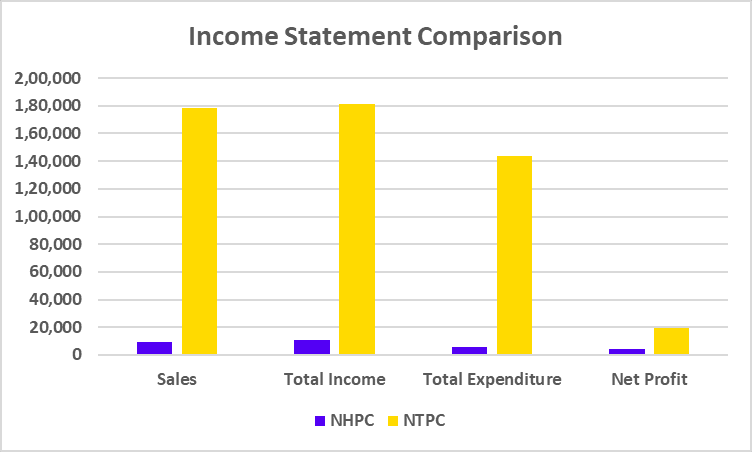
Income Statement Comparison (FY 2024)
| Particular | NHPC | NTPC |
|---|---|---|
| Sales | 9,632 | 1,78,500 |
| Total Income | 10,993 | 1,81,165 |
| Total Expenditure | 5,552 | 1,43,661 |
| Net Profit | 4,023 | 19,696 |
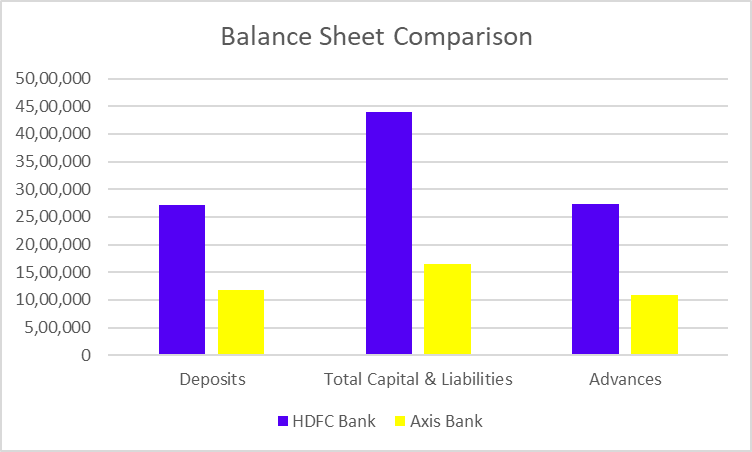
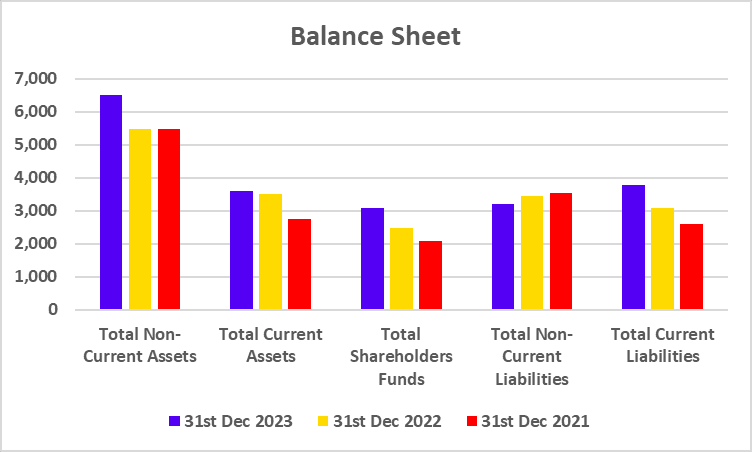
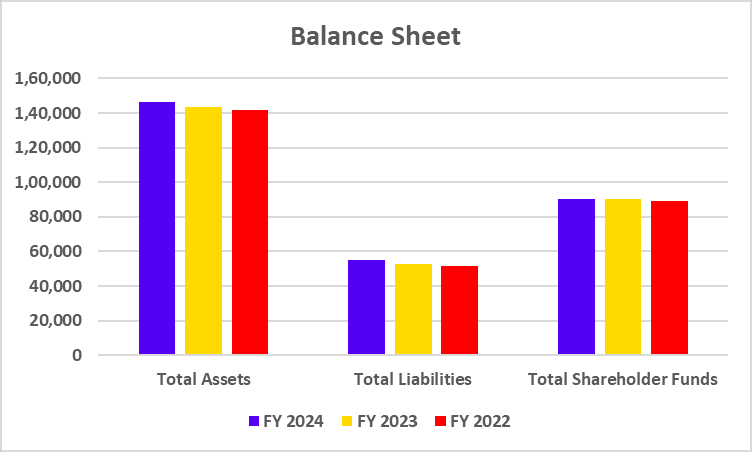
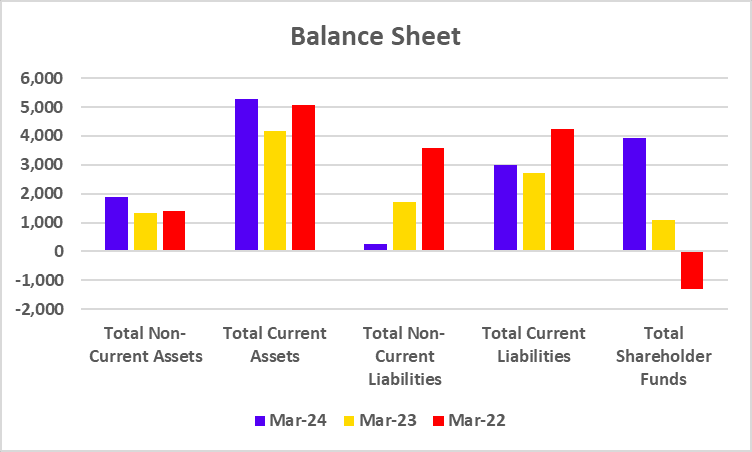
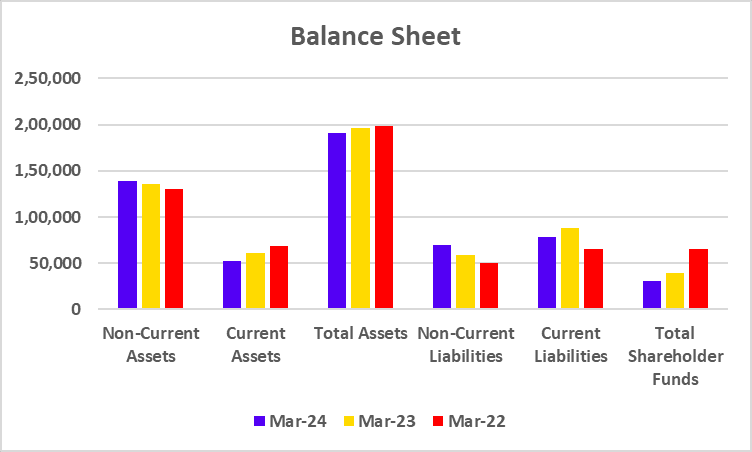
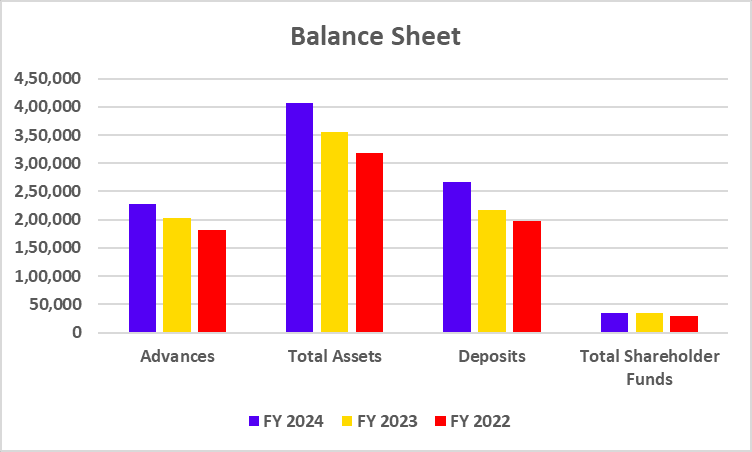
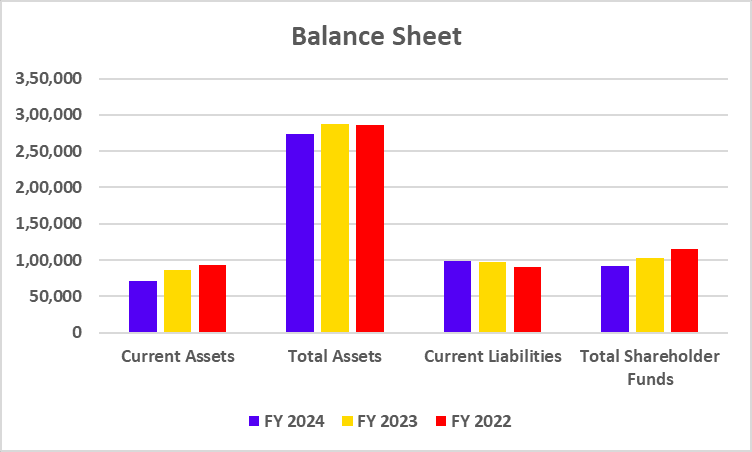
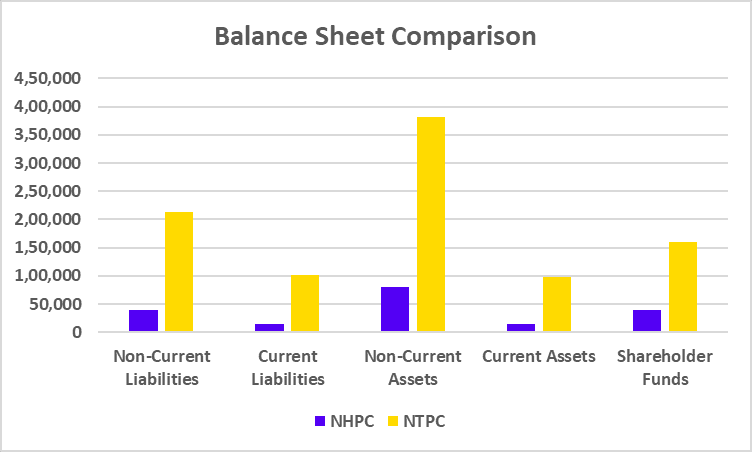
Balance Sheet Comparison (FY 2024)
| Particular | NHPC | NTPC |
|---|---|---|
| Non-Current Liabilities | 38,619 | 2,12,719 |
| Current Liabilities | 14,226 | 1,02,355 |
| Non-Current Assets | 80,108 | 3,82,187 |
| Current Assets | 14,168 | 98,009 |
| Shareholder Funds | 38,702 | 1,60,709 |
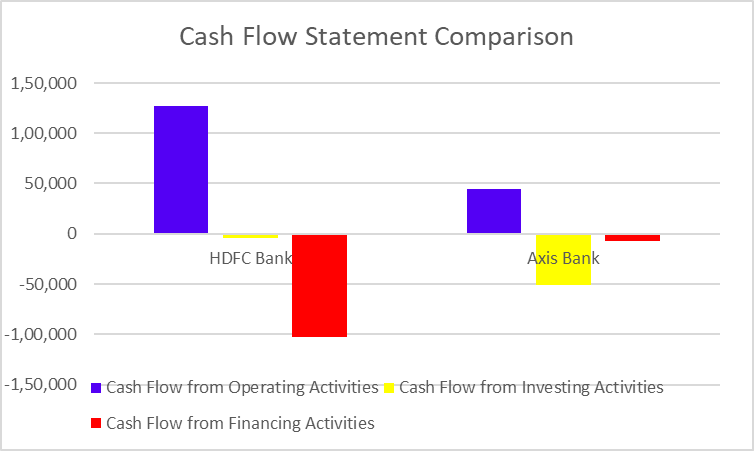
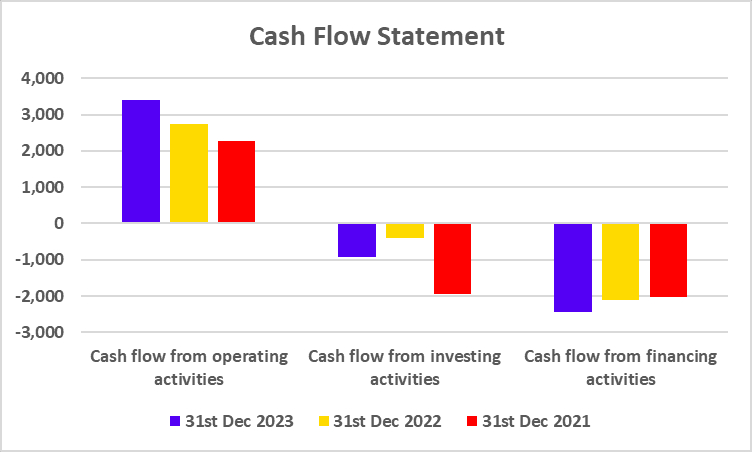
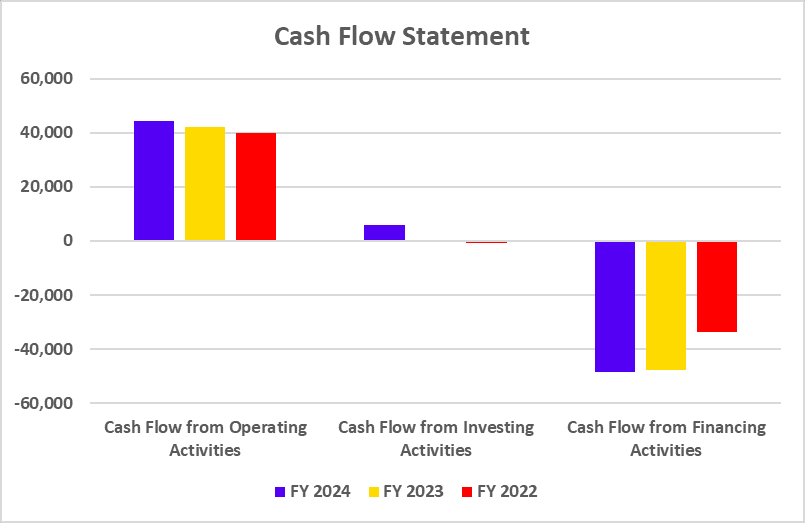
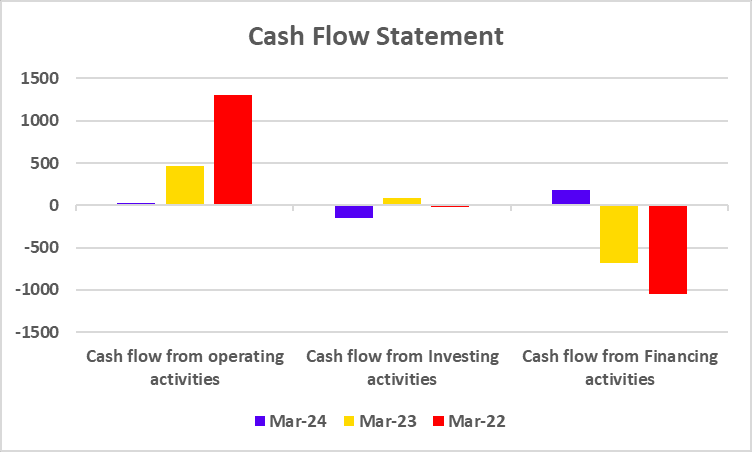
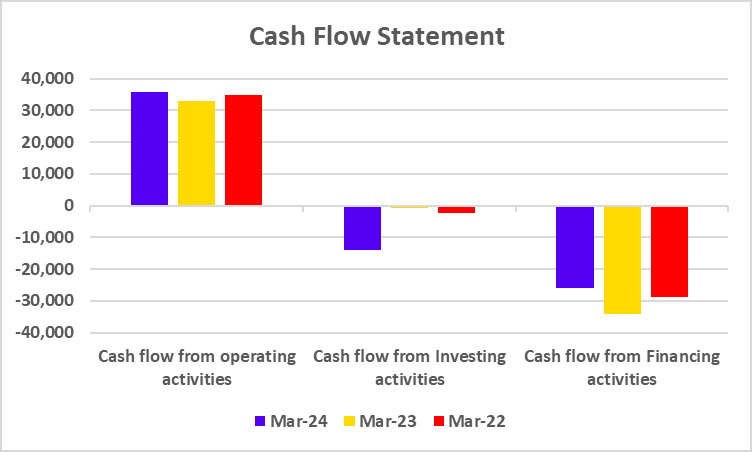
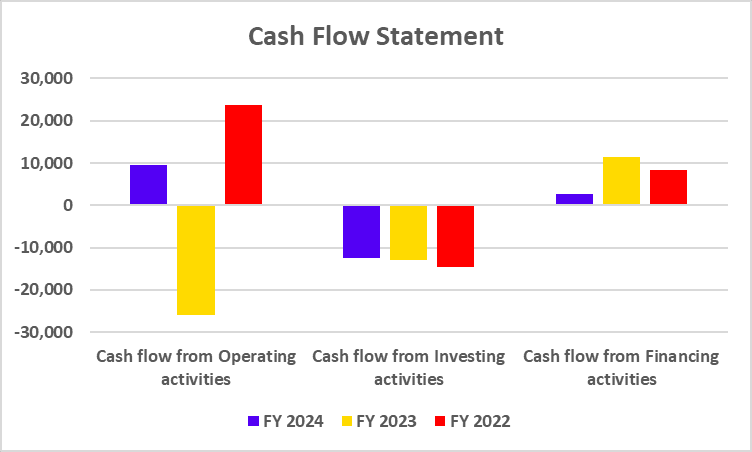
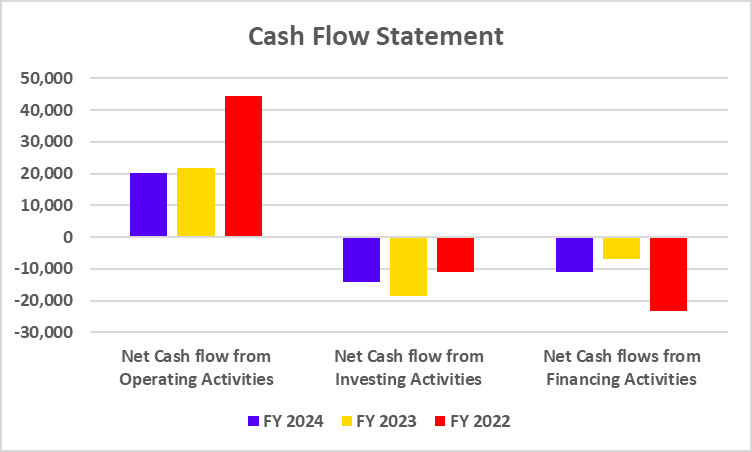
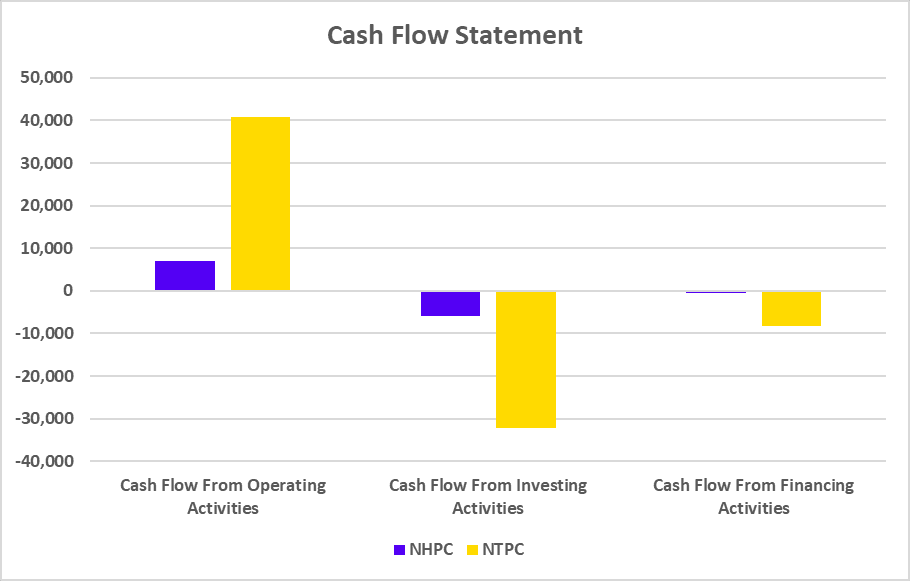
Cash Flow Statement Comparison (FY 2024)
| Particular | NHPC | NTPC |
|---|---|---|
| Cash Flow From Operating Activities | 6,937 | 40,784 |
| Cash Flow From Investing Activities | -5,968 | -32,141 |
| Cash Flow From Financing Activities | -581 | -8,245 |
Key Performance Indicators
| Particular | NHPC | NTPC |
|---|---|---|
| Net Profit Margin (%) | 41.77 | 12.64 |
| ROE (%) | 9.36 | 12.95 |
| ROCE (%) | 6.12 | 9.93 |
| Current Ratio | 1.64 | 0.96 |
| Debt to Equity Ratio | 0.84 | 1.46 |
Read Also: TCS vs Wipro
Conclusion
In conclusion, both businesses produce power, but their methods vary: NHPC primarily draws its energy from hydroelectric sources, while NTPC draws its energy from more traditional sources like coal, gas, etc. In the fiscal year ending in 2024, both businesses reported profits and are expanding their operations in the renewable energy market. Given their bright futures, an investor should take into account the risk profile of these companies or consult a financial advisor before making any investment decisions.
| S.NO. | Check Out These Interesting Posts You Might Enjoy! |
|---|---|
| 1 | IndiGo vs SpiceJet |
| 2 | Bharat Petroleum vs Hindustan Petroleum |
| 3 | MRF vs Apollo Tyres |
| 4 | Tata Steel vs. JSW Steel |
| 5 | Mahindra & Mahindra vs Tata Motors |
Frequently Asked Questions (FAQs)
Which firm, NHPC or NTPC, has a higher market capitalization?
The market capitalization of NTPC is more than that of NHPC.
What is the full form of NTPC and NHPC?
National Hydroelectric Power Corporation is abbreviated as NHPC, and the full name of NTPC is National Thermal Power Corporation Limited.
Which company is more profitable: NTPC or NHPC?
For FY 2024, NTPC generated a net profit of 19,696 crores, while NHPC reported a net profit of 4,023 crores, demonstrating that NTPC is more profitable.
What are NTPC and NHPC’s primary business activities?
While NTPC is a well-known player in the thermal power (oil, gas, and coal) generation industry, NHPC is primarily focused on hydroelectric power generation and is regarded as a major player in this area.
Which company has a more diversified business model among NTPC and NHPC?
Compared to NHPC, which mostly concentrates on hydroelectric power, NTPC has a more diverse business strategy because it generates power from various sources, including coal, gas, hydroelectric, solar, wind, etc.