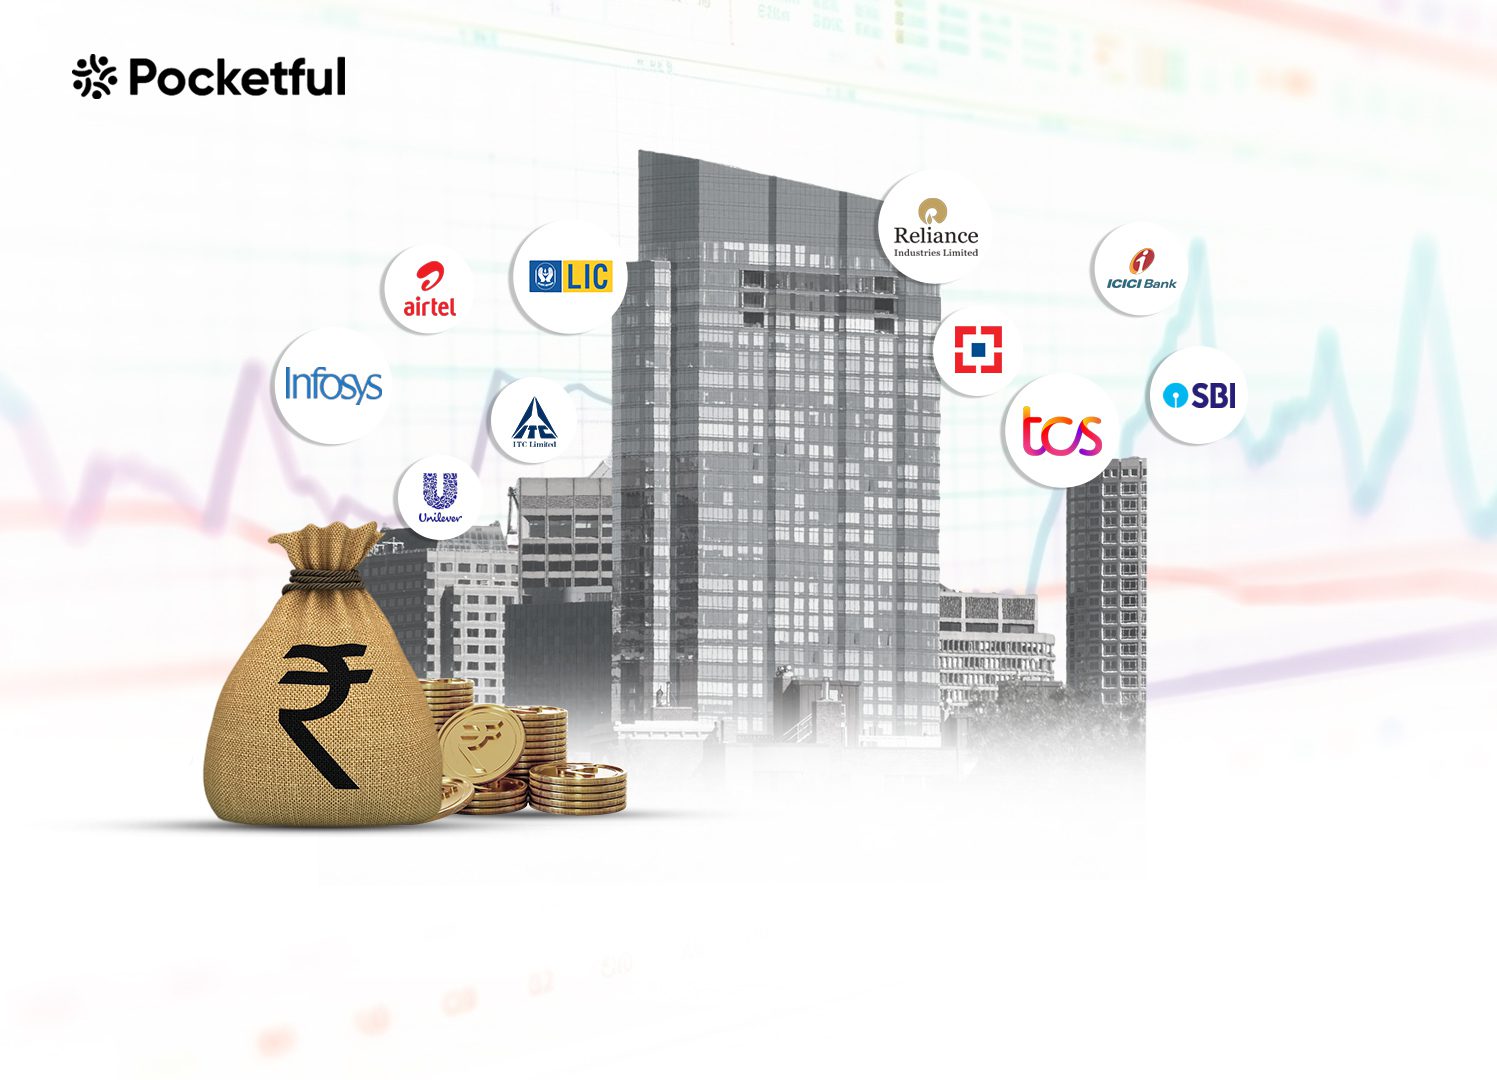
The Indian stock market consists of numerous companies, reflecting the nation’s economic development. Over the past few years, the Indian stock market has witnessed a significant bull run, and the performance of a few sectors has been instrumental in this growth.
This blog explores the leading sectors of the Indian stock market and discusses the future prospects of these sectors, which can be useful for investors wishing to leverage India’s economic prowess.
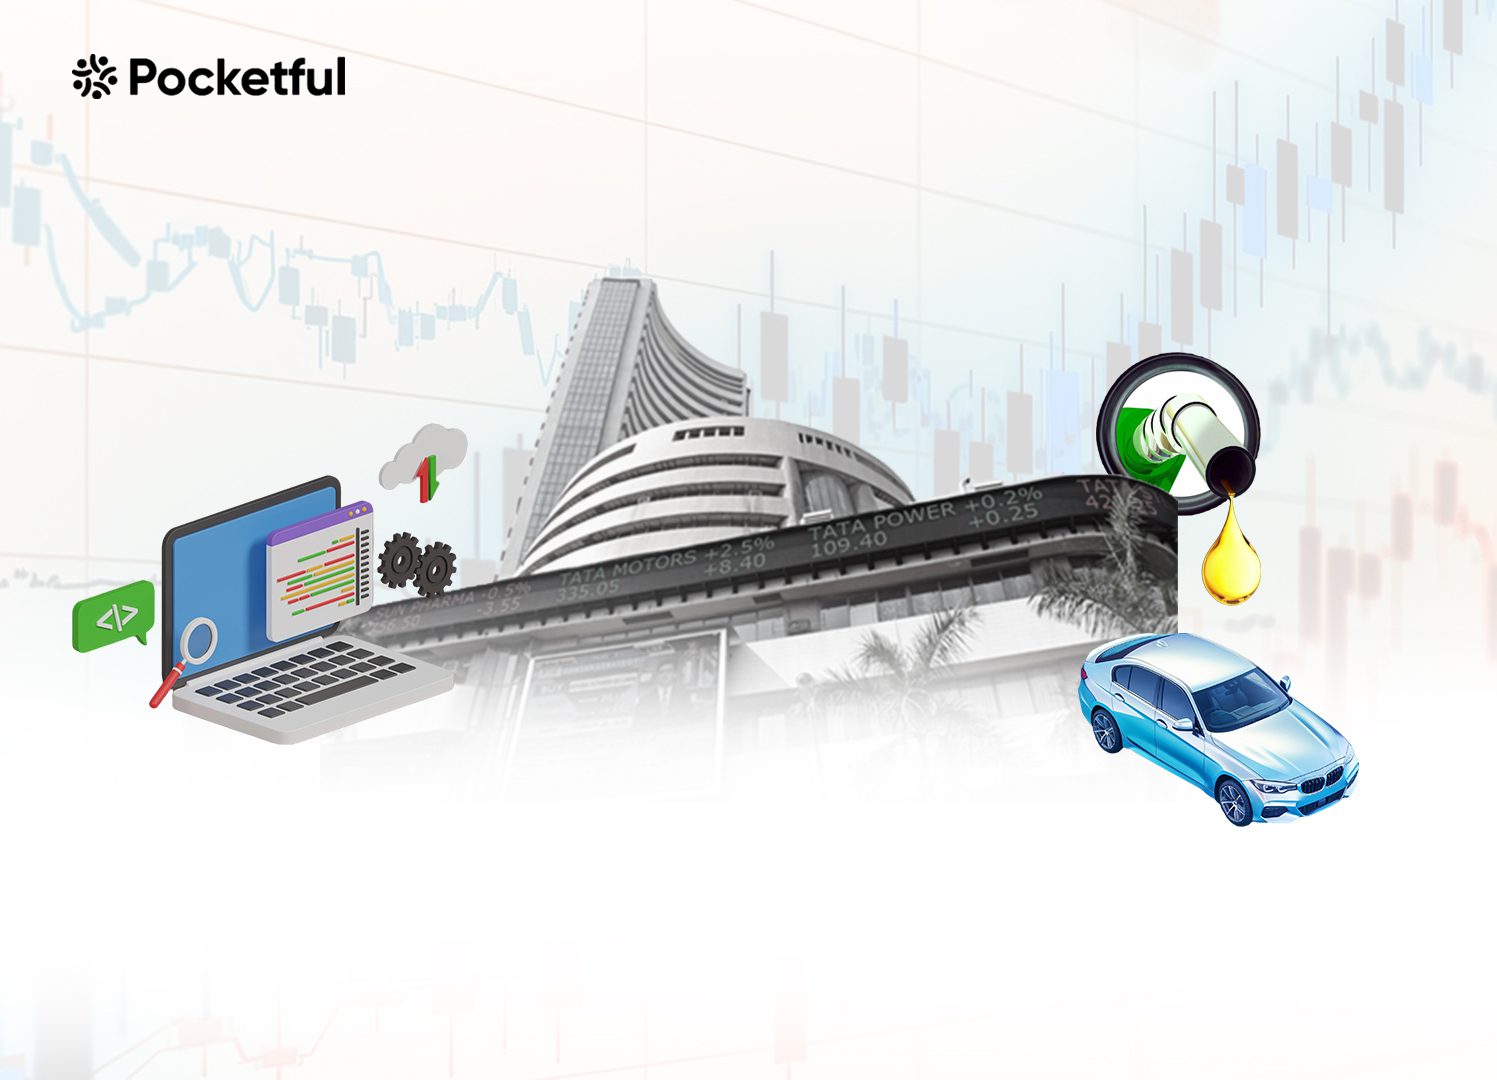
List of Top 10 Sectors in the Indian Stock Market
Here is the list of Top 10 sectors of the Indian stock market:
- Banks
- Software & IT Services
- Financial Services
- Automobile & Ancillaries
- Oil & Gas
- Healthcare
- FMCG
- Metals & Mining
- Power
- Chemicals
Table of Sectors with their Market Capitalization and Industry Association
| Sector | Market Capitalization (in INR crores) | Industry Association |
|---|---|---|
| Banks | 5,011,112 | Indian Banks’ Association (IBA) |
| Software & IT Services | 4,441,195 | National Association of Software and Services Companies (NASSCOM) |
| Financial Services | 3,407,573 | International Financial Services Centres Authority (IFSCA) |
| Automobile & Ancillaries | 3,372,348 | Automotive Research Association of India (ARAI) |
| Oil & Gas | 3,105,266 | Association of Oil & Gas Operators (AOGO) |
| Healthcare | 2,795,612 | Association of Healthcare Providers (AHPI) |
| FMCG | 2,544,662 | FICCI |
| Metals & Mining | 2,208,827 | Federation of Indian Mineral Industries (FIMI) |
| Power | 1,893,012 | Association of Power Producers (APP) |
| Chemicals | 1,706,700 | Indian Chemical Council (ICC) |
Read Also : List Of Best FMCG Stocks In India
Overview of the Best Sectors in India By Market Capitalization
The overview of the top 10 sectors of the Indian stock market is given below:
1. Banks
The Indian banking sector consists of 13 public sector banks, 21 private sector banks, 44 foreign banks, and 12 small finance banks. India has seen strong growth in the banking industry, aided by rising disposable income, easy accessibility to credit, and strong economic growth. Frequent innovations and changes in technology have changed the Indian banking system in the last few decades. Over the last ten years, the Indian digital lending market witnessed a growth of 39.5% CAGR. The private banking sector reached USD 95.7 billion in interest income, while the public sector reached USD 128.1 billion in 2024. There are 602 banks actively using UPI as of July 2024. Government initiatives like Pradhan Mantri Jan Dhan Yojna (PMJDY) have resulted in the opening up of a number of bank accounts and have over 51.11 crore beneficiaries. The deposits made in Jan Dhan’s bank accounts were over USD 25.13 billion till December 2023.
2. Software & IT Services
The Information Technology (IT) sector in India is one of the highest contributors to the economy and is valued at roughly $245 billion in FY 2023. More than 5 million people are employed in the sector, which is expected to reach $350 billion as more businesses seek basic IT and cloud services by the year 2026. Leading companies such as Tata Consultancy Services (TCS), Infosys, and Wipro are transforming India to become a global IT hub. The market is projected to increase at a CAGR of 10-12 % in the forecast period due to technological achievements in AI, machine learning, cyber security, and so on. Nevertheless, some challenges, such as a shortage of a skilled workforce and geopolitical tensions, still exist.
3. Financial Services
The financial services industry of India is one of the most important economic sectors and employs millions, accounting for over 6% of GDP. The sector now stands at a position where it has an aggregate asset base of about ₹150 trillion (USD 2 trillion) and is concentrating on digital transformation. The Reserve Bank of India (RBI) serves as a critical institution in designing policies related to the Indian financial sector and foreign reserves. According to the NASSCOM report, over 2000 entrepreneurs are actively working in the Fintech sector to promote financial inclusion. Challenges related to non-performing assets (NPA assets) and cybersecurity risk persist. The further advancement of the industry will be ensured by the adoption of the latest technologies and the right policy mix.
4. Automobile & Ancillaries
The automobile sector plays a crucial role in economic expansion and technological advancement. The share of this sector in GDP was 2.77% during 1992-1993 which has increased to around 7.1% in FY23. In the global heavy vehicle market, India has a strong position as India is the largest producer of tractors, the second-largest bus manufacturer, and the third-largest heavy truck manufacturer.
The sector can experience further growth in domestic demand due to a rise in income and huge population growth as well as strong export demand in the near future. As the automobile sector is shifting focus towards the manufacturing of electric vehicles, the government of India aims for 30% of new vehicle sales to be electric by 2030.
5. Oil & Gas
India’s oil and gas sector is vital for the economy and accounts for nearly 3% of GDP. As of 2024, India is the third-largest oil consumer in the world, with a daily consumption of over 5 million barrels. Almost 85% of crude oil needs to be imported into India, which means that most of the oil supply is from elsewhere. It is also noted that the government intends to lift the percentage share of natural gas in energy consumption to 15% by 2030. Regulatory measures include the Hydrocarbon Exploration and Licensing Policy (HELP), which aims at attracting investment and gives more freedom to contractors in exploring conventional and unconventional gas resources. Headwinds include inadequate refining infrastructure, price volatility, and climate change.
6. Healthcare
In terms of revenue and employment, healthcare has become one of the largest sectors in the country. As per the economic survey, India’s public expenditure on healthcare was 2.1% of GDP in FY23 and is expected to reach 2.5% by FY25, according to the Healthcare Ministry. India has a competitive advantage as it has a large pool of well-trained medical professionals. As compared to the US or Western Europe, the cost of surgery in India is about 1/10th, giving India a cost advantage. By 2030, the demand for healthcare professionals in India is expected to double. Currently, there are only 1.7 nurses per 1000 people, and the doctor-to-patient ratio stands at 1:1500. To boost the country’s healthcare infrastructure, the Indian government is planning to introduce a credit incentive program worth Rs. 50,000 crores.
7. FMCG
FMCG is the 4th largest sector and has been an essential contributor to India’s GDP. The sector reached USD 167 billion in FY 2023 and is expected to reach USD 615.87 billion by FY 2027. As of 2022-23, FMCG sales grew by 7-9% in the country. Favorable government initiatives, growing consumer demand, rural market and population, and growth of e-commerce platforms are the key growth drivers behind the expansion of the sector. Online retail and e-commerce have made it easier for FMCG businesses to market and sell their products across the country without significant investment in marketing. The FMCG industry is the biggest contributor to digital advertising, holding a 42% share in total digital spending to reach US$9.92 billion in 2023.
8. Metal & Mining
The metal and mining sector in India plays one of the most critical roles for the country’s economic growth contributing roughly 2.5% to GDP and providing jobs to more than one million people. Minerals serve as raw materials for other industries, making the growth of the Indian mining industry essential for the growth of the overall economic development of the nation. Some of the policy measures, such as the National Mineral Policy and the Mines and Minerals (Development and Regulation) Act, intend to ensure sustainability and seek investment for the sector. Other issues persist related to regulatory changes and climate change.
9. Power
The power sector in India is essential for economic growth and the welfare of the economy as a whole. For sustainable growth of the Indian economy, power infrastructure development is crucial. As of June 30, 2024, the country’s current installed power capacity is 446.18 GW making India 3rd most significant producer and consumer of electricity worldwide. In budget 2024, the government took the initiative to allocate funds to green hydrogen, solar power, and green-energy projects. Various schemes are also introduced, like Deen Dayal Upadhyay Gram Jyoti Yojna and the Integrated Power Development Scheme, to ensure an uninterrupted supply of electricity to rural areas and strengthen the transmission network across the country. India is aiming to establish 50% of the total installed electric power capacity using non-fossil fuel-based resources by 2030. Furthermore, India aims for 500 GW of renewable energy, and to meet this target, the Ministry of Power has identified 81 thermal units in which coal will be replaced with renewable energy resources by 2026.
10. Chemicals
India is the 6th largest producer of chemicals in the world, contributing 7% to India’s GDP. Currently, the Indian chemical industry is valued at US$220 Billion, which is expected to reach US$ 1 trillion by 2040. The chemical industry can be broadly classified into specialty chemicals, petrochemicals, polymers, fertilizers, bulk chemicals, and agrochemicals. India holds 14th rank in chemical exports and 8th rank in imports globally. In April-May 2024, exports of organic and inorganic chemicals reached US$ 4.78 billion. To tackle the rising demand of domestic and overseas consumers, specialty chemical companies in India are increasing their production capacities. The government allocated USD 23.13 million to the Department of Chemicals and Petrochemicals, and by 2024, an investment of US$ 107 billion is expected in the Indian chemicals and petrochemicals sector.
Read Also: Fastest Growing Industries in India
Future of Indian Stock Market

The stock market in India has a bright future, and due to the recent bull run, the market capitalization has exceeded the $5 trillion mark on the back of solid GDP growth and growing foreign investments. The Nifty 50 Index is forecasted to keep soaring after having generated a compounded annual return of roughly about 14% over the last ten years. There are a host of reasons why the Indian equities market has managed to inspire such favorable sentiments, some of which are listed below:
- Equities present attractive investment avenues for the Indian middle class with growing disposable incomes.
- Due to growing disposable incomes, domestic consumption has increased tremendously, resulting in the rise of the revenues of Indian businesses.
- The Indian equities market presents attractive investment opportunities for foreign investors due to the young population, strong consumption, and strong GDP growth.
- Government schemes like the Atma Nirbhar Bharat and Production-Linke Incentives were launched to promote domestic manufacturing and exports.
Read Also: 10 Best Copper Stocks in India
Conclusion
There are many sectors in the Indian stock market, and all of them are likely to grow as a result of favorable government policy reforms and enhanced domestic consumption. New investment opportunities will appear as the industries adopt the latest technologies. It is paramount that the peculiarities of each sector be recognized and understood to identify investment opportunities. Information about these sectors will enhance better decision-making and, in turn, result in great investment returns.
| S.NO. | Check Out These Interesting Posts You Might Enjoy! |
|---|---|
| 1 | List Of Best Healthcare Stocks in India |
| 2 | List of Best Telecom Stocks in India |
| 3 | List Of Best Footwear Stocks in India |
| 4 | List Of Best Logistics Stocks in India |
| 5 | List of Best Liquor Stocks in India |
Frequently Asked Questions (FAQs)
What role does the banking sector play in the Indian economy?
The banking sector contributes more than 6% to the GDP of India and plays a significant role in financial intermediation and economic growth.
What are the issues the healthcare sector is facing in India?
Lack of trained professionals and healthcare infrastructure are some of the challenges faced by the healthcare sector in India.
What is the contribution of the automobile sector to the Indian GDP?
The services offered by the automobile sector amount to 7.1% of the Indian GDP and are considered to be the backbone of economic development and employment generation.
How does the power sector contribute to the development of the Indian economy?
With an installed capacity of 446.18 GW, the power sector assists economic growth and sustains various development measures across various sectors.
What are the future prospects of the financial services sector in India?
The financial services industry is likely to grow significantly due to digital transformation and is expected to stay on a constant upward growth path while promoting and achieving financial inclusion.